Gold
No announcement yet.
X
  • وقت
  • دکھائیں
Clear All
new posts
  • #646 Collapse

    Technical Analysis of XAU/USD

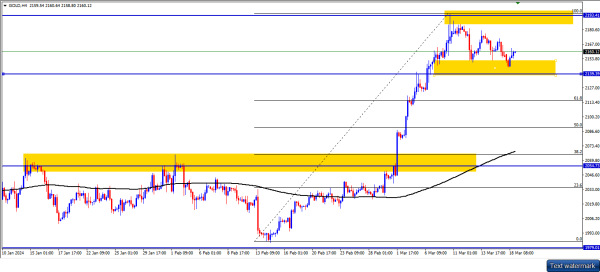
    Gold ke prices ne 2150 support level se phir se rebound kiya hai jab strong gains ke baad wo lower correction ki taraf gaye thay, jinse unka naya record high 2195 par pohnchna tha. Agar gold prices mazeed barhne lagte hain, toh wo 20-period moving average par 2171 mein resistance encounter kar sakte hain pehle 2185 level ko challenge karte hue. Uske baad, rally naye record level 2195 par pohnchte hi tham sakti hai. Ummeed hai ke gold prices jo 2150 support aur 23.6% Fibonacci retracement of 1984-2195 uptrend at 2145 ko break karte hain, aagey ki taraf pullback ko trigger kar sakein 50-period MA at 2139 tak. Downtrend phir 2123 area aur 38 Fibonacci retracement level tak extend ho sakta hai. Overall, uptrend haal mein bearish moves ke bawajood strong hai char ghantay ki chart par. Agar 200-period moving average ke upar jaaye toh technical outlook zyada neutral ho jayega.
    Click image for larger version

Name:	g 4hh.png
Views:	61
Size:	26.1 کلوبائٹ
ID:	12870433

    Gold ne ek shooting star reversal pattern banaya hai. Device ab downward wave par reverse signal experience kar rahi hai. Correction ke liye nishana 2130.00 level ho sakta hai. Support level ko test karne ke baad, price rebound kar sakti hai aur uptrend ka development jari rakh sakti hai. Lekin agar support level test nahi kiya gaya toh quotes 2190.00 tak barh sakte hain.

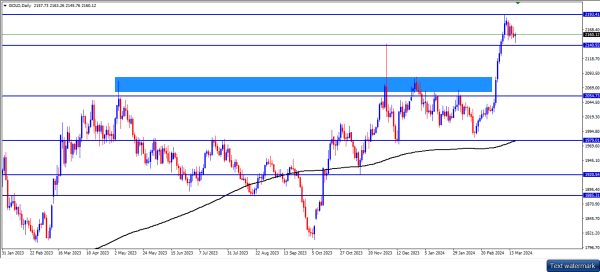
    Haal mein ki sell-off ke bawajood, overall gold price trend bullish hai, aur daily chart ke hisaab se, gold prices kaafi kamzor nahi hone waale hain jo 2080 support level ke taraf ja rahe hain. US$2,020 per ounce. Overall upward trend ke zariye, resistance $2165 aur $2180 per ounce par rahega. Behtareen hai gold ko bechna lekin bina kisi risk ke. Gold price ka tajwez hai $2,067.94 per ounce. Mahine ke end tak, global macroeconomic models aur analyst forecasts ke mutabiq. Aage dekhte hue, hum ummeed karte hain ke gold 12 mahine mein 2134.44 par trade karega.
    Click image for larger version

Name:	g d.png
Views:	91
Size:	25.8 کلوبائٹ
ID:	12870432
       
    • <a href="https://www.instaforex.org/ru/?x=ruforum">InstaForex</a>
    • #647 Collapse

      Gold price phir se buland hua, jab ke pichle haftay ko market ke harkaat ne dabaya tha. Magar, jo bull run hua woh ab bhi resistance line ya MA 50 line ko tor nahin saka. Subah tak keemat ab bhi MA 50 line ke neeche thi, ek khareedne wale candle ka dhancha tha, lekin halaat kamzor ho rahe thay. Nazar aa raha hai ke mumkin hai ke mumkin hai ke candle chhota hota ja raha hai aur resistance line ya MA 50 line ke qareeb jaane par shadow ka inkar hota hai. Sona ka agla harkat ya aaj ki bhavishyavani, agar mojooda keemat ke halaat dekhein, sona ab bhi bearish mein wapas jaane ki zyada imkaan hai kyun ke jo bullish hua woh abhi tak resistance line ko nahi chhed saka magar khareedne wale kamzor mehsoos kar rahe hain, isliye jo bullishness is waqt hoti hai woh sirf ek keemat ki durusti hai aur phir keemat phir se gir jayegi. Lekin sona phir se buland hone ki mumkinat ka khayal rakhein, kyun ke sona ka trend badal gaya nahi hai (abhi bhi bullish hai) to keemat abhi bhi agle harkat ke liye bullish hone ki mumkinat rakhti hai. Upar di gayi tajziya ke mutabiq, aaj ka sona ka harkat ka andaza phir bhi bearish hone ki mumkinat hai kyun ke keemat abhi tak MA 50 line aur resistance ke neeche hai, isliye aaj sona mein trade karne ke liye bechne ki moqa talash kar sakte hain. Agar keemat phir se barh jaye aur MA 50 line aur 2172.48 ke resistance line ko tor de, to chonke agar keemat resistance line ko tor de to sona ko apni bullish reliance ko dobara shuru karne ki mumkinat hai aur agar highest resistance line 2193.06 ko dobara tor de to phir maloom nahin kahaan khatam hoga. Upar di gayi bhavishyavani ke mutabiq, sona ke trading moqaat niche diye gaye hain:


      Click image for larger version

Name:	h4.jpg
Views:	64
Size:	142.9 کلوبائٹ
ID:	12870511

      Sell trades options:

      Hum bechne ke moqay hasil kar sakte hain jab tak resistance line 2168.32 ke neeche ikhtiyar karne wala candle bana hai. Hum munafa ka nishan 2145.62 aur 2124.52 par rakh sakte hain. Agla bechne ka moqa hai jab keemat giray aur line 2145.62 ko tor de. Hum munafa ka nishan line 2124.52 - 2110.15 par rakh sakte hain. Hum khareedne ka moqa ikhtiyar kar sakte hain jab keemat barh jaye aur resistance line 217248 ko tor de. Hum munafa ka nishan resistance line par 2193.06 par rakh sakte hain.

      Buy trades options:

      Agla khareedne ka moqa ikhtiyar karne ke liye hum intezar kar sakte hain jab keemat giray aur keemat line 2145.62 par inkar banaye. Hum munafa ka nishan line 2168.32 aur 2193.06 par rakh sakte hain.
         
      • #648 Collapse

        Gold H-1 Time Frame


        Gold ke recent price action ko dekhte hue, naye record high 2190 par pohnchna ek significant milestone hai. Agar gold prices mazeed barhne lagte hain, toh wo 30-period moving average par 2170 mein resistance encounter kar sakte hain, pehle 2185 level ko challenge karte hue. Is scenario mein, traders ko careful hona chahiye aur price action ko closely monitor karna chahiye taake woh sahi waqt par apne trading decisions ko adjust kar sakein.


        Jab gold prices 2170 ke aas paas hote hain, toh 30-period moving average ek important technical indicator ban jata hai jo price ke further upside movement ko rok sakta hai. Yeh level traders ke liye ek crucial point ban jata hai jahan se woh apne long positions ko evaluate aur manage kar sakte hain. Agar price is level ko break kar leta hai aur 2185 tak pohchta hai, toh yeh ek bullish signal ho sakta hai aur traders ko further upside movement ki ummeed ho sakti hai.


        Iske baad, jab rally naye record level 2195 par pohnchte hai, toh waha tham sakti hai. Naye record high levels par price mein thamne ki sambhavna hoti hai kyun ke traders profit booking ke liye interested ho sakte hain aur selling pressure a sakta hai. Isliye, yeh level traders ke liye ek aur important resistance level ban jata hai jise monitor karna zaroori hai.


        Ummeed hai ke gold prices jo 2140 support aur 23.6% Fibonacci retracement of 2100 uptrend at 2140 ko break karte hain, aagey ki taraf pullback ko trigger kar sakein 100-period MA tak. Jab gold prices down trend mein hote hain, toh 2140 ek crucial support level ban jata hai jise break karne ke baad selling pressure aur downtrend ki sambhavna badh jati hai. Agar yeh level break hota hai, toh traders ko pullback ki sambhavna hai jahan price 100-period MA tak ja sakta hai. Yeh level bhi traders ke liye ek important level hai jise monitor karna zaroori hai.


        Downtrend phir 2123 30% Fibonacci retracement level tak extend ho sakta hai. Fibonacci retracement levels technical analysis mein important hote hain aur yeh price ka movement aur retracement ke levels ko analyze karne mein madad karte hain. 30% Fibonacci retracement level, agar 2140 support level break hota hai, ek potential target ban sakta hai jahan price down trend mein ja sakti hai.


        Is tarah se, gold ke price action ke mukhtalif aspects ko analyze karke, traders apne trading decisions ko better tarike se samajh aur adjust kar sakte hain. Technical indicators aur key levels ko monitor karke, traders apne trades ko manage kar sakte hain aur market ke fluctuations ke saath sath tayyari rakhte hue apne trading
        strategies ko optimize kar sakte hain.

        Click image for larger version

Name:	Screenshot_2024_0319_075956.jpg
Views:	59
Size:	68.3 کلوبائٹ
ID:	12870618
           
        • #649 Collapse

          Sona 1 Ghanta Analysis


          Sona ka daur, jo pichle haftay ko thanda pad gaya tha, ab phir se buland hua hai. Yeh mojooda halaat mein zaroori hai ke hum is doraan ki darustiyon aur maamlaat ka jayeza lein taake future ki trading ke liye tayyar rah sakein. Pichle haftay ke mukhtalif harkaat ne sonay ki keemat ko neeche daba diya tha, lekin ab iske daur ne phir se ubharne ki nishaniyan di hain.
          Haal mein, sona ki keemat mein bulandiyon ki nazar aayi hai, jise pehle ke haftay ki ghatiyon ne kamzor kar diya tha. Lekin, yeh important hai ke sona ka daur ab bhi resistance line ya MA 100 line ko tor nahin saka hai. Subah tak, sona ki keemat ab bhi MA 150 line ke neeche thi, jo ke ek crucial technical level hai.
          Ek cheez jo humein nazar aarahi hai wo hai ke jo bull run hua woh ab bhi resistance line ya MA 100 line ko tor nahin saka hai. Yeh ek important observation hai, jo ke hamari trading ke faislon ko influence kar sakta hai. Agar sona ke daur ne in technical levels ko break nahin kiya, toh yeh ek sign ho sakta hai ke market abhi bhi consolidation phase mein hai aur mukhtalif forces mein samjhaute ke liye tayyar hai.
          Subah tak, ek khareedne wale candle ka dhancha tha, lekin halaat kamzor ho rahe thay. Yeh is baat ka saboot hai ke market mein abhi bhi kuch uncertainty hai aur traders cautious hain. Yeh bhi mumkin hai ke candle chhota hota ja raha hai aur resistance line ya MA 100 line ko torne mein kamiyab nahin ho raha hai.
          Is doraan, ek zaroori sawal yeh hai ke kya sona ka daur abhi tak ek temporary rally hai ya phir iska koi mazboot foundation hai. Is sawal ka jawab talash karne ke liye, humein market ki mukhtalif indicators aur factors ko ghor se dekhna hoga. Ismein shaamil hain market sentiment, economic indicators, aur geopolitical developments.
          Aakhri tor par, yeh zaroori hai ke hum apni trading strategy ko adjust karte hue mukhtalif scenarios ka tayyar rahen. Agar sona ke daur ne resistance levels ko tor diya, toh yeh ek bullish signal hoga aur humein mazeed upside ki umeed ho sakti hai. Lekin agar yeh na ho, toh humein cautious rehkar apni positions ko monitor karte hue tayyar rehna chahiye.
          Summarizing it all up, sona ka daur phir se buland hua hai lekin abhi tak crucial technical levels ko tor nahin saka hai. Market mein uncertainty aur cautiousness nazar aa rahi hai. Humein mukhtalif scenarios ko samajhne aur trading strategy ko uske mutabiq adjust karke future ki trades ke liye tayyar rehna chahiye.
          Click image for larger version

Name:	Screenshot_2024_0319_171139.jpg
Views:	61
Size:	70.7 کلوبائٹ
ID:	12871538
             
          • #650 Collapse

            Sona H1 Time Frame

            Jab market rally naye record level par pahunchti hai, jaise ki 2159, toh waha par thamne ki sambhavna hoti hai. Yeh thamav price ke peeche kuch reasons hote hain jo ki market ke dynamics ko influence karte hain. Jab price ek naya high level tak pahunchti hai, toh kuch traders profit booking ke liye interested ho sakte hain. Yeh matlab hai ki ve apne positions ko close karke apne profits secure karne ki koshish kar sakte hain. Iske alawa, naye record high levels par price mein selling pressure bhi a sakta hai. Yeh us waqt hota hai jab market ke kuch participants lagatar selling karte hain, jisse price mein thamav aata hai ya phir price neeche aa sakta hai.
            Is tarah ke situations mein, naye record high levels traders ke liye ek important resistance level ban jata hai. Resistance level ek aise level hota hai jahan par price ko rok kar rakhta hai aur neeche jaane se rokta hai. Traders ko in levels ko monitor karna zaroori hota hai taaki ve market ke dynamics ko samajh sakein aur apne trading strategies ko us ke according adjust kar sakein.
            Jab price naye record high levels par pahunchta hai, toh kuch traders apne positions ko close karke apne profits secure karne ke liye interested hote hain. Yeh un traders ke liye ek natural instinct hai jo market mein profit earn kar rahe hote hain. Isi tarah se, kuch traders neeche ki taraf jaane se bachne ke liye apne positions ko close karte hain. Yeh profit booking ka process hota hai jo ki market mein thamav la sakta hai.
            Selling pressure bhi ek important factor hota hai jo ki naye record high levels par price mein dikhai deta hai. Jab price ek naya high level tak pahunchti hai, toh kuch traders selling karte hain jisse ki price neeche ja sake. Yeh un traders ke dwara kiya jata hai jo ki market ko overbought ya phir overvalued samajhte hain aur isliye neeche ki taraf jaane se bachna chahte hain.
            Is prakar, naye record high levels par price mein thamav aane ki sambhavna hoti hai kyun ke profit booking aur selling pressure ke karan traders interested hote hain. Yeh levels traders ke liye important resistance levels ban jate hain jinhe monitor karna zaroori hota hai. Is tarah ke levels ko monitor karke traders apne trading strategies ko adjust kar sakte hain aur market ke dynamics ko samajh sakte hain.
            Click image for larger version

Name:	Screenshot_2024_0320_045600.jpg
Views:	60
Size:	70.6 کلوبائٹ
ID:	12871991
               
            • #651 Collapse

              Technical Analysis of XAU/USD

              Gold ki keemat mein Tuesday ko achi izafaat dekhi gayi jab ke qeemat mein izafaat ke liye talaash jaari rahi. Index ne December mein 2,144 ka aala level chua aur Powell ke taqreer se pehle, jo ke congressi aur US jobs data ke liye hai, index ko mazid mustaqil hone ka imkaan hai. Technically, gold ki keemat chaar ghante ke frame mein ek balancing candle (Doji) ke baad naye uptrend ka aghaz kar sakti hai, jo 2155 ke qareeb bana hai. Technical indicators abhi bullish nahi hain, MACD negative hai aur stochastic abhi bhi nichli taraf ja raha hai. Iske alawa, RSI abhi bhi overbought zone mein hai, jo jald hi bearish correction ka silsila shuru kar sakta hai.

              Agar gold ki keemat apni qareebi izafaat jaari rakhti hai, toh woh key resistance 2144 par challenge kar sakti hai. Jab yeh tod diya jata hai, toh agla bounce pehle ke downtrend ka 161.8% Fibonacci extension, yani 2152, tak jaari reh sakta hai phir agle maqasid 2175 ke qareeb, aur 2150 ke psychological mark ko organize aur test karna. Dusri taraf, agar gold ki keemat girne lagti hai, toh pehle 2125 par support mil sakta hai. Yeh pehle 2110 aur 20-day EMA ke darmiyan wale ilaqe mein support mil sakta hai jo 2102 hai. Iske neeche, December resistance tak girne se pehle, ek gehra bearish move ka imkaan hai 2087 tak.

              Click image for larger version

Name:	g 1h.png
Views:	56
Size:	26.2 کلوبائٹ
ID:	12871994

              Mukhtasir tor par, chand dinon mein gold apni 2023 ke sab se oonchi ke qareeb ek consolidation trend mein dakhil ho sakta hai. Uchit darje ke do candleon ki shakal ka zahoor bahter tarah se tasdiq nahi kiya ja sakta. Magar, 2100 aur 20-day EMA ke upar ke qayam ke saath, ek musbat nazar ka imkaan hai.

              Hamari gold trading platform ke mutabiq, likhne ke waqt, gold ki keemat ounce par $2,148 ke support level par gir gayi hai, aur is haftay ke unchaai ka resistance level $2,163 per ounce hai. Gold ki keemat mustaqil hai. Main umeed karta hoon ke gold ki keemat neutral aur nichli rahegi, is haftay global central bank announcements ka jawab muntazir hai. Abhi ke liye, gold ke overall trend ko upar ki taraf dekha ja raha hai, aur yeh trend support levels $2110 aur $2070 ko toorna bina toota nahi ja sakta. Main all-time highs se gold ko bechne ko prefer karta hoon bina kisi risk ke.

              Click image for larger version

Name:	g 4h.png
Views:	114
Size:	26.9 کلوبائٹ
ID:	12871993
                 
              • #652 Collapse


                Gold price outlook:


                Chart pay gold price ko agar ham h4 time frame pay analyzed kartay hain to h4 chart pay price 2057.00 pivot point line say aik big bullish candle k sath upward breakout k sath closed hue hai. agar chart pay ham custom indicator ki reading ko daikhtay hain to osma indicator levels k center main sell ka signal show kar raha hai. agar current price monday market open k bad sbuy ki movements ko start karty hai to chart pay price ki up movements k chances strong ban saktay hain jiska target ooper 2076.00 aur phir usk bad price mazeed 2082 resistance zones ko test kar sakty hai.
                agar current price 4 hour chart pay reversed hoty hai, aur sath central point line k sell main breakout karty hai to chart pay price ki dnward movements k chances ban saktay hain, jiska target neechay 2051.00 aur phir usk bad price mazeed 2046 support levels ko test kar sakty hai. Mairay analysis k hisab say price ka current temporary trend down ka start ho chuka hai, aur sath price central point line k bhi down main breakout kar chuki hai, is liye chances yahi hain k price strongly tour par resistance levels ko test kar sakty hai.
                Click image for larger version

Name:	image_141240.jpg
Views:	59
Size:	47.3 کلوبائٹ
ID:	12872059
                daily Chart pay gold price ko agar ham analyzed kartay hain to chart pay price 2057.00 pivot point line say aik big bullish candle k sath upward breakout k sath closed hue hai. agar chart pay ham custom indicator ki reading ko daikhtay hain to osma indicator levels k center main sell ka signal show kar raha hai. agar current price monday market open k bad sbuy ki movements ko start karty hai to chart pay price ki up movements k chances strong ban saktay hain jiska target ooper 2076.00 aur phir usk bad price mazeed 2082 resistance zones ko test kar sakty hai.
                agar current price daily chart pay reversed hoty hai, aur sath central point line k sell main breakout karty hai to chart pay price ki dnward movements k chances ban saktay hain, jiska target neechay 2051.00 aur phir usk bad price mazeed 2046 support levels ko test kar sakty hai. Mairay analysis k hisab say price ka current temporary trend down ka start ho chuka hai, aur sath price central point line k bhi down main breakout kar chuki hai, is liye chances yahi hain k price strongly tour par resistance levels ko test kar sakty hai
                   
                • #653 Collapse

                  Title: XAU/USD ka Technical Tahlil

                  **Muqadma:**
                  XAU/USD ka technical tahlil ek mukhtasir introduction hai jo sonay aur dollar ke darmiyan ke tajziyati asoolat ko samjhta hai. Is tahlil mein hum XAU/USD ke chart patterns, technical indicators aur trend analysis ko tajziya karenge.

                  **Chart Patterns (Chart Ke Nashist):**
                  Chart patterns XAU/USD ke price movements ko analyze karne ka ek important tareeqa hai. Yeh patterns market mein mawjud sentiment aur future price movements ko samajhne mein madadgar hote hain. Kuch aham chart patterns mein "Head and Shoulders", "Double Top", aur "Ascending Triangle" shamil hain.

                  **Technical Indicators (Takneeke Indicators):**
                  Takneeke indicators XAU/USD ke price trends ko samajhne aur predict karne ke liye istemal kiye jate hain. Yeh indicators market ke volume, momentum, volatility, aur other factors ko analyze karte hain. Kuch popular technical indicators mein "Moving Averages", "Relative Strength Index (RSI)", aur "Stochastic Oscillator" shamil hain.

                  **Trend Analysis (Rujhan Ki Tahlil):**
                  Trend analysis XAU/USD ke price movements ko long-term aur short-term trends mein tajziya karta hai. Is tahlil mein hum trend lines, support aur resistance levels, aur trend reversal points ko dekhte hain. Yeh tahlil traders ko market ka direction samajhne mein madadgar hoti hai.

                  **Conclusion (Nateeja):**
                  XAU/USD ka technical tahlil ek mukhtasir introduction hai jo traders ko market ke tajziyati asoolat samajhne mein madadgar hota hai. Chart patterns, technical indicators, aur trend analysis ke istemal se traders XAU/USD ke price movements ko predict aur analyze kar sakte hain. Yah tahlil un traders ko mawaidat faraham karti hai jo apne trading strategies ko improve karna chahte hain.
                   
                  • #654 Collapse

                    Sona ke daam phir se buland hue, lekin pichle haftay ko market ki harkaat ne ise dabaya tha. Is ke bawajood, bull run abhi tak resistance line ya MA 50 line ko tor nahin saka. Subah tak, keemat abhi bhi MA 50 line ke neeche thi, ek khareedne wale candle ne apna dhancha dikhaya, lekin halaat kamzor ho rahe thay. Nazar aa raha tha ke mumkin hai ke candle chhota hota ja raha hai aur resistance line ya MA 50 line ke qareeb jaane par shadow ka inkar hota hai. Yeh naye halaat ne market mein kuch tashweesh paida ki thi. Sona ke daam mein bulandiyon ka hona aam baat hai, lekin jab tak woh resistance line ya MA 50 line ko tor nahin sakte, market mein stability ka sawal bana rehta hai. Investors ko ab khof hai ke agar candle ka size aur resistance line ya MA 50 line ke qareeb jaane par shadow ka inkar jari rahe, toh yeh ek weak signal ho sakta hai. Market ke participants mein dar aur uncertainty barh gaya hai.

                    Sona ka agla harkat kaafi crucial hoga. Agar wo resistance line ya MA 50 line ko paar kar leta hai, toh yeh bullish indication ho sakta hai aur daamon mein aur bulandiyan mumkin hain. Lekin agar yeh support levels ko toarta hai, toh yeh bearish signal ho sakta hai aur aur kamiyaabi mein mazeed girawat mumkin hai. Is waqt, investors ko baaqaida dhiyan dena hoga aur market ke mawad ki gehraai ko samajhna zaroori hai. Market mein instability aur volatility ka samna karna pad sakta hai, aur is par tayyar rehna zaroori hai. Click image for larger version

Name:	Screenshot_5.png
Views:	52
Size:	16.7 کلوبائٹ
ID:	12872158 Overall, sona ke daamon ki harkat mein tawajjo rakhne ka waqt hai. Resistance aur support levels ko monitor karna, candle patterns aur market ke mawad ki tabdeeliyon ko dekhna, aur sahi waqt par faislay karne ka intezar karna zaroori hai.
                       
                    • #655 Collapse

                      Gold prices have once again rebounded from the support level of 2150 after experiencing strong gains followed by a downward correction, leading them to reach a new record high of 2195. If gold prices continue to rise, they may encounter resistance at the 20-period moving average around 2171. The recent movement in gold prices reflects a recurring pattern in the market. After a period of significant appreciation, prices often undergo a corrective phase before resuming their upward trajectory. This correction is typically characterized by a temporary decline in prices, which can be seen as an opportunity for traders and investors to enter or add to their positions. The support level at 2150 has proven to be a crucial point for gold prices, acting as a foundation for their recent rebound. This level represents a significant area of demand, where buyers are willing to step in and support the price, preventing it from falling further. The fact that gold prices have bounced back from this level reaffirms the bullish sentiment prevailing in the market.


                      However, it's essential to note that while gold prices have rebounded, they may face resistance as they attempt to climb higher. One key level to watch is the 20-period moving average, currently situated around 2171. Moving averages are widely followed technical indicators that help traders identify trends and potential areas of support or resistance. The 20-period moving average, in particular, is often used by traders to gauge short-term momentum and trend direction. If gold prices continue to rise, they may encounter selling pressure around the 2171 level, as traders who bought at lower prices may look to take profits. Additionally, other technical factors, such as overbought conditions or bearish chart patterns, could contribute to resistance at this level.


                      Despite potential resistance, the overall outlook for gold remains positive, driven by a combination of factors such as inflation concerns, geopolitical tensions, and central bank policies. These factors continue to support demand for gold as a safe-haven asset and a hedge against uncertainty in the global economy.
                      In conclusion, while gold prices have rebounded from the support level of 2150, they may face resistance at the 20-period moving average around 2171. Traders and investors should closely monitor these key levels and technical indicators for further insight into the direction of gold prices in the near term.


                      Click image for larger version

Name:	Screenshot_3.png
Views:	52
Size:	16.4 کلوبائٹ
ID:	12872450
                       
                      • #656 Collapse

                        Gold Takneeki chhaan been


                        Gold ki qeemat ka mushahida karna
                        aur us mein trading positions lena aham aur support janak kirdar ada karta hai. Jab gold ki qeemat naye record high levels tak pahunchti hai, jese ke 2120 tak, to kuch traders apne positions ko band kar ke apni munafa ko mehfooz karne ke liye dilchaspi rakhte hain. Ye natural instinct hai jo aise traders ke liye zaroori hai jo market mein munafa kama rahe hote hain.


                        Isi tarah, kuch traders neeche ki taraf jane se bachne ke liye apne positions ko band kar dete hain. Ye zaroori hai un traders ke liye jo market ki fluctuations se bachna chahte hain aur apna capital mehfooz rakhna chahte hain. Ye ek munafa booking ka process hai jo ke market mein thamav la sakta hai.


                        Is waqt, jab gold ki qeemat 2120 tak gir rahi hai, to ye ek potential entry point ho sakta hai sell positions ke liye. Traders ko technical analysis ka sahara lena chahiye jese ke support aur resistance levels ko samajhna, chart patterns ka pehchan karna, aur oscillators ka istemal karna.


                        Saath hi, risk management bhi bohot zaroori hai. Traders ko apne stop-loss orders set karke apne nuksan ko seemit karna chahiye aur overleveraging se bachna chahiye.


                        In sab factors ko madhya mein rakhte hue, gold ki qeemat mein sell position lena ek strategic decision ho sakta hai. Lekin, ye nirnay har trader ke liye alag hota hai aur har vyakti ko apne trading plan aur risk tolerance ke mutabiq amal karna chahiye.


                        Jab gold ki price naye record high levels par pahunchti hai, to wahan kuch traders apne positions ko close karke apne munafa ko mehfooz karne ke liye dilchaspi rakhte hain. Ye un traders ke liye ek natural instinct hai jo market mein munafa earn kar rahe hote hain. Isi tarah se, kuch traders neeche ki taraf jaane se bachne ke liye apne positions ko close karte hain. Ye profit booking ka process hota hai jo ki market mein thamav la sakta hai.


                        Aur jab gold ki price 2120 tak gir rahi hai, to ye ek potential entry point ho sakta hai sell positions ke liye. Traders ko technical analysis ka sahara lena chahiye jese ke support aur resistance levels ko samajhna, chart patterns ka pehchan karna, aur oscillators ka istemal karna. Saath hi, risk management bhi bohot zaroori hai. Traders ko apne stop-loss orders set karke apne nuksan ko seemit karna chahiye aur overleveraging se bachna chahiye.

                        Click image for larger version

Name:	Screenshot_2024_0320_102827.jpg
Views:	50
Size:	77.0 کلوبائٹ
ID:	12872487
                           
                        • #657 Collapse

                          GOLD H1 TIME FRAME

                          Zahiri tor par, sona ek aur baar neeche ki taraf chalayala phir se seher ke European market mein ek khabron ke asar se din mein gahra girawat ka silsila dekha, lekin madad ka sahara upar aur neeche nazr aaya, aur sham ko dobara kholne ki keemat tak wapas aagaya, is tarah 2146 ka faisla yahan ho gaya. Halqi chart ke mutabiq, agar yeh torh jaata hai, toh aur girawat hogi. Warna, daily chart ke mutabiq, keemat ghat rahi hai, aur uncha bindu neeche ja raha hai. Magar kal ek dohra nichla buna, aur subah fere ko phir se ho raha tha. Kya keemat ek trapezoidal jaal bana sakti hai taake chhote bechne ko raazi kare? Yeh dekhne ke laayak hai. Keemat ka uthna aur girta hona ek trend banaata hai. Trend ki inertia keemat ko oopar aur neeche le jaati hai. Keemat ka uthna aur girta hona trend ko badal deta hai. Trend ek aisa cycle hai, aur market 28 ka qanoon follow kar raha hai. Ab sab dekh sakte hain ke yeh girta hai. Magar kya mukhya takat aise sochegi? Mujhe lagta hai, keval agar din bhar mein sab dishaon mein position tor diya jaata hai. Toh amumana tor par, aaj ke liye sona chhota aur chhota hai. Agar 2160 tora nahi gaya, toh aap market mein ja sakte hain. Agar mazboot tor ho, toh 2163 tor kaam karega. Lakshya hai 2170-2180. Agar tora nahi gaya, toh chhote se loton mein chhote mein ja sakte hain. Zaroor, agar position tor di gayi hai, toh phir se 2167-2170 ka intezaar karein aur phir se chhote mein ja sakte hain. Agar neeche hai, toh din ke short term ke liye 2150-2145 par dhyan den aur agar tora nahi gaya, toh long ja sakte hain. Bas, 2145 ke neeche ek chhota position rakhein aur 2130-2120 ko dekhein. Zaroor, maujooda mashwara sirf reference ke liye hai. Khaas taur par aaj ke market ki wajah se, hum yeh mumkinat ka khatra nahi nikal sakte ke saanp aur bailon ke zahri dhone aur phir palatne ka samna ho. Is maamle mein, jo bhi bullish ya bearish hai, voh yaad rakhein ke achhi position torne ki palat ko bachane ke liye ek accha list up karein. Aakhir mein, sab ko kamiyabi ki duaen.

                          Click image for larger version

Name:	Screenshot_2024-03-20-11-39-14-03_a068875e8d70110f8d1ec48729c67374.jpg
Views:	47
Size:	283.4 کلوبائٹ
ID:	12872658
                          • #658 Collapse

                            Recently, the trajectory of gold prices has undergone a significant shift, deviating from its previous pattern of maintaining a downward trend within a triangle formation on a daily basis. This alteration in direction has also been reflected in an internal bar pattern, where the price surged above the resistance of the previous bar at 2061.69, indicating a potential shift towards the next support level. The fluctuations in the price of gold have been closely monitored by investors and analysts alike, with many attempting to decipher the underlying factors driving these movements. Historically, gold has been regarded as a safe-haven asset, often sought after during times of economic uncertainty or geopolitical tension. However, recent market dynamics have introduced new variables into the equation, leading to increased volatility and unpredictability. One of the key contributing factors to the recent shift in gold prices is the evolving macroeconomic landscape. Central bank policies, inflationary pressures, and currency fluctuations all play a role in shaping investor sentiment towards gold. Additionally, developments in global trade, such as trade agreements or tariffs, can have a significant impact on the demand and supply dynamics of the precious metal.


                            Moreover, the interplay between gold prices and other asset classes, such as equities and bonds, further adds to the complexity of the situation. In times of economic expansion, investors may opt for riskier assets, diverting attention away from gold. Conversely, during periods of market downturns or heightened volatility, gold tends to regain its appeal as a safe-haven asset.Technical analysis also offers insights into the shifting dynamics of gold prices. Chart patterns, such as triangles and bar formations, provide traders with valuable information regarding potential trend reversals or continuation patterns. The recent break above the resistance level in the internal bar pattern signals a bullish sentiment among traders, potentially leading to further upside momentum in the price of gold.


                            However, it's important to note that the landscape of the financial markets is inherently unpredictable, and unforeseen events or developments could quickly alter the trajectory of gold prices once again. Geopolitical tensions, unexpected policy decisions, or shifts in investor sentiment could all contribute to renewed volatility in the gold market. In conclusion, the recent deviation from the established downward trend in gold prices, both in terms of daily patterns and internal bar formations, highlights the dynamic nature of the precious metal market. While various factors, including macroeconomic conditions, geopolitical tensions, and technical analysis, provide insights into the current state of affairs, the future trajectory of gold prices remains uncertain. Investors and analysts will continue to closely monitor developments in the financial markets, adjusting their strategies accordingly to navigate the ever-changing landscape of gold trading.


                            Click image for larger version

Name:	Screenshot_6.png
Views:	50
Size:	16.8 کلوبائٹ
ID:	12872731
                             
                            • #659 Collapse

                              Gold ka H1 timeframe dekhte hue, lag raha hai ke iski qeemat abhi bhi ek uthatay hue channel ke andar hai, lekin filhal sirf us channel ke lower limit ke ooper trade kar rahi hai. Chart wazeh tor par dikhata hai ke qeemat kaafi arsay se ek wazeh upar ki taraf bias ke saath trade kar rahi hai aur baar baar apni chotiyo ko dohrati hai. Is haalat mein, lagta hai ke Gold bas kuch waqt ki baat hai jab apni aglay unchi ko dohraayegi. Mere analysis ke mutabiq, meri pehli uttar ki target kareeban 2065 hai. Is liye, mein apna buy trade hold kar raha hoon, jise filhal nuksan mein dekh raha hoon. Mera irada hai ke mein apni trade ko hold karunga jab tak qeemat 2027 ke level ke ooper trade kar rahi hai.


                              Click image for larger version

Name:	image_138550.jpg
Views:	49
Size:	21.5 کلوبائٹ
ID:	12872733
                              Yeh strategy is par mabni hai ke gold ke chart mein mojood trends aur price patterns ko samajh kar ki gayi hai. Trading mein risk management ka bhi khayal rakhna zaroori hai, is liye mein apne trade ko closely monitor kar raha hoon aur market conditions ke mutabiq apne stop-loss levels ko adjust kar raha hoon. Is waqt, gold market mein volatility kaafi hosakti hai, is liye traders ko hamesha market ke updates par amal karna chahiye. Yeh sirf ek analysis hai aur actual market conditions ke mutabiq trading decisions lena zaroori hai. Aapka analysis yeh bhi kehta hai ke qeemat baar baar apni chotiyo ko dohrati hai, iska matlab hai ke Gold mein consistent upward movement hai. Aapko lagta hai ke abhi sirf kuch waqt ki baat hai jab Gold apni aglay unchi ko dohraayegi aur aapki pehli uttar ki target tak pohanchegi jo kareeban 2065 hai.
                                 
                              • <a href="https://www.instaforex.org/ru/?x=ruforum">InstaForex</a>
                              • #660 Collapse

                                The GOLD commodity index has emerged as a focal point for traders on the H4 timeframe, offering a captivating scenario ripe with significant movements and enticing trading prospects. Today, we embark on a thorough exploration of the technical landscape surrounding the GOLD commodity index, illuminating potential opportunities for traders to capitalize on. At the forefront of our analysis lies the examination of key indicators and chart patterns that provide insight into the current trajectory of the GOLD commodity index. Technical analysts often turn to tools such as moving averages, oscillators, and support/resistance levels to gauge market sentiment and identify potential entry and exit points.


                                One notable aspect of the GOLD commodity index's recent performance is its responsiveness to broader market dynamics, particularly factors influencing the precious metals sector. Economic indicators, geopolitical developments, and shifts in investor sentiment all play pivotal roles in shaping the price action of GOLD, making it essential for traders to stay attuned to these factors. In dissecting the price chart of the GOLD commodity index, we observe intriguing patterns and trends that warrant attention. From bullish engulfing patterns signaling potential upward momentum to bearish divergence patterns hinting at impending reversals, there exists a myriad of signals that traders can leverage to formulate their strategies.
                                Moreover, the presence of significant support and resistance levels adds another layer of complexity to the technical landscape. These levels, often derived from historical price data or Fibonacci retracements, serve as crucial reference points for traders seeking to identify potential areas of price reversal or consolidation.


                                In addition to traditional technical analysis tools, it is imperative for traders to incorporate fundamental analysis into their decision-making process. Factors such as inflationary pressures, central bank policies, and global economic trends can exert profound influence on the price of GOLD, warranting a comprehensive approach to market analysis. As traders navigate the complexities of the GOLD commodity index, risk management remains paramount. Establishing prudent risk-reward ratios, setting stop-loss orders, and exercising discipline are all essential elements of a robust trading strategy, helping to mitigate potential losses and maximize profitability in volatile market conditions.


                                Click image for larger version

Name:	Screenshot_9.png
Views:	48
Size:	17.4 کلوبائٹ
ID:	12872758
                                   

                                اب آن لائن

                                Working...
                                X