CL/Crude Oil
No announcement yet.
X
  • وقت
  • دکھائیں
Clear All
new posts
  • #316 Collapse

    Crude oil technical analysis:

    houry chart outlook:


    Hourly chart pay crude oil price ki current situation 75.70 pivot point line k ooper running kar rahi hai. Chart pay macd indicator levels k ooper overbought signal k liye crossed over honay k baad kuch bearish price correction ka signal show kar raha hai. agar current price upward movements ko continues rakhty hai to chart pay price ka target ooper 77.30 aur phir usk bad price mazeed 78.10 resistance zones ko test kar sakty hai.


    Agar current price h1 time frame pay reversed hoty hai, aur sath central point line k sell main breakout karty hai to chart pay price ki dwnward movements k chances ban saktay hain jiska target neechay 75.25 aur phir usk bad price mazeed 74.60 support levels ko test kar sakty hai. Mairay analysis k hisab say price ka trend central point line k buy breakout k sath sell main start ho chuka hai, is liye chances yahi hain k price resistance zones ko test kar sakty hai.


    4-hour chart outlook:


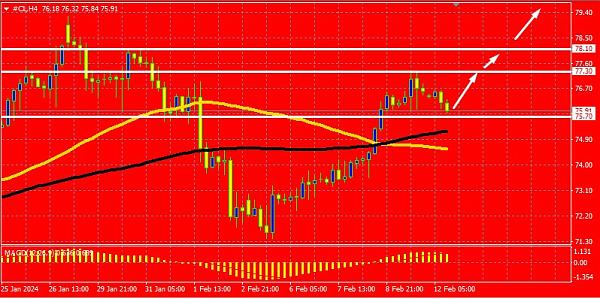
    4-hours chart pay crude oil price ki current situation 75.70 pivot point line k ooper running kar rahi hai. Chart pay macd indicator levels k ooper overbought signal k liye crossed over honay k baad kuch bearish price correction ka signal show kar raha hai. agar current price upward movements ko continues rakhty hai to chart pay price ka target ooper 77.30 aur phir usk bad price mazeed 78.10 resistance zones ko test kar sakty hai.


    Agar current price h4 time frame pay reversed hoty hai, aur sath central point line k sell main breakout karty hai to chart pay price ki dwnward movements k chances ban saktay hain jiska target neechay 75.25 aur phir usk bad price mazeed 74.60 support levels ko test kar sakty hai. Mairay analysis k hisab say price ka trend central point line k buy breakout k sath sell main start ho chuka hai, is liye chances yahi hain k price resistance zones ko test kar sakty hai.


    Click image for larger version

Name:	h4.jpg
Views:	89
Size:	168.1 کلوبائٹ
ID:	12828663 ​​​​​​​
       
    • <a href="https://www.instaforex.org/ru/?x=ruforum">InstaForex</a>
    • #317 Collapse

      OIL
      Assalam Alaikum! Aisa lagta hai keh tel aalmi satah par kami ya yahan tak keh abhi ek aham islah ka mansubah nahin bana raha hai. Qimat kharidari ke haq me bani hui hai, aur aaj aisi qayas araiyan ki ja rahi hain keh commodity me kami aa sakti hai, jiska hadaf 75.34 par support satah hai. Halankeh, us muqam se, hamein kharidari ki sargarmi dobara shuru hone ki tawaqqo hai, jis se maujudah bulandiyon paar kiya ja sakega aur 79.95 par namzad muzahmati satah ko hadaf banate hue muqami bulandiyon ko update karna jari rahega. Wahan se, ham andazah lagayenge keh aage kya mutawaqqe hai.

      Click image for larger version

Name:	E41.PNG
Views:	129
Size:	55.1 کلوبائٹ
ID:	12829505
      ​​​​​​​
         
      • #318 Collapse

        Technical price review of Crude oil:

        1-hour time frame chart:


        Hourly chart pay crude oil price ki current situation 77.10 pivot point line k ooper running kar rahi hai. Chart pay macd indicator levels k ooper overbought signal k liye crossed over honay k baad kuch bearish price correction ka signal show kar raha hai. agar current price upward movements ko continues rakhty hai to chart pay price ka target ooper 78.50 aur phir usk bad price mazeed 79.00 resistance zones ko test kar sakty hai.


        Agar current price h1 time frame pay reversed hoty hai, aur sath central point line k sell main breakout karty hai to chart pay price ki dwnward movements k chances ban saktay hain jiska target neechay 76.60 aur phir usk bad price mazeed 76.10 support levels ko test kar sakty hai. Mairay analysis k hisab say price ka trend central point line k buy breakout k sath sell main start ho chuka hai, is liye chances yahi hain k price resistance zones ko test kar sakty hai.

        4-hour time frame chart:
        H4 chart pay crude oil price ki current situation 77.10 pivot point line k ooper running kar rahi hai. Chart pay macd indicator levels k ooper overbought signal k liye crossed over honay k baad kuch bearish price correction ka signal show kar raha hai. agar current price upward movements ko continues rakhty hai to chart pay price ka target ooper 78.50 aur phir usk bad price mazeed 79.00 resistance zones ko test kar sakty hai.


        Agar current price h4 time frame pay reversed hoty hai, aur sath central point line k sell main breakout karty hai to chart pay price ki dwnward movements k chances ban saktay hain jiska target neechay 76.60 aur phir usk bad price mazeed 76.10 support levels ko test kar sakty hai. Mairay analysis k hisab say price ka trend central point line k buy breakout k sath sell main start ho chuka hai, is liye chances yahi hain k price resistance zones ko test kar sakty hai.


        Click image for larger version

Name:	h4.jpg
Views:	87
Size:	125.2 کلوبائٹ
ID:	12830210 ​​​​​​​
           
        • #319 Collapse

          Crude Oil ka Technical Analysis
          H-4 Timeframe Analysis

          Crude oil pichle trading week mein lagatar barh raha tha, jabki yeh 78.09 par support mil raha tha, phir se ubharta gaya. Is natije mein, keemat 84.06 ke area mein pohanch sakti hai, jo ke target area ki hudood ka kirdar ada karta hai. Yeh abhi tak tay nahi hua hai kyun ke prices maujooda waqt mein is area se kai dozen points ooper hain aur dorr hai. Isi doran, price chart super-trend green zone mein hai, jo ke buyers ki faalat ko tasdeeq karta hai.

          Takneekan ke nazariye se, humara bias musbat hai, jo ke daily rising price curve ko support karta hai, 14-day momentum indicator se clear positive signal aur simple moving averages ke zariye positive hai.

          Day trading 77.00 ke ooper bana hua hai, aur ek uptrend sab se matloob hai. Pehla target 78.55 hai. Agar breakout hua, toh oil prices ke upside potential ko badha dega, jisse raasta 79.30 tak khula rahega, aur agle maqamat 80.00 ko test karte rahega. Sirf 77.00 ke nichle hudood ka confirmed break mojooda bullish scenario mein deri paida karega. Is se oil prices mein temporary girawat hogi aur dobara 76.20 ko retest karne ka mauka milega.

          Click image for larger version

Name:	Screenshot_20240214-175613-01.png
Views:	68
Size:	84.7 کلوبائٹ
ID:	12830494

          D-1 Timeframe Analysis

          Maujooda mein, prices haftay ke high ke kafi ooper trade ho rahe hain. Isi doran, key support areas zor se daba hain lekin mohtaj hain, jabke prices recover ho rahe hain, jo ke upside potential ko barqarar rakhta hai. Buyers ko naye price zone mein settle hone aur main barrier 84.06 ke ooper movement ko confidently consolidate karne aur next support area ke andar retest aur rebound ke liye tayyar hone ki zarurat hai. Wave targets 86.85 aur 89.06 ke darmiyan honge.

          Maujooda haalat ka ulta ishara hoga agar 79.54 ke reversal level ke neeche price move ho. Niche diye gaye chart mein dekhein:


          Click image for larger version

Name:	Screenshot_20240214-175527-01.png
Views:	79
Size:	88.8 کلوبائٹ
ID:	12830493
             
          • #320 Collapse

            Kal, apni zyadatar related assets ke muqable Americi dollar ke kamzor hone ka faida uthate hue, oil (CL) ke kharidaron ne ooper ki taraf bahut hi muhajjab qadam uthaya, jiske natije me ham beghair kisi masle ke sab se pahle 77.05 ki muzahmati satah tak pahunchne me kamyan hue, aur ise tod diya. Is karwayi ke dauran hajam me musalsal izafa hota raha aur kafi aalsa satah par bana raha, jo bade kharidaron ki positions me mazid dakhlon ki nishandahi karta hai, aur yah haqiqat keh ham karobari din ke ikhtetam par 77.05 ki satah se ooper band hue, kharidari ki ek nayi lahar ka rasta kholta hai. Jis par aaj bulls mazid radde amal karne ki koshish karenge.
            Aam taur par, meri tarjih kharidari ki rahti hai. Halankeh, tel ke sath, mai pahle 77.05 par pahle toote hue support ki satah ke ilaqe me mamuli pulllback ka intezar kaunga, iske bad, uske bad isme rebound aur 78.78 ki sabqah bulandi ke ird-gird hadaf ki taraf namo ka dobara aaghaz hoga.

            Click image for larger version

Name:	E41.png
Views:	155
Size:	150.0 کلوبائٹ
ID:	12832407
            ​​​​​​​
               
            • #321 Collapse

              CRUDE OIL:

              1-HOUR TIME FRAME OUTLOOK:


              Hourly chart pay crude oil price ki current situation 78.40 pivot point line k neechay running kar rahi hai. Chart pay macd indicator levels k ooper overbought signal k liye crossed over honay k baad kuch bearish price correction ka signal show kar raha hai. agar current price upward movements ko continues rakhty hai to chart pay price ka target neechay 76.70 aur phir usk bad price mazeed 76.15 support zones ko test kar sakty hai.


              Agar current price h1 time frame pay bounced hoty hai, aur sath central point line k buy main breakout karty hai to chart pay price ki upward movements k chances ban saktay hain jiska target ooper 78.75 aur phir usk bad price mazeed 79.30 resistance levels ko test kar sakty hai. Mairay analysis k hisab say price ka trend central point line k buy breakout k sath sell main start ho chuka hai, is liye chances yahi hain k price support zones ko test kar sakty hai.


              4-HOURS TIME FRAME ANALYSIS:


              4-hours chart pay crude oil price ki current situation 78.40 pivot point line k neechay running kar rahi hai. Chart pay macd indicator levels k ooper overbought signal k liye crossed over honay k baad kuch bearish price correction ka signal show kar raha hai. agar current price upward movements ko continues rakhty hai to chart pay price ka target neechay 76.70 aur phir usk bad price mazeed 76.15 support zones ko test kar sakty hai.


              Agar current price h4 time frame pay bounced hoty hai, aur sath central point line k buy main breakout karty hai to chart pay price ki upward movements k chances ban saktay hain jiska target ooper 78.75 aur phir usk bad price mazeed 79.30 resistance levels ko test kar sakty hai. Mairay analysis k hisab say price ka trend central point line k buy breakout k sath sell main start ho chuka hai, is liye chances yahi hain k price support zones ko test kar sakty hai.


              Click image for larger version

Name:	H4.jpg
Views:	77
Size:	139.8 کلوبائٹ
ID:	12832647 ​​​​​​​
                 
              • #322 Collapse

                Crude oil ka technical analysis dekhtay hain, specifically hourly chart ke nazaray mein. Hourly chart par nazar daalnay se hamen current trading session mein oil ke price action aur trend ka acha andaza milta hai.

                Hourly chart par dekha jaye to, oil ka price ek muddat se sidewards movement ka shikar raha hai. Is mein kuch mukhtalif factors shamil hain jo price ke upar asar daal rahe hain, jaise ke global economic conditions, geopolitical tensions, aur supply-demand dynamics.

                Price action ko dekhtay hue, hum dekh sakte hain ke oil ka price range-bound hai, yaani ke specific price range mein fluctuate kar raha hai. Yeh indicate karta hai ke market mein kisi mukhtalif trend ka clear signal nahi hai. Is waqt, traders ko cautious rehna chahiye aur price ke movement ko closely monitor karna zaroori hai.

                Moving averages aur technical indicators ki madad se, hum dekh sakte hain ke market ki sentiment kya hai. Agar moving averages ke cross-overs ya phir other indicators mein kisi mukhtalif pattern ka pata chalta hai, toh yeh traders ko future price movement ke baray mein idea de sakta hai.

                Is waqt, crude oil market mein volatility ka level bhi dekhne layak hai. Is volatility ke daur mein, traders ko risk management par zyada tawajjo deni chahiye, taake wo apne positions ko protect kar sakein.

                Overall, hourly chart ke nazaray se, crude oil ka market range-bound hai aur volatility high hai. Traders ko cautious rehna chahiye aur market ke developments ko closely monitor karna zaroori hai taake wo sahi trading decisions le sakein.
                • #323 Collapse

                  TECHNICAL OUTLOOK OF CRUDE OIL PRICE:

                  1-HOUR TIME FRAME CHART:


                  Hourly chart pay crude oil price ki current situation 77.90 pivot point line k ooper running kar rahi hai. Chart pay macd indicator levels k ooper overbought signal k liye crossed over honay k baad kuch bearish price correction ka signal show kar raha hai. agar current price upward movements ko continues rakhty hai to chart pay price ka target neechay 80.00 aur phir usk bad price mazeed 80.75 resistance zones ko test kar sakty hai. Agar current price h1 time frame pay reversed hoty hai, aur sath central point line k sell main breakout karty hai to chart pay price ki dwnward movements k chances ban saktay hain jiska target neechay 77.25 aur phir usk bad price mazeed 76.70 support levels ko test kar sakty hai. Mairay analysis k hisab say price ka trend central point line k buy breakout k sath buy main start ho chuka hai, is liye chances yahi hain k price resistance zones ko test kar sakty hai.


                  Click image for larger version

Name:	H1.jpg
Views:	68
Size:	75.3 کلوبائٹ
ID:	12833645


                  4-HOURS TIME FRAME CHART:


                  4-hours chart pay crude oil price ki current situation 77.90 pivot point line k ooper running kar rahi hai. Chart pay macd indicator levels k ooper overbought signal k liye crossed over honay k baad kuch bearish price correction ka signal show kar raha hai. agar current price upward movements ko continues rakhty hai to chart pay price ka target neechay 80.00 aur phir usk bad price mazeed 80.75 resistance zones ko test kar sakty hai.


                  Agar current price h4 time frame pay reversed hoty hai, aur sath central point line k sell main breakout karty hai to chart pay price ki dwnward movements k chances ban saktay hain jiska target neechay 77.25 aur phir usk bad price mazeed 76.70 support levels ko test kar sakty hai. Mairay analysis k hisab say price ka trend central point line k buy breakout k sath buy main start ho chuka hai, is liye chances yahi hain k price resistance zones ko test kar sakty hai.

                  ​​​​​​​
                     
                  • #324 Collapse

                    INTRODUCE of CRUDE OIL AT TECHNICAL ANALYSIS:


                    H1 Time Frame:


                    Aoa Ummid karta hon Ap Sab khariat Say Hon gy AJ H4 chart pay CL(CRUDE OIL) charge ki present day state of affairs 72.Ninety pivot factor line good enough ooper on foot kar rahi hai. Chart pay macd indicator levels k ooper (OVERBOUGHTS) sign good enough liye crossed over honay ok baad kuch bearish fee correction ka sign display kar raha hai. Agar modern price upward actions ko keeps rakhty hai to chart pay charge ka goal ooper 80 3.60 aur phir usk awful fee mazeed 87.10 resistance zones ko check kar sakty hai.Cl(Crued oil)agar Modern-day charge h4 time frame pay reversed hoty hai, aur sath imperatives factor line good enough promote important breakout karty hai to chart pay charge ki dwnward movements adequate opportunities ban saktay hain jiska goal ooper 70.50 aur phir usk awfully fee mazeed sixty eight.50 assist stages ko take a look at kar Sakty hai. Mairay evaluation k hisab say rate ka fashion critical aspect line okay purchased breakout k sath purchase main start ho chuka hai, is liye chances yahi hain k rate resistance zones ko test kar sakty hai Tu CL(Crued oil)69.50 H1 chart pay crude oil price ki Trading Stradgy scenario 77.60 pivot factor line okay neechay strolling kar rahi hai. Hourly chart pay crude oil rate ki present day scenario 77.10 pivot point line okay ooper running kar rahi hai. Chart pay macd indicator stages k ooper overbought signal k liye crossed over honay ok baad kuch bearish price correction ka sign show kar raha hai. Agar modern price upward actions ko continues rakhty hai to chart pay price ka goal ooper 78.50 aur phir usk awful rate mazeed seventy nine.00 resistance zones ko check kar sakty hai.


                    INTRODUCE of CRUDE OIL AT TECHNICAL ANALYSIS OUTLOOK:


                    H4 Time Frame:


                    Friends yeah (CRUDE OIL) pehlay increase ho Gai aur phir guzashta haftay buland satah par band hai. Ninety seven. 50 ki inertial exploration excessive stress mein thi, aur usay thukra diya gaya. Daily chart pay crude oil rate ki Modern-day state of affairs seventy .Ninety pivot point line good enough ooper on foot kar rahi hai. Chart pay macd indicator stages ok ooper OVERBOUGHTS sign okay liye crossed over honay ok baad kuch bearish rate correction ka signal display kar raha hai. Agar present day-day fee upward movements ko maintains rakhty hai to chart pay rate ka intention ooper 80 three.60 aur Phir Us k terrible rate mazed 87.10 resistance zones ko test kar sakty hai. Jab kay hafta waar line oopri Shadow line ke sath wast yan ok line par band hogayi. Hafta waar line ab bhi cal again ko dekh rahi hai, aur market ke out lick ke manfi pehlu ka taayun karne ke liye mukhtasir muddat 86. Zero ke qareeb kam factor ke liye muqaabla kar Rahi hai.Cl(Crued oil) ka target ooper seventy 3.Seventy five aur usk terrible fee mazeed seventy three.10 help ranges ko check kar sakty hai. Mairay evaluation ok hisab say fee ka trend valuable factor line k purchase breakout k sath buy essential start ho chuka hai, isliye chances yahi Again ok rate resistance zones ko take a look at kar sakty hai.H4 chart pay Crude oil charge chart pay contemporary state of affairs seventh four.30 pivot factor line adequate ooper talking karti hai. Chart pay macd indicator levels kooper overbought signal kliye crossed over honay ok baad kuch bearish fee correction ka sign show kar raha hai. If the contemporary price upwards motion keeps, the chart's pay charge target is 75.30, and the usk horrifically rate resistance area is seventh five.15 agar contemporary rate h4 time frame pay bounced hoty hai, aur sath crucially factor line buyer's foremost breakout karty hai to chart pay fee ki upward Movements k possibilities ban saktay hain jiska target ooper seventy eight.10 aur phir usk horrific fee mazeed seventy eight.50 resistance degrees ko test kar sakty hai. Mairay evaluation ok hisab say price ka fashion primary factor line okay buy breakout ok sath buy fundamental start ho chuka hai, is liye 7100 take profit ho gy.

                     
                    Last edited by ; 19-02-2024, 09:53 AM.
                    • #325 Collapse

                      Crude oul price review:


                      1-hour time chart outlook:


                      Hourly chart pay crude oil price ki current condition 75.50 pivot point line k ooper running karti hai. Chart pay macd indicator levels kooper overbought signal kliye crossed over honay k baad kuch bearish price correction ka signal show kar raha hai. If the present price upward movement continues, the chart pay price goal is 77.30, while the usk bad price resistance zone is 78.10.


                      Agar current price h1 time frame pay reversed hoty hai, aur sath central point line k sell main breakout karty hai, to chart pay price ki downward movements k chances ban saktay hain, jiska target neechay 74.50 aur usk bad price mazeed 73.65 support levels ko test kar sakty hai. Mairay analysis k hisab say price ka trend central point line k buy breakout k sath sell main start ho chuka hai, isliye possibilities yahi hain k price resistance zones ko test kar sakty hai.

                      Crude oil has made significant gains, reaching 78.09 per barrel. Yeh poori tarah se signal zone se bahar nikal gaya aur reversal level ko tor diye. Isay tootna mumkin nahi tha, aur keemat ne support zone ke andar tezi se bounce ki. The price chart is super-trending in the red zone, which indicates that sellers have power.


                      Technically, simple moving average positive momentum dene ki koshish kar raha hai, and keemat ko neeche se wapas lekar aane ki taraf hai. Isi doran, oil prices ko relative strength index se positive signals milega, jo ke 50 midline ke ooper barqarar hai.

                      Yahan se, trade 73.50 support, jismein ek intraday uptrend 74.50 ke liye mumkin hai. The daily bar is on an upward trend, with 74.85 and 75.40 respectively. If stability 73.50 ke neeche laut ti hai, then propose scenario ko rok dega aur oil prices ko negative pressure mein daal dega, pehla target 72.85 ke saath.

                      4At the moment, prices are on the rise, and they will continue to do so. Isi doran, ek legend support area ne significant pressure mein aya. Yes, virtually toot gaya, keemat reversal level ke neeche gir gayi. Is region ke hudood mein dobara lautne ne oonchi raftar ki moqif banaye diya. Unke irade ko tasdeeq karne ke liye, buyers ko level 79.54 ke ooper confidence taur par chalne, aur market ke upward movement ke hisse ke tor par is region ke boundaries ko test aur rebound karna hogi. Aane wale maqsood ilaqay 84.06 or 86.85.

                      Current maqam ki ulta ki taraf manzoori ka signal 78.09 ke reversal level ke neeche jaane mein dikhai de. Neeche diye gaya chart mein dekhein:


                      4-hour chart pay crude oil price ki current condition 75.50 pivot point line k ooper running karti hai. Chart pay macd indicator levels kooper overbought signal kliye crossed over honay k baad kuch bearish price correction ka signal show kar raha hai. If the present price upward movement continues, the chart pay price goal is 77.30, while the usk bad price resistance zone is 78.10.


                      Agar current price h4 time frame pay reversed hoty hai, aur sath central point line k sell main breakout karty hai, to chart pay price ki downward movements k chances ban saktay hain, jiska target neechay 74.50 aur usk bad price mazeed 73.65 support levels ko test kar sakty hai. Mairay analysis k hisab say price ka trend central point line k buy breakout k sath sell main start ho chuka hai, isliye possibilities yahi hain k price resistance zones ko test kar sakty hai.


                      4-hour time chart outlook:


                      Hourly chart pay crude oil price ki current condition 75.70 pivot point line k ooper running karti hai. Chart pay macd indicator levels kooper overbought signal kliye crossed over honay k baad kuch bearish price correction ka signal show kar raha hai. If the present price upward movement continues, the chart pay price goal is 77.30, while the usk bad price resistance zone is 78.10.


                      Agar current price h1 time frame pay reversed hoty hai, aur sath central point line k sell main breakout karty hai, to chart pay price ki downward movements k chances ban saktay hain, jiska target neechay 75.25 aur phir usk bad price mazeed 74.60 support levels ko test kar sakty hai. Mairay analysis k hisab say price ka trend central point line k buy breakout k sath sell main start ho chuka hai, isliye possibilities yahi hain k price resistance zones ko test kar sakty hai.
                      According to the 4-hour chart, the current crude oil price is 75.70, and the pivot point line is running. Chart pay macd indicator levels kooper overbought signal kliye crossed over honay k baad kuch bearish price correction ka signal show kar raha hai. If the present price upward movement continues, the chart pay price goal is 77.30, while the usk bad price resistance zone is 78.10.


                      Agar current price h4 time frame pay reversed hoty hai, aur sath central point line k sell main breakout karty hai, to chart pay price ki downward movements k chances ban saktay hain, jiska target neechay 75.25 aur usk bad price mazeed 74.60 support levels ko test kar sakty hai. Mairay analysis k hisab say price ka trend central point line k buy breakout k sath sell main start ho chuka hai, isliye possibilities yahi hain k price resistance zones ko test kar sakty hai.

                      Hourly chart pay crude oil price ki current condition 77.10 pivot point line k ooper running karti hai. Chart pay macd indicator levels kooper overbought signal kliye crossed over honay k baad kuch bearish price correction ka signal show kar raha hai. If the present price upward movement continues, the chart pay price goal is 78.50, while the usk bad price resistance zone is 79.00.


                      Agar current price h1 time frame pay reversed hoty hai, aur sath central point line k sell main breakout karty hai, to chart pay price ki downward movements k chances ban saktay hain, jiska target neechay 76.60 aur usk bad price mazeed 76.10 support levels ko test kar sakty hai. Mairay analysis k hisab say price ka trend central point line k buy breakout k sath sell main start ho chuka hai, isliye possibilities yahi hain k price resistance zones ko test kar sakty hai.


                      • #326 Collapse

                        Pichle 3 karobari dino me, kharidar Oil (CL) par apni sargarmi dikha rahe hain, aur izafe ke natije me, ham pahle 77.05 ki mutawaqqe muzahmati satah tak pahunchne me kamyab hue, aur fir hamne iske breakout ki tasdiq ki. Iske alawa, muqarrarah satah ke izafe aur breakout ke dauran hajam me bhi musalsal izafa hota raha aur kami aala satah par raha, jo keh bade kharidaron ki taraf se positions ke accumulation ki nishandahi karta hai. Iske alawa, yah haqiqat keh qimat 77.05 ki satah se ooper band hone se aakhir kar mazid taraqqi ke bahut acche imkanat khulte hain, khas taur par is se wabastah zyadatar assets ke muqable me dollar ki itni acchi positions ke pes nazar me.
                        Lehaza, meri tarjih kharidari par bani hui hai. Lehaza, aaj, mai tawaqqo karta hun keh Oil (CL) guzishtah hafte se 78.76 ki qarib tarin muzahmati satah par hadaf ki taraf apni namo jari rakhega, iske bad breakout aur is se ooper istehkam hoga.

                        Click image for larger version

Name:	E41.png
Views:	143
Size:	168.3 کلوبائٹ
ID:	12836894
                        ​​​​​​​
                           
                        • #327 Collapse

                          Crude oul price review:

                          1-hour time chart outlook:
                          '''


                          Currently, prices are on the rise and will continue to do so. Isi doran, ek legend support area ne significant pressure mein aya. Yes, virtually toot gaya, keemat reversal level ke neeche gir gayi. Is region ke hudood mein dobara lautne ne oonchi raftar ki moqif banaye diya. Unke irade ko tasdeeq karne ke liye, buyers ko level 79.54 ke ooper confidence taur par chalne, aur market ke upward movement ke hisse ke tor par is region ke boundaries ko test aur rebound karna hogi. Aane wale maqsood ilaqay 84.06 or 86.85.

                          Current maqam ki ulta ki taraf manzoori ka signal 78.09 ke reversal level ke neeche jaane mein dikhai de. Neeche diye gaya chart mein dekhein:Crude oil has made significant gains, reaching 78.09 per barrel. Yeh poori tarah se signal zone se bahar nikal gaya aur reversal level ko tor diye. Isay tootna mumkin nahi tha, aur keemat ne support zone ke andar tezi se bounce ki. The price chart is super-trending in the red zone, which indicates that sellers have power.


                          Technically, simple moving average positive momentum dene ki koshish kar raha hai, and keemat ko neeche se wapas lekar aane ki taraf hai. Isi doran, oil prices ko relative strength index se positive signals milega, jo ke 50 midline ke ooper barqarar hai.

                          Yahan se, trade 73.50 support, jismein ek intraday uptrend 74.50 ke liye mumkin hai. The daily bar is on an upward trend, with 74.85 and 75.40 respectively. If stability 73.50 ke neeche laut ti hai, then propose scenario ko rok dega aur oil prices ko negative pressure mein daal dega, pehla target 72.85 ke saath.
                          Hourly chart pay crude oil price ki current condition 75.50 pivot point line k ooper running karti hai. Chart pay macd indicator levels kooper overbought signal kliye crossed over honay k baad kuch bearish price correction ka signal show kar raha hai. If the present price upward movement continues, the chart pay price goal is 77.30, while the usk bad price resistance zone is 78.10.


                          Agar current price h1 time frame pay reversed hoty hai, aur sath central point line k sell main breakout karty hai, to chart pay price ki downward movements k chances ban saktay hain, jiska target neechay 74.50 aur usk bad price mazeed 73.65 support levels ko test kar sakty hai. Mairay analysis k hisab say price ka trend central point line k buy breakout k sath sell main start ho chuka hai, isliye possibilities yahi hain k price resistance zones ko test kar sakty hai.


                          4-hour chart pay crude oil price ki current condition 75.50 pivot point line k ooper running karti hai. Chart pay macd indicator levels kooper overbought signal kliye crossed over honay k baad kuch bearish price correction ka signal show kar raha hai. If the present price upward movement continues, the chart pay price goal is 77.30, while the usk bad price resistance zone is 78.10.


                          Agar current price h4 time frame pay reversed hoty hai, aur sath central point line k sell main breakout karty hai, to chart pay price ki downward movements k chances ban saktay hain, jiska target neechay 74.50 aur usk bad price mazeed 73.65 support levels ko test kar sakty hai. Mairay analysis k hisab say price ka trend central point line k buy breakout k sath sell main start ho chuka hai, isliye possibilities yahi hain k price resistance zones ko test kar sakty hai.


                          4-hour time chart outlook:'''


                          Crude oil pehlay barh gaya, and phir guzashta haftay buland satay par band hai. Ninety-seven. 50 ki inertial exploration high stress mein thi, aur usay thukra diya. Daily chart pay crude oil rate ki current condition of events seventy.Ninety pivot point lines are sufficient for ooper on foot. Chart pay macd indicator stages Okay, overbought indication okay liye crossed over honay ok baad kuch bearish rate adjustment ka signal show kar raha hai. Agar current day-to-day fee upward movements ko maintain rakhty hai, chart pay rate ka purpose ooper 80.60 aur phir usk awful rate mazeed 87.10 resistance zones ko test kar sakty hai. Jab kay hafta waar line oopri shadow line ke sath wast, then ok line par band hogayi. The market is at a mukhtasir muddat 86, with zero qareeb as a consideration to consider.Cl (Crued oil) ka target ooper seventy 3.75 aur usk horrible fee mazeed seventy three.10 help ranges ko check kar sakty hai. Mairay evaluation ok hisab say fee ka trend valuable element line k purchase breakout k sath buy vital start ho chuka hai, isliye possibilities yahi hain ok rate resistance zones ko check karsakty hai.H4 chart pay Crude oil price chart pay current situation seventy four.30 pivot factor line appropriate ooper walking karti hai. Chart pay macd indicator levels kooper overbought signal kliye crossed over honay, alright baad kuch bearish fee correction ka sign kar raha hai. If the current price uptrend continues, the chart's pay charge objective is 75.30, and the usk horrific rate resistance region is 75.15. If the current rate h4 time frame pay bounced hoty hai, aur sath crucial factor line okay buy foremost breakout karty hai to chart pay fee ki upward movements k possibilities ban saktay hain jiska target ooper 78.10 aur phir usk horrific fee mazeed 78.50 resistance levels ko test kar sakty hai. Mairay evaluation alright hisab say price ka fashion primary factor line okay buy breakout ok sath buy fundamental start ho chuka hai, isliye possibilities yahi hain k price guide zones ko check kar sakty hai.

                          Aoa, optimistically, Ap Sab Khariat Say Hon Gy AJ. H4 chart pay CL (Crude oil) charge ki present day state of affairs 72.Ninety pivot factor line is good enough to walk on foot. Chart pay macd indicator levels kooper overbought indication good enough liye crossed over honay ok, bad kuch bearish fee correction ka sign display kar raha hai. If modern price higher activities continue, then chart pay charge ka aim ooper 80 3.60 aur usk horrible fee mazeed 87.10 resistance zones ko check kar sakty hai.Cl(Crued oil)agar modern-day charge h4 time frame pay reversed hoty hai, aur sath imperative factor line good enough promote important breakout karty hai to chart pay charge ki dwnward movements adequate opportunities ban saktay hain jiska goal ooper 70.50 aur phir usk awful fee mazeed sixty eight.50 assist stages ko check kar sakty hai. Mairay evaluation k hisab say rate ka fashion critical aspect line okay purchase breakout k sath purchase main start ho chuka hai; is liye possibilities yahi hain k rate resistance zones ko test kar sakty hai. Tu CL (crude oil) 69.50 H1 chart pay crude oil price ki cutting-edge scenario 77.60 pivot factor line acceptable neechay kar rahi hai. Chart pay macd indicator tiers ok ooper overbought signal k liye crossed over honay k baad kuch bearish rate correction ka signal show karta hai. Agar contemporary charge rising movements ko continue rakhty hai, chart pay rate ka target ooper 76.05 aur usk terrible price mazeed 75.60 zones ko check kar sakty hai.
                          On the 4-hour chart, the current crude oil price is 73.20, and the pivot point line is running. Chart pay macd indicator levels kooper overbought signal kliye crossed over honay k baad kuch bearish price correction ka signal show kar raha hai. If the current price upward trend continues, the chart pay price will reach 74.40, and the usk bad price will challenge the resistance zone at 75.05.


                          Agar current price h4 time frame pay reversed hoty hai, aur sath central point line k sell main breakout karty hai, to chart pay price ki downward movements k chances ban saktay hain, jiska target neechay 72.85 aur phir usk bad price mazeed 72.40 support levels ko test kar sakty hai. Mairay analysis k hisab say price ka trend central point line k buy breakout k sath sell main start ho chuka hai, isliye possibilities yahi hain k price resistance zones ko test kar sakty hai.


                          • #328 Collapse

                            WTI tail keemat ne ek bullish momentum maintain kiya, jo k aik barrel ke qareeb $79.90 ke dairey mein tha, mangal ki subah Asian session mein. Yemen ke Houthi rebels ke missiles ko ek Iranian port ke liye rawana karne ki riwayaat ne tawajjuat ko aur bhi barhaya, walaqah koi minor nuqsan ke bawajood kisi bhi jan nahi gayi. Aise siyasi waqiat aksar tail ke market mein instability ka sabab bante hain, supply chains ko disturb karte hain aur supply rukawaton ke baray mein fikron ko barhate hain.
                            WTI Crude Oil ke Fundamental:

                            Dubai mein Arab Fiscal Forum ne Middle East ke maqazi manzar e aam par guftagu ka ek manzar faraham kiya. International Monetary Fund (IMF) ke Managing Director Kristalina Georgieva ne Middle Eastern economies ki underperformance par zor diya, jo ke growth projections ke mawafiq nahi thi. Tail ki production mein kami aur maqazi tanazur, jese ke Israel-Gaza dispute, ne is underperformance mein apna hissa daala.

                            IMF ke taza regional financial report ne Middle East aur North Africa ke liye saal ke liye GDP growth forecasts ko 2.9% par revise kiya, peechley projections se kam. Ye tabdeeli maqazi tensions aur uncertainties ka asar darust karti hai. Jab ke siyasi risks evolve hote hain, market ke hissedarun ko unke asraat par nazreen jamaye rakhne chahiye, jo economic growth aur tail ke daam par asar andaz hotay hain.

                            Daily Time Frame Technical Analysis:

                            Pichley chhe dinon mein, WTI tail ke daam mein ek numaya raily ka samna hua, jo ek musalsal jeetne wali series ko darust karti hai. Magar, technical indicators ke mutabiq, daam $79.00 ke mark tak pohnchne par ek mukhtalif mawad ka ishara hai. Ye level ek descending trend line ke sath milti hai, 100-day aur 200-day Simple Moving Average ke sath, jo ke mumkinah resistance ki taraf ishara karte hain. Aur bullish momentum daam ko $80 ki taraf agay barha sakta hai, jabke $78 aur $84 ko agle upside targets ke tor par pehchana gaya hai.

                            Agar Average True Range (ATR) jaldi overbought territory mein nahi daakhil hota, toh aik mustaqil raily $88.50 tak wujood mein aasakti hai. Ye target November 2022 mein dekhe gaye urooj ko darust karta hai aur mustaqbil ke daamoun ko shakal dene ke liye mojooda market dynamics ki ahmiyat ko wazeh karta hai.


                            Click image for larger version

Name:	image_4973877.png
Views:	54
Size:	19.8 کلوبائٹ
ID:	12837351
                            • #329 Collapse

                              Crude oil price overview:


                              Hourly chart pay crude oil price ki current situation 77.35 pivot point line k ooper running kar rahi hai. Chart pay macd indicator levels k ooper overbought signal k liye crossed over honay k baad kuch bearish price correction ka signal show kar raha hai. agar current price upward movements ko continues rakhty hai to chart pay price ka target neechay 78.55 aur phir usk bad price mazeed 79.10 resistance zones ko test kar sakty hai.

                              Agar current price h1 time frame pay reversed hoty hai, aur sath central point line k sell main breakout karty hai to chart pay price ki dwnward movements k chances ban saktay hain jiska target neechay 76.85 aur phir usk bad price mazeed 76.30 support levels ko test kar sakty hai. Mairay analysis k hisab say price ka trend central point line k buy breakout k sath buy main start ho chuka hai, is liye chances yahi hain k price resistance zones ko test kar sakty hai.


                              4-hours time frame chart:


                              4-hours chart pay crude oil price ki current situation 77.35 pivot point line k ooper running kar rahi hai. Chart pay macd indicator levels k ooper overbought signal k liye crossed over honay k baad kuch bearish price correction ka signal show kar raha hai. agar current price upward movements ko continues rakhty hai to chart pay price ka target neechay 78.55 aur phir usk bad price mazeed 79.10 resistance zones ko test kar sakty hai.


                              Agar current price h4 time frame pay reversed hoty hai, aur sath central point line k sell main breakout karty hai to chart pay price ki dwnward movements k chances ban saktay hain jiska target neechay 76.85 aur phir usk bad price mazeed 76.30 support levels ko test kar sakty hai. Mairay analysis k hisab say price ka trend central point line k buy breakout k sath buy main start ho chuka hai, is liye chances yahi hain k price resistance zones ko test kar sakty hai.


                              Click image for larger version

Name:	h1.jpg
Views:	64
Size:	94.1 کلوبائٹ
ID:	12838407
                                 
                              • <a href="https://www.instaforex.org/ru/?x=ruforum">InstaForex</a>
                              • #330 Collapse


                                Crude Oil ka Technical Analysis


                                1. Introduction: Crude Oil ka technical analysis karna traders ke liye important hai taake woh market trends ko samajh sakein aur trading decisions sahi tarah se le sakein. Yahan kuch key points hain jo crude oil ke technical analysis mein madad karte hain.

                                2. Price Charts: Crude Oil ka technical analysis karne ka pehla kadam hota hai price charts dekhna. Candlestick charts ya line charts ka use hota hai jisse aap price movements ko track kar sakein.

                                3. Support aur Resistance Levels: Support aur resistance levels ko identify karna bhi crucial hai. Ye levels traders ko ye batate hain ke kis price level par market mein strong buying ya selling ka potential hai.

                                4. Trend Analysis: Trend analysis se ye pata lagta hai ke market uptrend mein hai, downtrend mein hai ya sideways move kar raha hai. Isse aapko trading direction ka idea milta hai.
                                • Uptrend: Agar crude oil prices higher highs aur higher lows banate hain, toh ye uptrend indicate karta hai.
                                • Downtrend: Agar prices lower highs aur lower lows banate hain, toh ye downtrend indicate karta hai.
                                • Sideways Trend: Prices agar kisi specific direction mein nahi ja rahe aur range-bound hain, toh ye sideways trend hota hai.

                                5. Technical Indicators: Kuch important technical indicators bhi use kiye ja sakte hain jaise ki:
                                • Moving Averages: Moving averages trend ko smooth karne mein madad karte hain aur crossover points se trend reversals ko identify karne mein help karte hain.
                                • Relative Strength Index (RSI): RSI overbought aur oversold conditions ko indicate karta hai, jo traders ko trend reversal ke possible points par alert karta hai.
                                • MACD (Moving Average Convergence Divergence): MACD trend strength aur direction ko measure karta hai.

                                6. Economic Indicators: Crude oil ke technical analysis mein economic indicators ka bhi dhyan rakhna important hai. Inventory reports, geopolitical events, aur global economic factors ka impact crude oil prices par hota hai.

                                7. Risk Management: Har trading strategy ke saath ek solid risk management plan bhi hona chahiye. Stop loss levels ko set karna aur position sizes ko control karna zaroori hai.

                                8. News Analysis: Crude oil prices par news ka bhi impact hota hai. Market mein kisi bhi significant news event se pehle aur uske baad ka analysis karna important hai.

                                9. Conclusion: Crude Oil ka technical analysis karne mein sabse zaroori baat hai ke aap market conditions ko acche se samajhein aur apne trading strategies ko constantly update karte rahein. Regularly market ko monitor karna aur news events ka dhyan rakhna bhi crucial hai.


                                اب آن لائن

                                Working...
                                X