Eur/usd

No announcement yet.
`
X
  • وقت
  • دکھائیں
Clear All
new posts
  • #841 Collapse

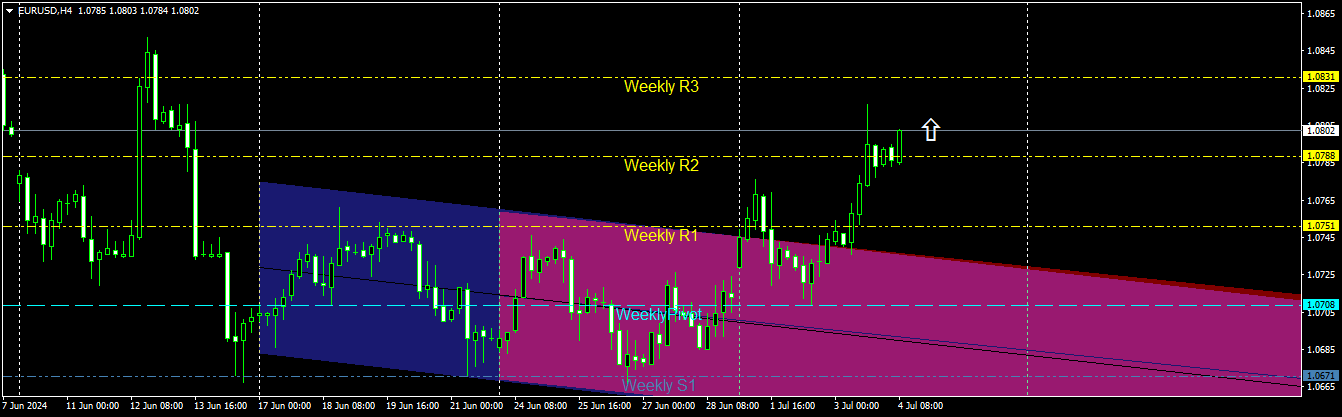
    EUR/USD currency pair ka analysis karte hue, humein nazar ata hai ke yeh pair downward trend mein hai. Chart mein dikhaya gaya hai ke price lower highs aur lower lows banati ja rahi hai, jo ke bearish trend ko confirm kar raha hai. Yeh trend line se support lete hue niche ki taraf move kar raha hai.

    Is chart mein MACD indicator bhi bearish divergence dikha raha hai. MACD histogram negative territory mein hai, jo ke selling pressure ko highlight karta hai. Yeh signal is baat ka indication hai ke downward trend continue rehne ke chances hain.

    Recent price action ko dekha jaye toh, price ne ek attempt kiya tha rebound karne ka, lekin phir se trend line se neeche gir gaya. Yeh movement batata hai ke market mein selling interest ab bhi bohot strong hai aur buyers momentum ko sustain nahi kar pa rahe.

    Agar price trend line ko break kar ke neeche close hoti hai, toh yeh aur bhi bearish signal hoga. Yeh situation sellers ko encourage karegi ke woh market mein aur entries karein, jisse price aur neeche ja sakti hai. Is surat mein next support level 1.0650 ke aas paas ho sakta hai.

    Dusri taraf, agar price trend line ke upar close hoti hai, toh yeh ek bullish reversal ka signal ho sakta hai. Lekin yeh scenario tabhi significant hoga jab price MACD ke positive territory mein enter ho aur moving averages cross ho kar bullish signal den.

    Is waqt market signals mostly bearish hain aur trading strategy banate waqt inhi signals ko madde nazar rakhna chahiye. Agar trend line break hoti hai toh short positions lena zyada suitable rahega. Agar price trend line ke upar move kar ke sustain karti hai, toh ek cautious approach rakhte hue buying opportunities ko dekhna chahiye.

    Upcoming economic data releases aur central bank policies bhi significant impact dal sakti hain EUR/USD pair par. Unhe closely monitor karna aur unke mutabiq trading strategies ko adjust karna zaroori hai. Overall, current market sentiment bearish hai aur yeh downtrend tab tak continue reh sakta hai jab tak significant bullish signals

    Click image for larger version

Name:	image_204257.png
Views:	48
Size:	71.7 کلوبائٹ
ID:	13026117
       
    • <a href="https://www.instaforex.org/ru/?x=ruforum">InstaForex</a>
    • #842 Collapse

      EUR-USD PAIR REVIEW
      American session mein jab keemat ne resistance area 1.0769 ko penetrate karne ki koshish ki, to achanak dabao mehsoos hua. Yeh buyers ke liye ek nakami thi keemat ko EMA 633 H1 ko paar karne ke baad bhi uchaalne mein kamiyaab na ho saki. Ab bearish candle ne EMA ko penetrate kar liya hai aur keemat ko aaj ke market opening area ki taraf slide karte hue dekha ja raha hai. Agar dabao mustaqil rahe aur EMA 200 jo daily open aur iske qareebi support 1.0709 ke darmiyan hai, us par breakout ho jaye, to qeemat ka andaza hai ke wo dobara downtrend mein dakhil ho jayegi aur mazeed kamzori bhi ho sakti hai.

      Mere technical analysis ke mutabiq, EURUSD currency pair ka ajka movement ab bhi 1.07820 tak barhne ki taraf tend karta hai. Iska sabab yeh hai ke H1 time frame mein EURUSD currency pair ka movement bullish engulfing candle ban gaya hai jo ke BUY EURUSD ke liye ek bohat hi mazboot signal hai 1.07820 tak aj. Lekin hamein aj EURUSD mein downward correction ke hone ka bhi khayal rakhna chahiye kyunki RSI 14 indicator par nazar daalne par pata chalta hai ke EURUSD ki keemat 1.07700 par already overbought hai ya RSI 14 indicator ke volume 70 ke upper limit ko chhu chuki hai, is liye bohat zyada mumkin hai ke aj dopahar mein EURUSD kafi gehra taur par 10-40 pips tak neeche correction ho sakta hai. SELL EURUSD signal SNR aur Fibonacci methods ke istemal se bhi support kiya jata hai kyunki jab EURUSD keemat ne 1.07700 ko enter kiya, to yeh SBR area yaani Support Become Resistance mein thi, is liye bohat zyada mumkin hai ke aj EURUSD wapas 1.07400 tak gir jaye. Mere technical analysis ke natayej ke mutabiq EURUSD currency pair ke ajke movement ke liye, maine faisla kiya hai ke SELL EURUSD karon ga 1.07400 par.

         
      • #843 Collapse

        EUR-USD PAIR REVIEW
        Ameriki session mein jab qeemat ne 1.0769 ke resistance area ko penetrate karne ki koshish ki toh ek achanak dabaav mehsoos hua. Yeh kharidaroun ke liye ek nakami thi kyunki qeemat EMA 633 H1 ko guzarne ke baad bhi oonchi le jaane mein kamiyab nahin ho saki. Ab bearish candle ne EMA ko penetrate kar liya hai aur qeemat ko aaj ke market opening area ki taraf slide karte hue dekha ja raha hai. Agar dabaav mustaqil rahay aur EMA 200 par breakout ho jaye, jo daily open aur uske nazdeek tareen support 1.0709 ke darmiyan hai, to qeemat ke dobara downtrend phase mein dakhil hone ka andesha hai aur mazeed kamzori ho sakti hai.

        Meri technical analysis ke mutabiq, aaj EURUSD currency pair ki movement abhi bhi 1.07820 ke qeemat tak barhne ki taraf mudabbir hai. Iska sabab H1 time frame mein EURUSD currency pair ki movement ne bullish engulfing candle banaya hai jo BUY EURUSD ke liye bohat taqatwar signal hai aaj 1.07820 ke qeemat tak. Lekin humein aaj EURUSD mein nichli correction hone ka bhi khayal rakhna chahiye kyunki RSI 14 indicator ki observations ke mutabiq, EURUSD ki qeemat 1.07700 par overbought hai ya RSI 14 indicator ke upper limit 70 ko chhu chuki hai, isliye bohat zyada mumkin hai ke aaj ke baad dopahar mein EURUSD ko 10-40 pips ke darmiyan gehri nichli correction ka samna karna pare. SELL EURUSD signal SNR aur Fibonacci methods ke istemal se bhi supported hai kyunki jab EURUSD ki qeemat 1.07700 mein gayi thi, toh yeh SBR area yaani Support Become Resistance mein thi, isliye bohat zyada mumkin hai ke aaj EURUSD 1.07400 ke qeemat par wapas gir jaye.

        EURUSD currency pair ki aaj ki movement ke nateeje ke mutabiq, meri technical analysis ke hisab se, maine faisla kiya hai ke aaj EURUSD ko 1.07400 ke qeemat par SELL karna chahiye.
           
        • #844 Collapse

          H4 timeframe chart analysis ke mutabiq, bears support level 1.0745 ko break karne ki koshish kar rahe hain. Bears move bana rahe hain, lekin ab tak koi significant outcome hasil nahi hua. Dollar ka current situation unclear hai; yeh conversions ki wajah se driven hai na ke euros ki substantial buying ki wajah se. Franc aur yen jaise currencies zyada attention nahi attract kar rahi hain, isliye dollar ko doosri reasons ke liye move kiya ja raha hai.

          US economy ke improve hone ki umeed hai, jo ke pehle ke momentum ke inertia se driven hai. Unemployment kam hone ke chances hain, aur inflation bhi decrease honi chahiye jaise hi goods ki demand normalize hogi. Sick leave aur unemployment benefits ke reduced payments, jo pandemic ke duran allocate ki gayi thi, woh bhi is normalization mein contribute karengi. Is wajah se dollar mazid strong hoga.

          Lekin short term mein, EUR/USD pair mein bearish move ka potential hai. Eurozone data ki kami pair ke upside potential ko limit kar rahi hai. Agar 1.0750 ke upar rally fail hoti hai, to yeh sell scenario ko justify kar sakti hai, jiska result channel ke middle at 1.0590 ki taraf move hoga. Range ka breakout aur reverse test additional pressure create kar sakti hai euro par, aur dusra sell signal de sakti hai. Bears pullback ke baad 1.0635 par retreat kar sakte hain, lekin agar yeh range ke neeche fix hota hai, to aur zyada downside 1.0675 area tak ja sakti hai. Ultimate bearish target 1.0690 area hoga, jahan profits lena advisable hoga.
          Click image for larger version

Name:	image_4992551.png
Views:	44
Size:	29.3 کلوبائٹ
ID:	13026496
          Conclusion yeh hai ke jabke long-term outlook dollar ke liye positive hai US economy ke expected improvement ki wajah se, short-term technical analysis EUR/USD pair mein potential bearish movements suggest kar raha hai. Market ko closely monitor karna aur informed trading decisions lene ke liye best opportunities ka intezar karna essential hai.
             
          • #845 Collapse

            Regarding the pair EUR/USD. The pair is trading near the day's opening level of 1.0790 and close to the daily Pivot level of 1.0780.
            Key indicators are showing bullish momentum and the price is above the 72-period Moving Average trend line, where volume distribution usually occurs.
            Above the level of 1.0795, the price will continue its upward movement towards the levels of 1.0815 and possibly 1.0850.
            If the price drops below the level of 1.0780, I expect the pair to decline towards the levels of 1.0775 and possibly 1.0764.
            EUR/USD is trading above the monthly Pivot level of 1.0764 (previous was 1.0797), above the weekly Pivot level of 1.0707 (previous also 1.0707), and near the daily Pivot level of 1.0780, indicating a bullish sentiment for the pair.
            Above the daily Pivot level of 1.0780, the pair will move upwards; below the monthly Pivot level of 1.0764, the pair will move downwards. For now, I am bullish.Regarding the pair EUR/USD. The pair is trading near the day's opening level of 1.0790 and close to the daily Pivot level of 1.0780.
            Key indicators are showing bullish momentum and the price is above the 72-period Moving Average trend line, where volume distribution usually occurs.
            Above the level of 1.0795, the price will continue its upward movement towards the levels of 1.0815 and possibly 1.0850.
            If the price drops below the level of 1.0780, I expect the pair to decline towards the levels of 1.0775 and possibly 1.0764.
            EUR/USD is trading above the monthly Pivot level of 1.0764 (previous was 1.0797), above the weekly Pivot level of 1.0707 (previous also 1.0707), and near the daily Pivot level of 1.0780, indicating a bullish sentiment for the pair.
            Above the daily Pivot level of 1.0780, the pair will move upwards; below the monthly Pivot level of 1.0764, the pair will move downwards. For now, I am bullish.
            Click image for larger version  Name:	fetch (18).png Views:	0 Size:	79.8 KB ID:	13028656
               
            Last edited by ; 04-07-2024, 05:24 PM.
            • #846 Collapse

              EUR/USD 1.0800 ke aas paas hai, aur European session mein Thursday ko ooper ki taraf momentum le raha hai. Pair ki nai gains ka sabab taaza US dollar ki bikri aur September mein Fed rate cut ke barhati hui afwahain hain. ECB accounts ab focus mein hain. EUR/USD ne Wednesday ko 1.0800 ke ooper charh gaya tha, jahan 100-day aur 50-day Simple Moving Averages milte hain, magar din ke end mein is level ke ooper close nahi ho saka. Jab 1.0800 support ke tor par tasdeeq ho jayega, to technical buyer interest barh sakta hai. Is soorat mein, 1.0840 (Fibonacci 23.6% retracement of latest trend) interim resistance ban sakta hai pehle 1.0900 (psychological level, static level) se pehle. Agar 1.0800 resistance ke tor par qaim raha, to 1.0760 (Fibonacci 50% retracement) aur 1.0730-1.0740 (Fibonacci 61.8% retracement, 20-day SMA) support levels ban sakte hain. EUR/USD bullish momentum ikatha kar chuka hai aur Wednesday ko 1.0810 ke ooper chad gaya tha, aur 12 June ke baad se apna sabse ooncha level chhoo liya. Pair ab tak 1.0800 ke paas consolidation phase mein hai early Thursday. Ek disappointing macroeconomic data release se U.S. dollar mein bikri hui Wednesday ko U.S. trading hours ke dauran aur EUR/USD ko north ki taraf mod diya. ADP ne report diya ke private sector payrolls June mein 150,000 barh gaye, jo ke analysts ke estimate 160,000 se kam hain, aur weekly data Labor Department ne publish kiya ke 238,000 applications unemployment benefits ke liye pehli martaba ayi, jo pichle saal ke 233,000 se zyada hain.
              Akhir mein, ISM Services PMI June mein 48.8 pe gir gaya May ke 53.8 se, jo ke service sector business activity mein slowdown ka ishara hai. Iske ilawa, PMI survey ke employment index aur price paid index 46.1 aur 56.3 tak gir gaye hain. CME FedWatch tool ke mutabiq, Federal Reserve ke rate cut ki sambhawna 27% pe gir gayi hai Wednesday ke data release se pehle 32% se. Financial markets US mein Thursday ko Independence Day holiday ke liye band rahengi. Is liye, EUR/USD ka action subdued reh sakta hai. Friday ko, Bureau of Labor Statistics June jobs report release karega, jo ke nonfarm payrolls, unemployment rate aur wage inflation ka data shamil karega.
              Click image for larger version

Name:	image_5012956.jpg
Views:	47
Size:	22.2 کلوبائٹ
ID:	13028764
                 
              • #847 Collapse


                EUR/USD

                EUR/USD currency pair ne recently sideways trend se bullish trajectory mein shift kiya hai H4 chart par, jo traders ke liye ek promising opportunity present kar raha hai. Abhi 1.0790 mark ke aas paas trade kar raha hai, pair ka upward movement market participants ke beech optimism signal kar raha hai. Pichle hafte, EUR/USD ne 1.0670 ke near support levels se rebound karte hue resilience show kiya, aur 100 Simple Moving Average (SMA) ke upar breakout kiya. Yeh breakout na sirf ek buying opportunity ko affirm karta hai balki renewed market sentiment ko bhi underscore karta hai jo euro ke favor mein hai.

                Is bullish outlook ko support karte hue Moving Average Convergence Divergence (MACD) indicator ne ek clear buy signal generate kiya hai. In technical indicators ka convergence strongly suggest karta hai ke EUR/USD near term mein sustained upward momentum show kar sakta hai.

                100 SMA ko breach karne ki significance ko nazarandaz nahi karna chahiye, kyunki yeh aksar market dynamics mein ek pivotal shift mark karta hai. Traders is development ka note le sakte hain, jo potentially buying activity ko amplify kar sakta hai. MACD ka trends confirm karna further current bullish scenario mein confidence ko bolster karta hai. In indicators ke align hone ke saath, yeh confidence increase hota hai ke pair apni upward trajectory ko continue kar sakta hai.

                Agar current bullish momentum persist karta hai, to agla notable resistance level jo dekhna chahiye wo 1.0865 ke aas paas hai. Yeh level historically ek significant area represent karta hai jahan selling interest emerge ho sakta hai. Lekin, agar 1.0865 ke upar ek decisive breach hota hai to yeh further gains ke liye doors open kar sakta hai, potentially ongoing bullish trend ko validate aur strengthen kar sakta hai.

                Conclusion: H4 chart analysis of EUR/USD ek robust bullish sentiment ko highlight karta hai jo technical indicators jaise 100 SMA aur MACD se support karta hai. Pair abhi 1.0790 ke near trade kar raha hai aur 1.0865 resistance level ko target kar raha hai, traders positioned hain potential upward movements ko capitalize karne ke liye. Price action aur key resistance levels ko monitor karna crucial hoga traders ke liye jo is evolving market scenario mein apni strategies optimize karna chahte hain.


                Click image for larger version

Name:	image_5013020 (1).png
Views:	37
Size:	38.9 کلوبائٹ
ID:	13028880
                   
                • #848 Collapse

                  Technical analysis of the EURUSD pair

                  4-hour chart

                  Yeh raha tafseeli tajziya aur trading ke liye hidayat:

                  EUR/USD mein mukhtasar muddaton se bullish behavior nazar araha hai. Is hafte ki shuruat mein price ne ek upward gap ke saath open kiya, phir woh gap fill hua aur neeche girne ke baad dobara upward rebound hua, jis se weekly pivot level ke saath ek bottom form hua. Dusra indication upward trend ki taqat ka yeh hai ke price ne 1.0751 level ko break kiya aur uske baad channels se rebound kiya, phir se upar gaya jab broken channels ki lines se support mila.

                  Ab jab price ne 1.0788 level ko break kiya hai, to tayyar hai ek upward wave ke liye jo 1.0831 level tak ja sakta hai. Aaj aur kal ke trading ke liye mashwara yeh hai ke current level se 1.0831 level tak khareedai ki jaye aur stop loss 1.0788 level ke neeche rakha jaye.

                  Mehangi raftar ke mamle mein, US Federal Reserve ke akhri meeting ke minutes ke maawad ke baad investors ne EUR/USD price ko uchhaala diya, jis se woh 1.0820 resistance level tak pohanch gayi, jo ke teen hafte ke high the. Baad mein price Thursday ke trading ki shuruat mein 1.0780 level ke aas paas stabilize hui.

                  Maliyat ke hawale se, US policymakers ne June 2024 mein federal funds ke target range ko 5.25%-5.50% mein foran seventh consecutive meeting ke liye steady rakha, jo ke ummeedon ke mutabiq tha. Unka kahna hai ke woh tab tak interest rates ko kam nahi karenge jab tak ke unhe yaqeen na ho ke mahangai 2% ki taraf sustainably barh rahi hai. Ek dot plot ne dikhaya ke policymakers is saal sirf ek rate cut aur 2025 mein chaar cuts dekh rahe hain, jab ke March mein teen cuts 2024 aur teen 2025 ke liye dekh rahe the.

                  Agar aap EUR/USD pair par trading karna chahte hain to current level se 1.0831 level tak khareedai ki salah di ja rahi hai, stop loss 1.0788 level ke neeche rakhein. Mahangai ke barhne par roshni mein, yeh pair aage bhi upward ja sakta hai, lekin market ki halat ko bhi dhyan mein rakhein aur risk management par bhi tawajjo den.
                     
                  • #849 Collapse

                    EUR/USD Fundamentals outlook.
                    Kal hum ne EUR/USD mein bara bullish movement dekha, jab USA se negative data aya aur ab EUR/USD tezi se upar ja raha hai jab Greenback ki flow reverse course ho rahi hai.
                    US data broadly misses the mark, sparking risk appetite on rate cut hopes.
                    US holiday looms ahead of Friday’s NFP US data dump.
                    EUR/USD ne Wednesday ko ek leg up paya, briefly 1.0800 handle ke upar chadh gaya, jab US ki arthik figures mein broad miss ne ishara diya ki US ki arthvyavastha aur kamzor ho sakti hai, aur isse Federal Reserve (Fed) se rate cuts ki tezi se ummeed jagi, jisse market safe haven US Dollar se bahar nikal raha hai.
                    European data bhi Thursday ke early hours mein mixed aaya, jahan pan-EU HCOB Purchasing Managers Index (PMI) June mein 50.9 MoM par aaya, forecasted 50.8 ke mukable. EU-wide Producer Price Index May mein bhi expected se zyada tivr gira, -0.2% MoM ke mukable forecasted -0.1%.

                    US ADP Employment Change June mein 150K par aaya, previous month ke 157K se kam aur forecasted 160K se miss. ADP report mein bhi pata chala ki kai job additions lower-paying leisure aur hospitality industries mein concentrate the.

                    Additionaly, US Initial Jobless Claims June 28 tak pohanch kar 238K ho gaye, previous week ke 233K ke mukable, jisme forecasted 235K tha. Initial Jobless Claims ke four-week average bhi 238.5K ho gaye 236.25K ke mukable.

                    Akhri mein, US ISM Services Purchasing Managers Index (PMI) June mein 48.8 par gir gaya, jo June 2020 se lowest level hai. ISM Services PMI previous month ke 53.8 se gira, jisme forecasted 52.5 tha.

                    US markets Thursday ko dark rahenge kyun ki US Independence Day holiday hai, jisse Fiber traders ko German Factory Orders se deal karna hoga, jise May mein -0.2% se 0.5% MoM par rebound hone ka forecast hai. EUR/USD traders UK Parliamentary Elections ke result ke knock-on volatility ko bhi dekh rahe honge.

                    EUR/USD technical outlook.

                    EUR/USD ne ek recent bullish bounce extend kiya hai, jo ek demand zone se neeche 1.0680 ke price se shuru hua tha, aur briefly 1.0800 ke upar chart territory test kiya. Pair near-term mein further bullish hai, jo 200-hour Exponential Moving Average (EMA) at 1.0734 ke upar accelerate kar raha hai.

                    Mazeed bullish activity ke bawajood, Fiber ne 1.0794 par 200-day EMA ka mazboot tor nahi kar sakha aur rozana candlesticks mein upside potential ko had se zyada rokne wala rough descending channel, downside par inkar ke liye tayar hai.
                       
                    • #850 Collapse

                      Click image for larger version

Name:	image_5004235.jpg
Views:	31
Size:	202.8 کلوبائٹ
ID:	13028961 631 Collapse Azaz5

                      EUR/USD ne Monday ko advancement dekha. Volatility sirf 27 pips thi, jo aam tor par hone wali volatility se kaafi kam hai. Generally, koi movements nahi hui. In conditions mein trade karna namumkin tha. Phir bhi, euro thoda sa upar aane mein kamyab raha. 10-15 pip ka rise market noise ki wajah se tha. Yeh change itna insignificant tha ke discuss karne layak bhi nahi. Phir bhi, hum insist karte hain ke euro girne se inkar kar raha hai, aur correct hone se bhi jabke sari zaroori conditions maujood hain. Uske bajaye, single currency bina kisi justification ke rise kar sakti hai, jaise ke humne recently dekha hai.

                      Koi significant events nahi hue, jo pair ki movements mein clearly reflected hain. European Central Bank ke chief economist, Philip Lane ne ek speech di, lekin market ko koi nai information nahi mili. Unhone apne colleagues ke statements repeat kiye ke June ek acha time hai key rate ko lower karne ke liye, jo dobara euro ke decline ko trigger karna chahiye tha, na ke uske rise ko. Is tarah, fundamental aur macroeconomic background market dwara ignore hota hua lagta hai.

                      Low volatility ke darmiyan, pair ne ek trading signal form kiya. US trading session ke start mein, price critical line se bounce hui aur phir 10 pips tak rise kar gayi. Agar kisi traders ne is signal ka faida uthaya, to shayad unhe thoda profit mila ho. 1-hour chart par, EUR/USD pair weak lekin steady bullish correction se guzar raha hai broader downtrend ke against pichle ek mahine se. Since Federal Reserve rate cut ke expectations 2024 mein significantly decrease hui hain, aur ECB tayar hai ke rates ko sirf do hafton mein lower kare, hum believe karte hain ke US currency medium term mein rise karni chahiye. Hum ab bhi expect karte hain ke price ascending channel ke niche consolidate kare taake downtrend resume ho sake. Lekin, aisa lagta hai ke market dollar ko buy karne ke liye tayar nahi hai aur generally trade karne ke liye bhi tayar nahi hai. Euro bas har roz thoda upar jaata hai ya phir wahi pe khada rehta hai.


                      • #851 Collapse

                        The EUR/USD pair has shown resilience following the latest release of the US Federal Reserve's meeting minutes. This move saw the euro reaching the 1.0816 resistance level, a three-week high, before stabilizing around 1.0785 early on Thursday. The Federal Reserve's decision to keep the federal funds rate steady at 5.25%-5.50% for the seventh consecutive meeting aligns with market expectations, indicating a cautious stance amidst current economic conditions. Economic Calendar Data:
                        - **Eurozone Producer Prices**:
                        - Monthly: Fell by 0.2% in May 2024 (vs. 1% decline in April, expectations of a 0.1% decline).
                        - Annual: Fell by 4.2% (better than the expected -4.1% and the previous -5.7%).
                        - Excluding Energy: Rose by 0.1% monthly, fell by 0.4% annually.Eurozone Composite PMI
                        - Revised slightly up to 50.9 in June 2024 (from preliminary 50.8, down from 52.2 in May).
                        - Services PMI slowed to 52.8 (from 53.2).
                        - Manufacturing PMI contracted further to 45.8 (from 47.3).
                        - Notable decline in new orders, especially in non-domestic markets.
                        - Job creation rate weakened, price pressures eased to their lowest in several months
                        - **Price Pattern**: The EUR/USD pair traded within a descending triangle before breaking higher, suggesting potential further gains.
                        Support and Resistance Levels
                        - Support at the previous resistance level.
                        - Fibonacci Extension Tool indicates potential upside targets:
                        - 38.2% extension: 1.0750 (already tested)
                        - 50% level: 1.0762
                        - 61.8% level: 1.0775
                        - 76.4% level: 1.0790
                        - Full extension: 1.081
                        The EUR/USD pair's recent performance is supported by a mix of cautious optimism from the Federal Reserve and mixed economic signals from the Eurozone. The technical indicators suggest that there might be room for further upward movement if the support levels hold and market sentiment remains positive. Investors should watch for any new economic data or policy announcements that could influence these dynamics
                        Click image for larger version

Name:	EURUSD_2024-07-04_09-38-49.png
Views:	33
Size:	79.3 کلوبائٹ
ID:	13028978
                           
                        • #852 Collapse

                          **Specialized Analysis of the EUR/USD 4-Hour Chart**

                          Price action se lagta hai ke aaj aur kal ke trading session mein price barh sakti hai. Iss haftay ke aghaz mein price ne ek upward gap ke saath trading shuru ki thi, jahan se price upward move hui bina gap ko close kiye, aur yeh price channels ko upward break karne mein kamiyab rahi. Jab price ne 1.0788 ke resistance ko face kiya, to price ne downward rebound kiya, aur decline daily pivot position aur price gap area tak pohonchi jo close ho chuki thi. Phir se price ne upward rebound kiya, aur price channels ke position ke upar dubara stabilize hui.

                          Current position se price ko resistance position 1.0788 aur phir 1.0830 tak buy kiya ja sakta hai. Economic side par, euro ki gains us waqt halki par gayi jab policymakers ne kaha ke unhe price pressures ke control mein hone ka ziada saboot chahiye. Initial estimates ne dikhaya ke euro area mein annual inflation rate June mein 2.5 par aagayi, jo expectations ke mutabiq thi. Core measure, jo ke food aur energy jaise unpredictable items ko exclude karta hai, unexpected unchanged raha. Germany, France aur Spain mein inflation rates slow hui, jabke Italy mein yeh 0.9 par barh gayi.


                          Iske bawajood, ECB President Lagarde ne ECB Forum mein kaha ke central bank ke paas abhi tak sufficient evidence nahi hai ke inflation risks guzar chuke hain. Politically, far-right National Rally party ne France ke early administrative elections ke pehle round mein jeet hasil ki, lekin expected share se kam aur majority se door, jo investors ko yeh confidence diya ke central parties abhi bhi power mein reh sakti hain.

                          Economic calendar ke results ke mutabiq, Eurozone inflation June mein kam hui aur expectations ke mutabiq European Central Bank September mein interest rates ko phir se cut karne ki position mein ho sakti hai. Announcement ke mutabiq, headline inflation June mein 2.5 par aa gayi year-on-year, jo ke May ke 2.6 se kam thi, aur market expectations ke mutabiq thi. Core inflation rate 2.9 se gir kar 2.8 par aayi.
                           
                          • #853 Collapse

                            Euro ne upper band ke saath move karne ki koshish ke baad central area ki taraf pull back shuru kar diya hai. Is surat mein price growth ke liye naye high-quality signal ko accept karne ke liye, worth yeh hai ke upper band ke beyond ek active rout ka intezar kiya jaye, aur phir yeh assess kiya jaye ke bands outward expand karenge ya nahi. Fractals ke hawale se baat karte hue, history mein price ne nearest fractal ko downside pe break kiya aur June 13 ke position par pehle target ko achieve karne mein kamiyab rahi. Filhal, ek naye near fractal downside pe form hua hai, iska rout aur upar connection price ko June 12 ke position 1.08517 tak le jaane ki ijazat dega. Nearest fractal jo strike ke liye hai wo kaafi door hai, isliye price decline ke potential ke liye naye near fractal ka intezar karna judicious hai.

                            Click image for larger version

Name:	image_5013133.png
Views:	28
Size:	40.9 کلوبائٹ
ID:	13029351

                            EUR/USD karansi pair correcting mode mein hai. Iska support level 1.0780 par bohot acha hai, jo ke is Monday ka high bhi hai aur 100th Fibonacci level bhi. Agar is level tak pullback hota hai, to isse bohot achi buy positions open ki ja sakti hain, jo phir 161st level tak hold ki ja sakti hain, jo 1.0840 ke aas paas hai. Magar, yeh mumkinat exclude nahi ki ja sakti ke kal price bina pullback ke directly apne northern targets ki taraf kaam shuru kar de, is surat mein hum naye trading opportunities dhoondhenge
                            Stupendous Oscillator index actively positive zone mein add ho raha hai, ek naya outside form ho chuka hai. Abhi tak clear nahi hai ke pehla peak kab form hoga, jo yeh indicate karega ke price growth mazeed continue kar sakti hai. Price decline ke liye high-quality signal accept karne ke liye, judicious hai ke zero level ki taraf ek active fading ka intezar kiya jaye. Numerical mark 1.0812 se, mere khayal mein, hum support area 1.0760-1.0740 tak gir sakte hain. Mujhe yeh pasand nahi ke price itne arsey se yahan stuck hai, kyun ke agar bulls mein ab bhi north ki taraf move karne ki taqat hai, to hum withdrawal ka intezar nahi kar sakte. Well, kal weekend se pehle akhri din hai aur mujhe umeed hai ke yeh ek correction hogi aur bears kam az kam 70 points south current price position se move karenge
                            Euro/USD karansi pair ke halat ke mutabiq, price ne upper band ko chhune ki koshish ki magar central area ki taraf pull back kiya hai. Naye high-quality signal ko dekhne ke liye, upper band ke beyond active rout ka intezar zaroori hai. Fractals ke analysis ke mutabiq, pehla target June 13 ke position par achieve hua aur naye near fractal downside pe form hue hain. EMA aur Fibonacci levels ke analysis ke sath, trading strategies ko adjust karna aur price movements ko closely observe karna important hai. Proper technical analysis aur tools ka istimaal karke, profitable trading opportunities ko identify kar sakte hain aur risk ko behtar manage kar sakte hain. Market ke changing conditions ke liye tayar aur flexible rehna zaroori hai, jab ke trading plan ko discipline ke sath follow karna bhi important hai.
                               
                            • #854 Collapse

                              یورو امریکی ڈالر کے خلاف بلش ٹرینڈ پر چل رہا ہے، جو ٹریڈرز کو ایک مواعدہ بھرے موقعے کے ساتھ پیش کرتا ہے۔ حالیہ دنوں میں یہ تقریباً 1.0790 کے درمیان ٹریڈ ہو رہا ہے، جو اس جوابی حرکت کی علامت ہے کہ مارکیٹ میں شرکاء کی درمیانی خواہش محسوس ہورہی ہے۔ یورو / یو ایس ڈالر نے پچھلے ہفتے 1.0670 کے قریبی سپورٹ سطحوں سے اپنے اثرات کی نمائش کی، جس نے 100 سادہ متحرک اوسط (sma) کے اوپر ایک برک آؤٹ کو آغاز دیا۔ اس برک آؤٹ نے صرف ایک خریدنے کے مواقع کی تصدیق کی ہی نہیں کی بلکہ یورو کے خلاف نیا بازاری سنٹیمنٹ بھی دھمکیاں دی۔

                              اس بلش نگرانی کو سپورٹ کرنے والا ہے موونگ ایورج کنورجنس ڈائیورجنس (macd) انڈیکیٹر جو ایک واضح خریداری سگنل جنریٹ کیا ہے۔ ان تکنیکی اشاروں کے ایک ساتھ ملنے سے وضاحت ملتی ہے کہ قریبی مدت میں یورو / یو ایس ڈالر کے لئے مستقل اپ ورڈ مومنٹم کی حفظت کے امکانات ہیں۔

                              100 sma کو توڑنے کا اہمیتی حصہ یہ ہے کہ یہ عام طور پر مارکیٹ کی میں شریف میں ایک مہمی تبدیلی کو نشان دیتا ہے۔ ٹریڈرز کو اس ترقی کا یقیناً نوٹ لینے کی پیش رفت ہو سکتی ہے، جو خریداری کی سرگرمی کو مہم بخشنے کے امکانات ہیں۔ macd کے کردار میں اشارہ کرنے سے موجودہ بلش منصوبہ میں اعتماد مضبوط کرتا ہے۔ ان اشاروں کے ہم آہنگ ہونے سے یہ اعتماد بڑھتا ہے کہ جوڑ ممکن ہے اپنے اوپری مسلسل حرکت کو جاری رکھے گا۔

                              آگے دیکھتے ہیں، اگر موجودہ بلش مومنٹم جاری رہا تو، اگلا نوٹیس کرنے والا اہم مزید 1.0865 کے قریبی مزید ریسسٹنس سطح ہے۔ یہ سطح تاریخی طور پر ایک اہم خط ہے جہاں فروختی دلچسپی کی امکان ہے۔ البتہ، 1.0865 کے اوپر کی ایک حتمی توڑ بھیڑ میں مزید فوائد کے لئے دروازے کو کھول سکتا ہے، موجودہ بلش منصوبے کی تصدیق اور مضبوطی کر سکتا ہے۔
                                 
                              • <a href="https://www.instaforex.org/ru/?x=ruforum">InstaForex</a>
                              • #855 Collapse

                                **EURUSD ka Mukhtasir Tajziya (4-Hour Chart)**

                                Qeemat aaj aur kal ke doran barhne ke imkaanat hain. Is hafte, qeemat ne trading shuru ki thi aik price gap ke saath, jo upar ki taraf move karti rahi bina isay close kiye, aur ye price channel ko upward break karne mein kamiyab rahi. Magar, 1.0788 ke resistance ka samna karne ke baad, qeemat wapas giri aur daily pivot position aur price gap area tak aayi jo close ho gaya.

                                Is ke baad qeemat phir se upar ki taraf gayi aur price channel ke position ke upar stabilize ho gayi. Current position se lekar 1.0788 aur phir 1.0830 ke resistance positions tak khareedne ka moqa hai.

                                Faida mand side par, euro ke earnings falter hui jab policymakers ne kaha ke unhein mazeed saboot chahiye ke price pressures control mein hain. Pehle estimate ne dikhaya ke euro area mein annual inflation rate June mein 2.5 tak gir gayi, jo expectations ke mutabiq thi. Core measure, jo food aur energy jese unpredictable items ko exclude karta hai, wo achanak unchanged raha. Germany, France aur Spain mein inflation rates slow hui, jabke Italy mein ye 0.9 tak barh gayi.

                                **Tasveer ka link:**


                                Is ke bawajood, ECB President Lagarde ne ECB Forum mein kaha ke central bank ke pas abhi tak kafi saboot nahi hain ke inflation ka khatra guzar gaya hai. Siyasi tor par, far-right National Rally party ne France mein pehle round ke early administrative elections mein jeet hasil ki, magar anticipated se kam share ke sath aur majority se door thi, jo investors ko kuch tasalli di ke central parties shayad power retain kar sakti hain.

                                Economic calendar ke natayij ke mutabiq, Eurozone inflation June mein gir gayi aur prospects ye hain ke European Central Bank September mein dobara interest rates cut kar sakti hai. Advertisement ke mutabiq, headline inflation June mein year-on-year 2.5 tak gir gayi May ke 2.6 se, jo statistics office Eurostat ke mutabiq market expectations ke mutabiq thi. Core inflation rate 2.9 se 2.8 tak gir gayi.
                                   

                                اب آن لائن

                                Working...
                                X