Falling Window Candlestick Chart Pattern
X
  • وقت
  • دکھائیں
Clear All
new posts
  • #1 Collapse

    Falling Window Candlestick Chart Pattern
    Falling Window Candlestick Chart Pattern

    Candlestick charts financial markets mein prices ki movement ko dekhnay ka aik popular tareeqa hai. Chart aik khaas muddat ke douran kisi asset ki qeemat ki karwai ki numindagi karte hain, aur traders ko market ke trend aur simt ke baray mein qeemti maloomat faraham kar satke hain. Candlestick ke sab se popular patterns mein se aik" Falling window" Ka namona hai. Is pattern ki khasusiyat mandi ki qeemat mein farq hai jo lagataar do trading sishnz ke darmiyan hota hai. Pattern ko aksar market mein weakness ki alamat ke tor par dekha jata hai, kyunkay yeh batata hai ke farokht ka dabao barh raha hai aur khredar apna control kho rahay hain. Hum falling window pattern par geherai se nazar dalain ge, bashmole is ki tareef, usay kaisay pehchana jaye, aur is ki tijarat kaisay ki jaye. Hum kuch ahem awamil ka bhi jaiza len ge jo pattern ki taseer ko mutasir kar satke hain, bashmole hajam, time frame, aur deegar takneeki isharay.

    Click image for larger version

Name:	1664960760507.jpeg
Views:	5
Size:	29.4 کلوبائٹ
ID:	12590353

    Definition of the Falling Window Pattern

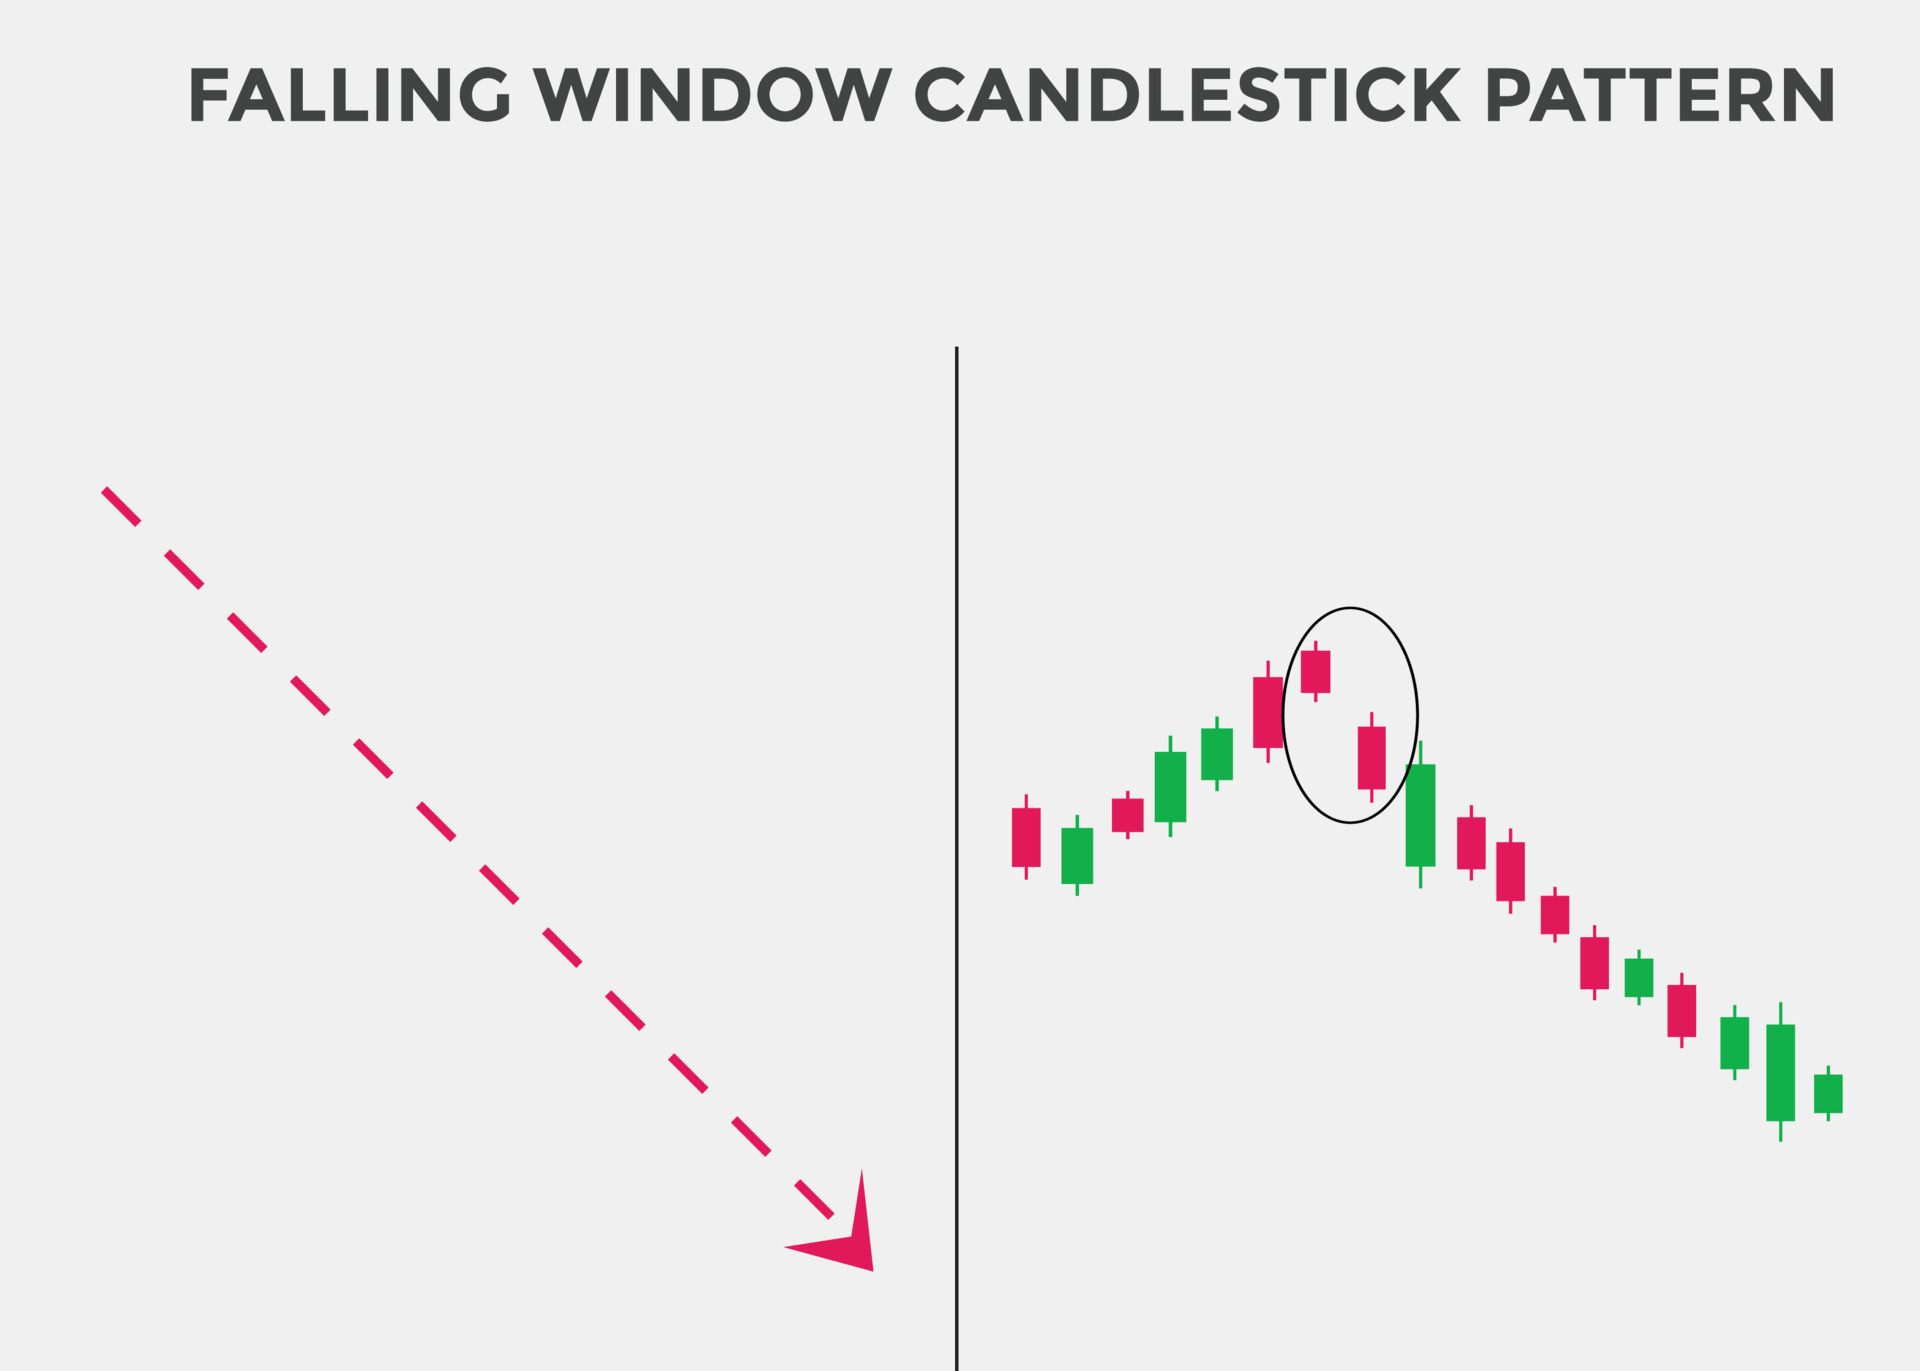
    Falling window pattern, jisay "Downward gape" Ke naam se bhi jana jata hai, aik bearish candlestick pattern hai jo is waqt hota hai jab lagataar do trading sishnz ke darmiyan qeemat ka farq khilta hai. Farq is waqt hota hai jab dosray session ka kam hissa pehlay session ke aala se ziyada hota hai. Pattern ko aam tor par market mein weakness ki alamat ke tor par dekha jata hai, kyunkay yeh batata hai ke baichnay walay control haasil kar rahay hain aur khredar dilchaspi kho rahay hain. Khalaa jitna bara hoga, pattern ko itna hi ahem samjha jaye ga. Aik chhota sa farq mamooli ho sakta hai aur bazaar ke aam utaar charhao ki wajah se ho sakta hai, jab ke aik bara farq trend ke ulat jane ka ziyada imkaan rakhta hai. Falling window pattern ko kisi bhi financial market mein dekha ja sakta hai, bashmole stock, bandz, commodities, aur currency. Yeh stock markets mein khaas tor par aam hai, jahan usay aksar mandi ke trend ki alamat ke tor par dekha jata hai.

    Click image for larger version

Name:	1664960760507.jpeg
Views:	5
Size:	29.4 کلوبائٹ
ID:	12590353

    Identifying the Falling Window Pattern

    Falling window pattern ki indication karne ke liye, traders ko lagataar do trading sessions ke darmiyan waqfa talaash karna chahiye. Farq ko dosray session mein pehlay session ke aala ke muqablay mein kam nichli satah se numaya kya jana chahiye. Dosray session mein is farq ke sath bearish candle sticks hona chahiye, jo is baat ki indication karta hai ke farokht ka dabao barh raha hai. Traders ko farq ke douran hajam par bhi tawajah deeni chahiye. Farq ke douran ziyada hajam ko aksar pattern ki tasdeeq ke tor par dekha jata hai, kyunkay yeh batata hai ke traders ki aik barri tadaad asset farokht kar rahi hai. Traders ko pattern ki shanakht karte waqt is ke sayaq o sabaq par bhi ghhor karna chahiye. Falling window ka pattern is waqt ziyada ahem hota hai jab yeh taizi ki sargarmi ki muddat ke baad hota hai. Agar pattern tanhai mein hota hai, to yeh kam ahem ho sakta hai aur ho sakta hai ke trend ke ulat jane ki indication nah kere.

    Click image for larger version

Name:	1664960729226.png
Views:	9
Size:	9.8 کلوبائٹ
ID:	12590354

    Trading the Falling Window Pattern

    Traders trading ke faislay karne ke liye falling window pattern ka istemaal kar satke hain. Pattern ko aksar mandi ke trend ki alamat ke tor par dekha jata hai, aur tajir usay mukhtasir position kholnay ya lambi positionsse bahar niklny ke liye istemaal kar satke hain. Falling window pattern ki tijarat karte waqt, traders ko darj zail awamil par ghhor karna chahiye :

    Time frame: Falling window pattern long time frame par ziyada ahem ho sakta hai, jaisay rozana ya hafta waar charts. Traders ko chahiye ke woh jis time frame par trade kar rahay hain is par ghhor karen aur is ke mutabiq apni strategy ko adjust karen.

    Stop loss: Traders ko window ke falling pattern ki tijarat karte waqt –apne khatray ko mehdood karne ke liye hamesha stap las orders istemaal karne chahiye. Stap las ko pehlay session ki oonchai se oopar rakhna chahiye, taakay mumkina trend ke ulat jane se bachaya ja sakay.

    Confirmation: Traders ko tijarat mein daakhil honay se pehlay pattern ki tasdeeq ka intzaar karna chahiye. Tasdeeq bearish candlestick ya aglay trading session mein nichli satah ki soorat mein aa sakti hai.

    Volume: Traders ko farq ke douran hajam par tawajah deeni chahiye, kyunkay ziyada hajam pattern ki tasdeeq faraham kar sakta hai.

    Click image for larger version

Name:	5b6349ea-444b-4708-87c3-2ae80c4f19e1.png
Views:	2
Size:	118.2 کلوبائٹ
ID:	12590355
  • <a href="https://www.instaforex.org/ru/?x=ruforum">InstaForex</a>
  • #2 Collapse

    Re: Falling Window Candlestick Chart Pattern

    What is falling window candlestick pattern?


    What is Falling Window Candlestick Pattern? A price gap in a downward trend is referred to as a Falling Window candlestick pattern. It must happen while the price trend is down, and it is always a bearish signal.
    What does rising window candlestick pattern mean?


    Which candlestick pattern is best for swing trading?


    Candlesticks such as the spinning top and engulfing patterns can help confirm bullish or bearish sentiment that swing traders can take advantage of.
    • #3 Collapse

      Re: Falling Window Candlestick Chart Pattern

      Defination of Falling window

      Dear member falling window aik candle stick pettern hay jo do bearish candle stick pr mushtamil hote hay jis kay darmean nechay ka faslh hota hay. daon gap wali candle stick kay unchay aor pichly candle stick kay nichlay hisay kay darmean aik khula hay.yh market men frokht kay orders ke zeadh miqdar ke wajah say hota hay.
      yh aik bearish trend continuation candle stick pettern hay jo market men sell karny walon ke taqt ko zahir krta hay. assets security ke price nechay jate rhy ge jab price chart pr falling window ban jaeay ge.


      Identification of falling window

      Dear member price kay chart pr aik kamal falling window pettern ko talash karnay kay leay darj zeal tareqah kar pr amal kren.do bearish candle stick aor hal he men bnaee gee bearish candle ke aonchaee aor pichly bearish candle stick kay km kay darmean faraq talash kren.kheal rhy kh gap zeadh bara nhen hona chaheay.
      bearish candle sticks ka jisam bara hona chaheay kiyun kh yh sell karny walon ke bare raftar ka asharh hay.
      yh price men mande kay rujhan kay doran banna chaheay.


      Prices men mnde kay rujhan kay sath falling window pettern ke trading krna behtren amal hay. kiyun kh yh aik rujhan taslsl ka nmonh hay aor yh srf rjhan kay andr kam kray ga. agar falling window pettern support zone kay opr banta hay to aap ko as ke tijart say gureez krna chaheay kiyun keh suport zone rujhan kay tasalsul ko rokay ga. dosre trf agr yh pettern sport zon breakout kay bad banta hay to yh mnde kay rujhan kay tasalsul ka aik acha asharh hay.

      How to trade with falling window

      Dear member falling window men nechay ka farq price kay leay resistance zone kay tor pr bhe kam kray ga. kiyun kh as zone men selling order ke aik barre miqdar price ko as waqt tak nechay rakhay ge jab tak kh tamam selling order nhen bhray jaeen ga.Falling window pettern kay bad ya to price nechay ke taraf barhte rhy ge ya yh kchh selling order ko pur krnay kay leay gap zone ke tarf aik mamole pullback day ge.lehza window kay falling pettern ke tjart kay do treqay hen. ya to aap as candle stick ke tashkel kay foran bad frokht kay order khol sktay hen ya aap as waqt tak intazr kr sktay hen jab tak kh qemt gap zone ke tarf pullback nhen dete. bad men aik aale risk reward trade set ap day ga.
      • #4 Collapse

        Re: Falling Window Candlestick Chart Pattern

        The falling window, also known as the "falling gap," is a bearish candlestick chart pattern frequently used in forex trading. It usually appears when there is a gap between the high and low prices of two consecutive candles, and the second candle opens below the close of the first candle, leaving a gap between them.The falling window pattern indicates a strong bearish sentiment in the market, where traders are aggressively selling the asset, causing prices to drop significantly. This pattern is usually followed by a downtrend or a continuation of a bearish trend.Traders can use the falling window pattern as a signal to enter short positions or sell their existing long positions, with stop-loss orders placed above the high of the second candle. The profit target can be set based on the support level or the next significant resistance level.It's important to note that like any other technical indicator, the falling window pattern is not foolproof and should be used in conjunction with other technical and fundamental analysis tools to make informed trading decisions. Additionally, it's important to manage risk by using appropriate position sizing and risk management techniques.
        • #5 Collapse

          Re: Falling Window Candlestick Chart Pattern

          Falling Window Candlestick Pattern ka Introduction

          The Falling Window candlestick pattern is a bearish pattern that occurs in technical analysis. It is also known as the "downward gap" or "falling gap" pattern. The pattern consists of two candlesticks, with the first candlestick being bullish and the second candlestick being bearishFalling window candle light arrangement costs fundamental aksar aik waqfay k dawran banta hai, ye plan waqfay k doaran occasions strong regions for ya ka sabab banta hai, jiss ki waja se basics asarat resources ki costs ko teezi k sath lower push karte hen, plan key shamil candles ki improvement darjazzel tarah se hoti jy gii

          Click image for larger version

Name:	images (8).jpeg
Views:	10
Size:	20.4 کلوبائٹ
ID:	12450373
          Falling Window Candlestick Pattern ki Explaination

          The Falling Window pattern is often seen as a strong signal of a bearish trend, as it suggests that selling pressure has taken over from buying pressure. Traders will often look for other technical indicators to confirm the bearish trend before making a trading decision.Falling window Candlestick Pattern plan ki pehli light aik negative flame hoti hai, jo k costs k standard sabeqa plan ki akasi karti hai. Ye fire white ya green combination focal hoti hai, jo k shadow ya shadow k bagher bhi ho sakti hai, lekin true body ka wazih hona zarori hai.Falling window candle light arrangement costs essential aksar aik waqfay okay dawran banta hai, ye plan waqfay ok doaran occasions sturdy areas for ya ka sabab banta hai, jiss ki waja se basics asarat sources ki costs ko teezi k sath decrease push karte hen, plan key shamil candles ki improvement darjazzel tarah se hoti jy giiFalling window candle plan ki pehli light aik negative flame hoti hai, jo ok fees okay standard sabeqa plan ki akasi karti hai. Ye fire white ya inexperienced aggregate focal hoti hai, jo k shadow ya shadow k bagher bhi ho sakti hai

          Click image for larger version

Name:	images (11).png
Views:	17
Size:	17.9 کلوبائٹ
ID:	12450374

          Falling Window Candlestick Pattern ki Pehchan

          Falling Window Candlestick Pattern is characterized by a gap down between the first and second candlesticks, indicating a sudden shift in market sentiment from bullish to bearish. The gap is formed when the opening price of the second candlestick is lower than the closing price of the first candlestick.Falling window mild important asarat ki waja se hota hai. Falling window flame plan boss poor model ok dowran do bad candles okay darmeyan plunging aspect trendy aik establishing banta hai, jo ok fees k bad version affirmation ki alamat hoti hai. Ye association genuinely regrettable candles standard mushtamil hota hai, jiss fundamental pehli fire okay insignificant fee aur dosri light k exorbitant prices k darmeyan aik wazih aur clean beginning hota hai. Ye plan companies ki marketplace head mazboti aur charges ka mazeed negative jane ka aik clear message hota hai.Pricey jb ham Falling window light fireplace ka hona zarori hai, aur plan lazmi support line k plunging hona chaheye

          Click image for larger version

Name:	images (7).jpeg
Views:	3
Size:	21.7 کلوبائٹ
ID:	12450375
          • #6 Collapse

            Forex trading mein candlestick patterns bohot important tools hain jo traders ko market ke future price movements ko predict karne mein madad karte hain. In candlestick patterns mein se ek significant pattern hai Falling Window Candlestick Pattern, jo bearish continuation ko indicate karta hai. Jab yeh pattern form hota hai to yeh signify karta hai ke downtrend continue hone wala hai.


            Falling Window Candlestick Pattern Ki Pehchan
            Falling window candlestick pattern, Japanese candlestick charting technique ka ek part hai. Yeh pattern tab form hota hai jab ek bearish gap create hota hai. Yani, ek candle ka low price previous candle ke high price se neeche hota hai aur beech mein koi overlap nahi hoti. Is pattern ka doosra naam "bearish gap" bhi hai. Yeh bearish continuation pattern signify karta hai ke market ki selling pressure abhi bhi intact hai aur downtrend continue hone ki expectation hai.

            Falling Window Candlestick Pattern Ki Formation
            Falling window pattern ki formation kuch is tarah hoti hai:
            1. First Candle: Pehli candle ek bearish candle hoti hai jo indicate karti hai ke market mein selling pressure hai aur price neeche ja rahi hai.
            2. Gap: Pehli candle ke close hone ke baad, agle trading session mein market significantly lower open hoti hai, jo ek gap create karti hai. Yeh gap signify karta hai ke market mein sellers ka dominance hai aur buyers ke interest mein kami hai.
            3. Second Candle: Doosri candle bhi bearish hoti hai aur gap ke neeche close hoti hai, jo indicate karti hai ke downtrend abhi bhi continue ho raha hai.
            Falling Window Candlestick Pattern Ki Importance
            Falling window pattern ki importance is baat mein hai ke yeh downtrend ke continuation ko indicate karta hai. Yeh pattern aapko selling opportunities ko identify karne mein madad karta hai. Jab yeh pattern form hota hai to iska matlab hai ke market mein ab buyers dominate nahi kar rahe aur sellers ka pressure continue ho raha hai.

            Falling Window Candlestick Pattern Ke Components
            Falling window pattern ke kuch important components hain jo aapko is pattern ko samajhne aur analyze karne mein madadgar honge:
            1. Bearish Gap: Is pattern ka most significant component bearish gap hai. Yeh gap signify karta hai ke market mein significant selling pressure hai aur buyers ke interest mein kami hai.
            2. Candlestick Bodies: Pehli aur doosri candle dono bearish hoti hain. In candles ka body size vary kar sakta hai, lekin generally yeh significant selling pressure ko indicate karti hain.
            3. Volume: Volume ka analysis bhi important hai. Jab falling window pattern form hota hai to volume generally high hoti hai jo selling pressure ko confirm karti hai.
            Technical Indicators Aur Falling Window Pattern
            Technical indicators ka istemal karke aap falling window pattern ki confirmation le sakte hain. Kuch important indicators jo is pattern ke analysis mein madadgar hote hain woh hain:
            1. Moving Averages: Moving averages, khas tor par 50-day aur 200-day moving averages, falling window pattern ko confirm karne mein madadgar hoti hain. Jab short-term moving average (50-day) long-term moving average (200-day) ke neeche hoti hai, to yeh bearish trend ko confirm karti hai.
            2. Relative Strength Index (RSI): RSI falling window pattern ke time oversold conditions ko indicate kar sakta hai. Agar RSI 30 ke neeche ho aur phir gradually upar aana shuru ho, to yeh market ke temporary exhaustion ko signify karta hai.
            3. MACD: Moving Average Convergence Divergence (MACD) indicator bhi falling window pattern ko confirm karne mein madadgar hota hai. Jab MACD line signal line ke neeche hoti hai aur dono lines negative territory mein hoti hain, to yeh bearish trend ko confirm karti hain.
            Falling Window Candlestick Pattern Ki Trading Strategies
            Falling window pattern ko identify karne ke baad, aapko apni trading strategy plan karni chahiye. Niche kuch important trading strategies di gayi hain jo is pattern ko trade karne mein madadgar ho sakti hain:
            1. Entry Point: Falling window pattern complete hone ke baad jab price gap ke neeche close karti hai, to yeh ek ideal entry point hota hai. Aapko is point pe short position lena chahiye.
            2. Stop Loss: Risk management ke liye stop loss ka set karna bohot zaroori hai. Stop loss ko gap ke upar set karna safe hota hai taake agar market aapke against move kare to aapke losses limited rahen.
            3. Target Profit: Profit target set karna bhi important hai. Aap previous support levels ya significant Fibonacci retracement levels ko profit target ke tor par use kar sakte hain.
            4. Volume Confirmation: Volume analysis bhi aapki trading strategy ko support kar sakti hai. Jab price pattern complete hone ke baad high volume ke saath move karti hai, to yeh move ki confirmation hoti hai aur aap confidently trade le sakte hain.
            Case Study
            Ek hypothetical case study ko samajhte hain taake falling window pattern ko real-world scenario mein apply kar sakein:

            Background
            Ek currency pair, GBP/USD, ek steady downtrend mein tha aur gradually 1.3000 se 1.2500 tak pohanch gaya. Is duration mein price lower highs aur lower lows bana rahi thi. Lekin 1.2500 ke qareeb aake falling window pattern form hone laga.

            Analysis
            1. First Candle: Pehli candle ek strong bearish candle thi jo 1.2600 se 1.2500 tak move ki. Volume high thi aur sellers ka strong momentum tha.
            2. Gap: Agle trading session mein market significantly lower open hui, jo ek gap create hui. Price 1.2400 pe open hui aur gap form hui.
            3. Second Candle: Doosri candle bhi bearish thi aur gap ke neeche close hui. Yeh 1.2400 se 1.2350 tak move ki. Volume further high hui jo selling pressure ko confirm karti hai.
            Trading Strategy
            1. Entry Point: Jab price 1.2350 ke neeche close hui, to short position lena.
            2. Stop Loss: Stop loss gap ke upar set karna, yani 1.2450 ke aas paas.
            3. Target Profit: Target profit 1.2200 pe set karna jo ke significant support level tha.
            Psychological Aspects
            Forex trading mein psychological factors bhi bohot important hain. Falling window pattern ko trade karte waqt aapko disciplined aur patient rehna zaroori hai. Fakeouts aur market noise se bachne ke liye proper analysis aur confirmation signals ka intezar karna chahiye. Kabhi bhi impulsive decisions nahi lene chahiye aur apni trading plan ko strictly follow karna chahiye.

            Falling window candlestick pattern forex trading mein ek important aur reliable bearish continuation pattern hai. Is pattern ko identify karne, analyze karne aur trade karne ke liye proper knowledge aur technical analysis tools ka istemal zaroori hai. Volume, moving averages, RSI aur MACD jaise indicators is pattern ki confirmation mein madadgar hote hain. Trading strategies ko plan karte waqt entry, stop loss aur target profit points ko clearly define karna chahiye. Psychological discipline aur patience ke saath is pattern ko trade karke aap successful trades kar sakte hain. Forex trading ek continuous learning process hai, aur har pattern ko analyze karne aur trade karne ke experience se aapki trading skills improve hoti hain.
            Believe in yourself and your abilities. When you fight for your dreams, you can achieve anything.
            • #7 Collapse

              Forex Trade Mein Falling Window Candlestick Chart Pattern

              Forex trading mein candlestick patterns ka istemal karte waqt, "Falling Window" ya "Gapping Down" pattern ek ahem rol ada karte hain. Is pattern ko samajhna aur us par trading strategies banane se traders ko bearish trends ko samajhne aur un par amal karne mein madad milti hai.

              1. Falling Window Candlestick Chart Pattern Ki Tashreeh

              Falling window pattern ek bearish continuation pattern hai jo downtrend ke doran dikhai deta hai. Is pattern mein ek gap hota hai jo pehle candlestick ke closing price se nicha hota hai.

              Falling window pattern ki tashreeh ke liye, humein yeh samajhna zaroori hai ke is mein market mein ek sudden gap hota hai jo downward trend ki continuation ko show karta hai. Is pattern ke jariye traders ko market sentiment aur price action ke bare mein important insights milti hain.

              2. Falling Window Ki Pehchan

              Falling window pattern ki pehchan gap se hoti hai jo do candlesticks ke darmiyan nazar aata hai. Yahan par pehli candlestick ki closing price dusri candlestick ki opening price se ooper hoti hai, aur dusri candlestick ki opening price pehli candlestick ki closing price se nichli hoti hai.

              Is pattern ki pehchan karne ke liye, traders ko chart par focus rakhna zaroori hai jahan par ek clear gap nazar aaye. Ye gap downward direction mein hota hai aur price action ke sudden change ko indicate karta hai.

              3. Candlestick Ka Tareeqa-e-Kar

              Falling window pattern mein candlesticks ka tareeqa-e-kar bearish hota hai. Yani ke pehli candlestick ki closing price dusri candlestick ki opening price se ooper hoti hai aur dusri candlestick ki opening price pehli candlestick ki closing price se nichli hoti hai.

              Candlestick ka tareeqa-e-kar samajhne se traders ko ye pata chalta hai ke market mein selling pressure hai jo downward trend ko indicate karta hai. Is tareeqe se candlesticks ki movement ko analyze kar ke traders apne trading decisions ko better bana sakte hain.

              4. Is Pattern Ki Muddat

              Falling window pattern ko mukhtalif time frames par dekha ja sakta hai, jaise ke short-term, medium-term, aur long-term charts. Har time frame par is pattern ki duration alag ho sakti hai.

              Is pattern ki muddat ko samajhna traders ke liye zaroori hai takay woh apne trading strategies ko sahi time frame par implement kar sakein. Short-term traders ko choti muddat par focus rakhna hoga jab ke long-term traders ko zyada duration par nazar rakhna hoga.

              5. Is Pattern Ki Dastaras

              Falling window pattern ko confirm karne ke liye trading volume ka bhi dastaras hota hai. Jab ye pattern form hota hai to volume usually increase hota hai, jo downward movement ko confirm karta hai.

              Is dastaras ke zariye traders ko ye pata chalta hai ke falling window pattern ke sath associated volume ka role kya hota hai. High volume ke sath gap hone par is pattern ki reliability aur strong signal hone ki possibility zyada hoti hai.

              6. Falling Window Candlestick Pattern Mein Trading Ki Strategy

              Falling window pattern ko confirm karne ke baad traders ko sahi trading strategy banani chahiye. Ismein price action aur volume ki analysis zaroori hoti hai saath hi previous support aur resistance levels ka bhi dhyan rakhna chahiye.

              Trading strategy banate waqt traders ko entry points aur exit points ko define karna zaroori hai sath hi risk management ke liye stop loss aur take profit levels bhi set karna zaroori hai. Yeh sab factors mil kar ek successful trading strategy ko banate hain.

              7. Entry Point Ke Liye Is Pattern Ka Istemal

              Falling window pattern ko entry point ke liye istemal karne se pehle traders ko gap ke neeche breakout hone ki confirmation ke liye wait karna chahiye. Iske ilawa, volume ki confirmation bhi zaroori hai ta ke traders ko sahi time par entry karne ka faisla karne mein madad mile.

              Entry point ke tareeqe ko samajhne se traders ko market ke dynamics aur price movement ko samajhne mein madad milti hai. Sahi entry point par enter hona traders ke liye profit maximization aur risk minimization ka ek important factor hai.

              8. Stop Loss Aur Take Profit Ki Tehqiq

              Stop loss aur take profit levels ko set karte waqt traders ko previous support aur resistance levels ka bhi istemal karna chahiye. Is tareeqe se traders apne positions ko protect kar sakte hain aur profit maximization ko achieve kar sakte hain.

              Stop loss aur take profit levels ko set karte waqt risk management ka bhi khayal rakhna zaroori hai. Is tareeqe se traders apne trades ko control kar sakte hain aur consistent profitability ko maintain kar sakte hain.

              9. Technical Indicators Ka Istemal

              Falling window pattern ko confirm karne ke liye traders technical indicators ka bhi istemal kar sakte hain. Jaise ke moving averages, RSI, aur MACD jaise indicators ko analyze kar ke traders apne trading decisions ko support kar sakte hain.

              Technical indicators ke istemal se traders ko market trends aur price movement ke bare mein advanced signals milte hain. Is tareeqe se traders apne analysis ko refine kar sakte hain aur better trading decisions ko make kar sakte hain.

              10. Is Pattern Ki Mukhtalif Rawayat

              Falling window pattern ki mukhtalif rawayat dekhne ke liye traders ko mukhtalif time frames par is pattern ko analyze karna chahiye. Har time frame par is pattern ki rawayat alag ho sakti hai jo traders ko market ke different aspects ko samajhne mein madad deti hai.

              Short-term traders ke liye choti muddat par focus rakhna zaroori hai jab ke long-term traders ko zyada duration par nazar rakhna hota hai. Is tareeqe se traders ko market ke behavior ko samajhne mein asani hoti hai aur better trading decisions ko make karne mein madad milti hai.

              11. Risk Management Ki Ahmiyat

              Har trade mein risk management ka ahmiyat hai. Falling window pattern ko samajhne ke baad traders ko apne positions ko protect karne ke liye sahi risk management strategies ko adopt karna chahiye.

              Risk management ke strategies ko implement karne se traders apne losses ko minimize kar sakte hain aur apne profits ko maximize kar sakte hain. Is tareeqe se traders apne trading career mein long-term success ko achieve kar sakte hain.

              12. Psychological Aspects

              Trader ki psychological mindset bhi is pattern ko samajhne aur us par trading karne mein ahmiyat rakhti hai. Fear aur greed ko control karna aur emotional decisions se bachna bhi successful trading ke liye zaroori hai.

              Trader ki psychological aspects ko samajhne se traders apne decisions ko rationalize kar sakte hain aur market ke movements ke sath adapt ho sakte hain. Is tareeqe se traders apne trading performance ko improve kar sakte hain aur consistent profitability ko achieve kar sakte hain.

              13. Chart Analysis Mein Falling Window Pattern

              Falling window pattern ko chart analysis ke through samajhna zaroori hai. Is tareeqe se traders ko market trends aur price action ke bare mein detailed insights milte hain jo unko sahi trading decisions ko make karne mein madad dete hain.

              Chart analysis ke jariye traders apne technical analysis ko refine kar sakte hain aur market ke dynamics ko samajhne mein asani hoti hai. Is tareeqe se traders apne trading strategies ko improve kar sakte hain aur better trading performance ko achieve kar sakte hain.

              14. Real-Life Examples

              Real-life examples se traders ko falling window pattern ko aur behtar samajhne mein madad milti hai. Past market trends aur current market scenarios ko analyze kar ke traders apne trading strategies ko refine kar sakte hain aur market ke movements ko better predict kar sakte hain.

              Real-life examples ke through traders ko practical insights milte hain jo unko market ke real-time behavior ko samajhne mein madad dete hain. Is tareeqe se traders apne analysis ko validate kar sakte hain aur successful trading decisions ko make kar sakte hain.

              15. Pattern Ko Confirm Karne Ka Tareeqa

              Falling window pattern ko confirm karne ke liye traders ko multiple time frame analysis ka istemal karna chahiye. Different time frames par is pattern ko analyze kar ke traders ko strong confirmation milta hai ke market mein downward trend hai.

              Multiple time frame analysis ke jariye traders ko market ke different perspectives ko samajhne mein madad milti hai. Is tareeqe se traders apne trading decisions ko validate kar sakte hain aur market ke movements ko sahi tareeqe se predict kar sakte hain.

              16. Economic Factors Ka Asar

              Economic factors aur market news bhi falling window pattern par asar dal sakte hain. Is tareeqe se traders ko market fundamentals ko samajhne aur unke impact ko analyze karne mein madad milti hai.

              Economic factors ke jariye traders ko market ke broader aspects ko samajhne mein asani hoti hai aur unko market ke upcoming trends ko predict karne mein madad milti hai. Is tareeqe se traders apne trading decisions ko strengthen kar sakte hain aur consistent profitability ko achieve kar sakte hain.

              17. Falling Window Pattern Ke Nuqsanat

              Falling window pattern ke sath associated risks aur nuqsanat ko samajhna bhi zaroori hai. Is pattern ke false signals ya volatile market conditions ke impact ko analyze kar ke traders apne risk management strategies ko improve kar sakte hain.

              Nuqsanat ko samajhne se traders ko apne trading strategies ko refine karne aur market ke changing conditions ke sath adjust karne mein madad milti hai. Is tareeqe se traders apne trading performance ko enhance kar sakte hain aur consistent profitability ko achieve kar sakte hain.

              18. Educational Resources

              Educational resources aur forex trading courses se traders ko falling window pattern ko samajhne aur us par trading karne mein madad milti hai. Is tareeqe se traders apne knowledge ko expand kar sakte hain aur market ke dynamics ko samajhne mein asani hoti hai.

              Educational resources ke through traders ko practical insights aur trading strategies ko implement karne ke tips milte hain. Is tareeqe se traders apne trading skills ko improve kar sakte hain aur successful trading career ko build kar sakte hain.

              19. Conclusion

              Falling window candlestick chart pattern forex trading mein ek important tool hai jo bearish trends ko identify karne aur trading strategies ko improve karne mein madad deta hai. Traders ko is pattern ko samajhna aur sahi tareeqe se istemal karna zaroori hai takay woh consistent aur successful trading achieve kar sakein.

              Conclusion mein, falling window pattern ki mukhtalif aspects aur uske importance ko highlight kiya gaya hai. Is pattern ko samajh kar traders apne trading decisions ko better bana sakte hain aur market ke movements ko sahi tareeqe se predict kar sakte hain. Successful trading ke liye, falling window pattern ka sahi tareeqe se istemal karna traders ke liye zaroori hai.

              This expanded version covers each heading in more detail, providing a comprehensive guide to understanding and trading the falling window candlestick chart pattern in forex markets.
              • #8 Collapse

                Falling Window Candlestick Chart Pattern

                Falling Window, jo ki ek candlestick chart pattern hai, market analysis mein important hota hai aur traders ke liye price action ka crucial indicator hai. Is pattern ko gap-down window ya gap-down chart pattern bhi kaha jata hai, jisme ek price gap down ke baad dikhta hai, usually ek trading session ke beech.

                Formation:

                Falling Window pattern mein formation kuch is tarah hoti hai:
                1. Previous Candlestick: Pehla candle bullish ya bearish ho sakta hai, lekin next candle gap-down open karta hai pehle candle ke closing price ke neeche.
                2. Gap-Down: Gap-down open ka arth hota hai ki market mein sudden price drop hua hai, jisse ek clear gap previous candle ke closing price se dikhta hai.

                Significance:

                Falling Window pattern indicate karta hai ki market sentiment mein sudden shift hua hai aur ek momentum change ki possibility hai. Yeh pattern traders ko upcoming price movements ke baare mein alert karta hai, especially bearish trend ke onset ke indication ke liye.

                Trading Strategy:

                Traders Falling Window pattern ko trading strategy mein integrate karne ke liye different approaches use karte hain:
                1. Confirmation: Is pattern ko confirm karne ke liye additional technical indicators jaise ki volume analysis aur price action patterns ka istemal kiya jata hai.
                2. Entry Points: Agar Falling Window bearish trend ke indication deta hai, traders sell positions enter kar sakte hain ya phir existing short positions ko strengthen kar sakte hain.
                3. Risk Management: Har trading decision ke saath risk management zaroori hai, jisme stop-loss levels aur profit targets set karne ke liye technical analysis ka istemal hota hai.

                Conclusion:

                Falling Window pattern ek important tool hai jo traders ko market ke sudden price movements aur potential reversals ke baare mein alert karta hai. Is pattern ko samajhna aur recognize karna traders ke liye beneficial hota hai kyunki isse wo market dynamics ko better understand kar sakte hain aur trading strategies ko improve kar sakte hain.

                Lekin hamesha yaad rahe ki har ek trading decision thorough analysis, technical knowledge, aur risk management ke saath liya jana chahiye. Falling Window pattern ka sahi istemal karke traders apne trading skills ko enhance kar sakte hain aur consistent trading success achieve kar sakte hain.
                • #9 Collapse

                  Falling Window Candlestick Chart Pattern: Aasan Samajh Aur Istemal Karne Wala Tareeqa

                  Falling Window, jo ke gap down window ya gap window bhi kaha jata hai, ek mukhtalif aur mufeed candlestick chart pattern hai jo technical analysis mein istemal hota hai. Is pattern ko samajhna aur istemal karna traders ke liye zaroori hai ta ke woh market ke future movements ko predict kar sakein.

                  Falling Window Candlestick Pattern Kya Hai?

                  Falling Window pattern ek bearish continuation pattern hai jo ek downward trend ke dauran dikhai deta hai. Is pattern mein ek 'gap' hota hai price charts par, jahan par ek candlestick ki opening price pichli candlestick ki closing price se nichay hoti hai. Yeh gap price range mein hota hai aur is se indicate hota hai ke market mein sudden selling pressure ya bearish momentum hai.

                  Falling Window Pattern Ka Tashreeh
                  1. Gap Down: Falling Window pattern mein ek gap down hota hai, jahan par current candlestick ki opening price pichli candlestick ki closing price se nichay hoti hai. Yeh gap normal trading range se bahar hota hai.
                  2. Volume: Is pattern ke saath saath volume ki bhi zaroori hai. Agar gap down high volume ke saath hota hai, to yeh indicate karta hai ke market mein strong selling pressure hai.
                  3. Bearish Signal: Falling Window pattern bearish continuation pattern hai, is ka matlab hai ke jab yeh pattern form hota hai to is se samjha jata hai ke bearish trend continue hone ka zyada chance hai.

                  Falling Window Pattern Ka Istemal Kaise Karein?

                  Falling Window pattern ko samajhne aur istemal karne ke liye kuch zaroori points hain:
                  1. Confirmation: Pattern ko confirm karne ke liye traders ko dusri technical indicators aur price action ko bhi dekhein. Jaise ke volume, aur dusre candlestick patterns.
                  2. Stop-loss aur Entry Points: Is pattern ke istemal mein traders ko stop-loss aur entry points ko clearly define karna zaroori hai ta ke risk ko minimize kiya ja sake.
                  3. Trend Ke Saath Trading: Falling Window pattern bearish trend ke saath usually milta hai, is liye traders ko trend ke mutabiq trading karni chahiye.
                  4. Risk Management: Har trade mein risk management zaroori hai. Stop-loss orders ka istemal kar ke nuqsanat ko kam kiya ja sakta hai.

                  Falling Window Pattern Ke Faide

                  Falling Window pattern ke istemal se traders ko kuch faide hote hain:
                  1. Clear Signal: Is pattern ke formation se traders ko clear bearish signal milta hai, jo unko market direction ko samajhne mein madad deta hai.
                  2. Entry Points: Pattern ke formation ke baad entry points ko define karna aasan ho jata hai, jo ke traders ko faiday pohanchane mein madad karta hai.
                  3. Volume Confirmation: Pattern ke saath volume ka bhi dehan dena zaroori hai, jo ke pattern ke validity ko confirm karta hai.

                  Falling Window Pattern Mein Khatra

                  Falling Window pattern ke istemal mein kuch khatre bhi hote hain:
                  1. False Signals: Kabhi kabhi yeh pattern false signals bhi de sakta hai, is liye dusri technical analysis techniques ka istemal bhi zaroori hai.
                  2. Market Volatility: Agar market mein zyada volatility hai to pattern ki validity pe asar pad sakta hai.
                  3. Over-reliance: Sirf ek pattern par zyada rely karna bhi risky ho sakta hai, is liye aur indicators aur analysis techniques ka bhi istemal karna zaroori hai.

                  Nateeja

                  Falling Window pattern ek mufeed tool hai bearish trends ko identify karne aur trading decisions lene ke liye. Is pattern ko samajhne ke liye traders ko market ke dynamics ko acche se samajhna zaroori hai aur sahi tareeqe se use karna chahiye. Is pattern ke saath risk management ko bhi dhyan mein rakhna zaroori hai ta ke traders apne trades ko effectively manage kar sakein.
                  • #10 Collapse

                    Window Candlestick Chart Pattern Mein Girawat:

                    Window candlestick chart pattern technical analysis mein ek important pattern hai jo traders aur investors ke liye significant hai. Is pattern ko samajhna aur istemal karna market trends ko predict karne mein madad karta hai.

                    Window candlestick chart pattern ek reversal pattern hai jo typically bullish ya bearish trend ke baad dikhta hai. Is pattern ko samajhne ke liye, candlestick charts ke basic principles par gaur karna zaroori hai. Candlestick charts mein har candle ek specific time period ko represent karta hai aur us time period ke during market behavior ko illustrate karta hai.

                    Pattern Ki Pehchan:

                    Window candlestick pattern mein, ek "window" ya "gap" hota hai jo ek candlestick ke baad dusre candlestick mein dikhta hai. Agar yeh gap upar ki taraf hota hai, toh isse "bullish window" kehte hain aur yeh typically bullish reversal signal deta hai. Yadi gap neeche ki taraf hota hai, toh isse "bearish window" kehte hain aur yeh bearish reversal ka indication deta hai.

                    Kyun Important Hai:

                    Window candlestick pattern ki importance usmein hai ki yeh market sentiment ka sudden change dikhata hai. Jab ek window candlestick pattern form hota hai, toh yeh indicate karta hai ki market ka trend possibly reverse hone wala hai. Isliye, traders aur investors is pattern ko closely monitor karte hain taaki wo market ke next moves ko anticipate kar sakein.

                    Pattern Ki Confirmation:

                    Window candlestick pattern ki confirmation ke liye, traders usually doosre technical indicators jaise ki volume analysis, moving averages, aur price action patterns ko bhi consider karte hain. Isse pattern ki authenticity aur strength ko validate kiya jata hai.

                    Case Studies Aur Examples:

                    Window candlestick patterns ke kai examples market history mein available hain jo iske effectiveness ko illustrate karte hain. For example, ek bullish trend ke baad ek bullish window pattern dikhai de raha ho, toh yeh ek potential buy signal ho sakta hai. Waise hi, bearish trend ke baad ek bearish window pattern ko dekhna bearish trend continuation ka sign ho sakta hai.

                    Pattern Ka Istemal:

                    Traders window candlestick patterns ko trading decisions mein incorporate karte hain. Yeh pattern short-term aur medium-term traders ke liye bhi useful hota hai jo market ke quick reversals ko capture karna chahte hain.

                    Conclusion:

                    Window candlestick pattern ek powerful technical analysis tool hai jo traders ko market trends ko samajhne aur predict karne mein madad karta hai. Iske through, market sentiment ka sudden change identify kiya ja sakta hai jo trading strategies ko enhance karta hai. Isliye, har trader ko candlestick charts ke patterns ko samajhna aur unhe effectively use karna zaroori hai taaki wo successful trading decisions le sakein.

                    Is post mein humne window candlestick chart pattern ke bare mein overview diya hai aur iske importance aur istemal ko highlight kiya hai. Agar aap ek trader ya investor hain, toh yeh pattern aapke trading approach ko improve karne mein madadgar sabit ho sakta hai.
                    • #11 Collapse

                      Falling Window Candlestick Chart Pattern
                      Click image for larger version

Name:	download (3).png
Views:	9
Size:	4.9 کلوبائٹ
ID:	13030712

                      Falling Window Candlestick Chart Pattern aik technical analysis ka concept hai jo traders aur investors ko market ke price movements ko samajhne mein madad deta hai. Yeh pattern khas tor par Japanese candlestick charting method mein use hota hai, jo ke centuries se technical analysis mein istimal hota aa raha hai. Is pattern ka main focus price gaps par hota hai jo downtrend ke doran bantay hain. Is article mein hum detail se samjhenge ke Falling Window Candlestick Chart Pattern kya hai, iska kaise use hota hai, aur traders isko apne trading decisions mein kaise shamil karte hain.
                      Falling Window Pattern Kya Hai?


                      Falling Window Candlestick Pattern tab banta hai jab ek candle ke low aur agli candle ke high ke darmiyan ek price gap hota hai. Yeh gap dikhata hai ke market mein selling pressure zyada hai aur prices rapidly neeche gir rahi hain. Is pattern ka naam "Falling Window" isliye rakha gaya hai kyunki yeh aisa lagta hai jaise window gir rahi ho.
                      Pattern Ki Pehchaan


                      Is pattern ko pehchanne ke liye do consecutive candles ki zarurat hoti hai. Pehli candle bearish (red) hoti hai, jo ke selling pressure ko dikhati hai. Dusri candle bhi bearish hoti hai, lekin iska opening price pehli candle ke closing price se neeche hota hai, aur yeh neeche ki taraf ek gap chhodta hai. Yeh gap falling window kehlata hai.
                      Example


                      Agar ek stock ka price pehli candle mein 100 se 95 tak girta hai, aur agle din dusri candle 93 par open hoti hai aur 90 par close hoti hai, to 95 aur 93 ke darmiyan jo gap hota hai, woh falling window kehlata hai.
                      Is Pattern Ka Importance


                      Falling Window Pattern ka importance yeh hai ke yeh downtrend ko confirm karta hai. Jab market mein continuous falling windows dekhi jati hain, to yeh is baat ka indication hoti hai ke selling pressure bohot zyada hai aur buyers weak hain. Yeh pattern traders ko warn karta hai ke market aur neeche ja sakti hai, aur yeh unhe short selling ya phir exiting long positions ka signal de sakta hai.
                      Trading Strategy


                      Falling Window Pattern ko dekhte hue traders apni trading strategy ko modify karte hain. Kuch important strategies jo is pattern ke saath use ki jati hain wo yeh hain:
                      1. Short Selling: Jab ek falling window dekhi jati hai, to yeh short selling ka ek acha signal hota hai. Traders is pattern ke baad stock ko short sell karte hain aur downtrend se faida uthate hain.
                      2. Stop Loss Placement: Is pattern ko dekh kar traders apne stop loss levels ko adjust karte hain. Falling window ke upar ek stop loss place karna logical hota hai, taake agar market reverse ho to losses minimize ho sakein.
                      3. Confirmation Indicators: Falling window ko confirm karne ke liye aur indicators bhi use kiye ja sakte hain jaise ke moving averages, volume analysis, aur relative strength index (RSI). Yeh indicators pattern ki strength ko confirm karne mein madadgar hote hain.
                      Risk Management


                      Falling Window Pattern ko trade karte waqt risk management bohot zaruri hai. Kyunki yeh pattern strong downtrend ko dikhata hai, lekin market kabhi bhi reverse ho sakti hai. Isliye proper risk management strategies jaise ke stop loss aur position sizing ka use bohot zaruri hai.
                      Pattern Ki Limitations


                      Jab ke Falling Window Pattern bohot useful ho sakta hai, lekin iski kuch limitations bhi hain. Har pattern ki tarah yeh bhi 100% accurate nahi hota. Kabhi kabhi market unexpected news ya events ki wajah se reverse ho sakti hai, jo ke falling window pattern ko invalid kar sakti hai. Isliye hamesha multiple indicators aur analysis methods ko use karna chahiye taake zyada accurate trading decisions liye ja saken.
                      Conclusion


                      Falling Window Candlestick Chart Pattern ek powerful tool hai jo traders ko market ke bearish trends ko pehchanne mein madad karta hai. Yeh pattern simple hone ke bawajood trading decisions mein bohot effective ho sakta hai, agar isko sahi tarike se use kiya jaye. Is pattern ka use karte waqt hamesha risk management aur confirmation indicators ko shamil karna chahiye taake trading decisions zyada reliable aur profitable ho sakain. Traders jo is pattern ko samajh kar use karte hain, wo market ke bearish phases se bhi faida utha sakte hain aur apne portfolios ko loss se bacha sakte hain
                      • <a href="https://www.instaforex.org/ru/?x=ruforum">InstaForex</a>
                      • #12 Collapse

                        ### Falling Window Candlestick Chart Pattern
                        Falling window candlestick chart pattern ek significant reversal signal hai jo traders ko market ki bearish momentum ko samajhne mein madad karta hai. Yeh pattern tab banta hai jab ek bearish candlestick ke baad agla candlestick usse lower price level par khulta hai, bina kisi overlap ke. Is pattern ko gap down movement ke tor par bhi jaana jata hai, jo traders ke liye important trading signals provide karta hai.

                        Falling window pattern ko samajhne ke liye, pehle gap ka concept samajhna zaroori hai. Jab price ek candlestick ke close hone ke baad agle candlestick ke open hone par pehle se lower level par khulti hai, to yeh falling window ka signal hota hai. Yeh pattern aksar strong selling pressure ko darshata hai, jahan market mein sellers dominate karte hain.

                        Is pattern ke formation ke liye, pehle ek bearish candlestick banti hai jo market ki girawat ko indicate karti hai. Phir jab agla candlestick bina kisi overlap ke lower price level par khulta hai, to yeh signal hota hai ke market mein aur bhi girawat ki sambhavna hai. Traders is waqt apne sell positions ko open kar sakte hain, kyunki yeh bearish trend ki continuation ka indication hai.

                        Falling window pattern ka ek important aspect yeh hai ke yeh volume ke saath confirm hota hai. Agar second candlestick ke saath high volume hai, to yeh signal strong hota hai ke sellers market par control rakh rahe hain. Isliye, volume ka analysis karna zaroori hai taake aapki trading decisions ki effectiveness barh sake.

                        Is pattern ko identify karte waqt, traders ko stop-loss orders set karna chahiye. Yeh aapko potential losses se bacha sakta hai agar market aapki expected direction mein nahi chalti. Aam tor par, falling window pattern short-term trading strategies mein use hota hai, lekin iska analysis long-term trends ke liye bhi kiya ja sakta hai.

                        Falling window pattern ko dusre technical indicators ke saath combine karna behtar hota hai. Aap moving averages, RSI, ya MACD ka istemal karke is pattern ki strength ko confirm kar sakte hain. Is combination se aapko behtar trading opportunities mil sakti hain.

                        Aakhir mein, falling window candlestick pattern ek effective tool hai jo traders ko market ke bearish trends ko samajhne aur capitalize karne mein madad karta hai. Agar aap trading mein serious hain, to is pattern ko apne toolkit mein shamil karna aapki trading strategies ko enhance kar sakta hai. Isliye, is pattern ki practice karein aur apne trading skills ko behtar banane par ghor karein.

                        اب آن لائن

                        Working...
                        X