INTRODUCTION:
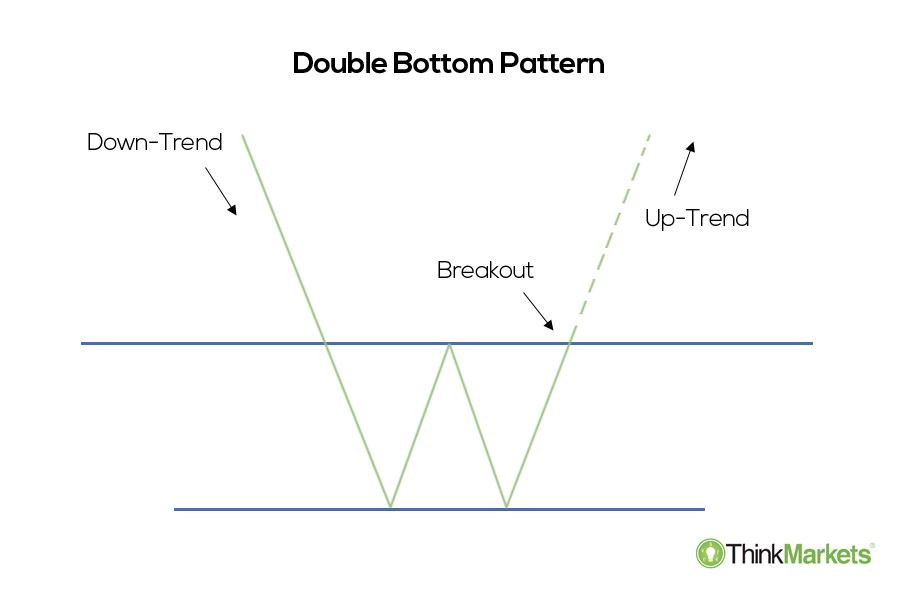
Double bottom chart pattern ak important technical analysis of traders patterns k through using hote hai.double bottom W shape hoti hai.aur indicates a bearish trend reversal ki nishandahi karta hai. Double bottom chart pattern ak Bullish Reversal Pattern hai jab yeh apny support point ko tor deta hain to Double Bottom ka signal confirmation samjha jata hai. Tab ham apni trding ky liye isi point par aik achi entry laga sakty hain. Jo keh hamary order ko profit deti hai. double top bottom bearish reversal trend ka signal ke indication dyta hai. Double top bottom down trend ko badal dayta hai ky resistance level par gap ke tasdeq karny ke bejay double top 2 high points kay darmean key supports lows par hota hai.
Meaning of Double Bottom Chart Pattern:
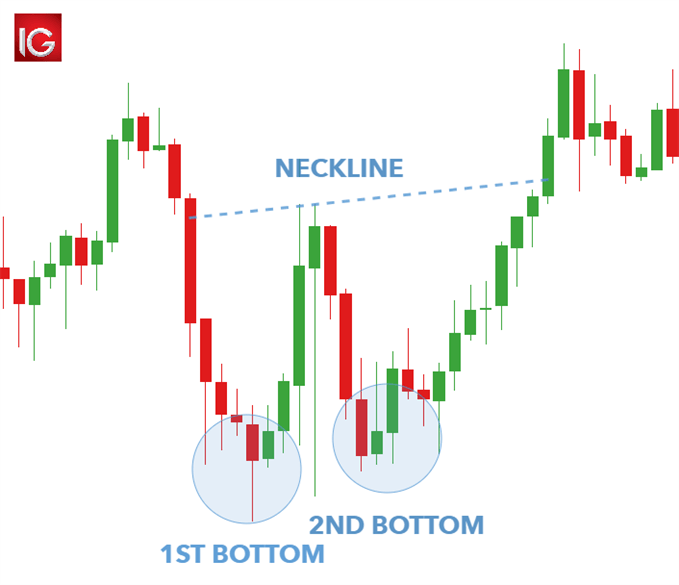
Double bottom chart pattern bahut jyada popular hai trader mai yeh indicate card hai jis sy yeh kafi maqbool hai humy apni trading mai use karna chahie. Double bottom chart pattern ke two different kism hoti hai ak jaise ho aur alag hokar niche ki taraf signal deta ho aur second bottom ke between fasla ek jaisa hona chahie stay price level ka confirmation pata hona chahie double bottom bull ke support ke liye dusre technical indicator ka use karna chahie jaise ki moving average aur usi later hai strong trend ke against trading nahe karni chawey.
Double bottom chart pattern:
Forex trading mai ak full benefits hasil ho sagta hai agar learning nahe hai tu kamyabi bhe nahe hai agar kamyabi hasil karna hai tu apni learning ko strong kare double bottom pattern mai hard work karna hoga jaab tak forex mai koi best learning nhe hoti hai tu kamyabi nahe hoti hai double bottom pattern mai candle ko bhe check karna hota hai demand and supply ko b check karna must hai.
Double bottom chart pattern ak important technical analysis of traders patterns k through using hote hai.double bottom W shape hoti hai.aur indicates a bearish trend reversal ki nishandahi karta hai. Double bottom chart pattern ak Bullish Reversal Pattern hai jab yeh apny support point ko tor deta hain to Double Bottom ka signal confirmation samjha jata hai. Tab ham apni trding ky liye isi point par aik achi entry laga sakty hain. Jo keh hamary order ko profit deti hai. double top bottom bearish reversal trend ka signal ke indication dyta hai. Double top bottom down trend ko badal dayta hai ky resistance level par gap ke tasdeq karny ke bejay double top 2 high points kay darmean key supports lows par hota hai.
Meaning of Double Bottom Chart Pattern:
Double bottom chart pattern bahut jyada popular hai trader mai yeh indicate card hai jis sy yeh kafi maqbool hai humy apni trading mai use karna chahie. Double bottom chart pattern ke two different kism hoti hai ak jaise ho aur alag hokar niche ki taraf signal deta ho aur second bottom ke between fasla ek jaisa hona chahie stay price level ka confirmation pata hona chahie double bottom bull ke support ke liye dusre technical indicator ka use karna chahie jaise ki moving average aur usi later hai strong trend ke against trading nahe karni chawey.
Double bottom chart pattern:
Forex trading mai ak full benefits hasil ho sagta hai agar learning nahe hai tu kamyabi bhe nahe hai agar kamyabi hasil karna hai tu apni learning ko strong kare double bottom pattern mai hard work karna hoga jaab tak forex mai koi best learning nhe hoti hai tu kamyabi nahe hoti hai double bottom pattern mai candle ko bhe check karna hota hai demand and supply ko b check karna must hai.
تبصرہ
Расширенный режим Обычный режим