Double Bottom Chart Pattern:
X
  • وقت
  • دکھائیں
Clear All
new posts
  • #1 Collapse

    Double Bottom Chart Pattern:
    INTRODUCTION:


    Double bottom chart pattern ak important technical analysis of traders patterns k through using hote hai.double bottom W shape hoti hai.aur indicates a bearish trend reversal ki nishandahi karta hai. Double bottom chart pattern ak Bullish Reversal Pattern hai jab yeh apny support point ko tor deta hain to Double Bottom ka signal confirmation samjha jata hai. Tab ham apni trding ky liye isi point par aik achi entry laga sakty hain. Jo keh hamary order ko profit deti hai. double top bottom bearish reversal trend ka signal ke indication dyta hai. Double top bottom down trend ko badal dayta hai ky resistance level par gap ke tasdeq karny ke bejay double top 2 high points kay darmean key supports lows par hota hai.


    Meaning of Double Bottom Chart Pattern:


    Double bottom chart pattern bahut jyada popular hai trader mai yeh indicate card hai jis sy yeh kafi maqbool hai humy apni trading mai use karna chahie. Double bottom chart pattern ke two different kism hoti hai ak jaise ho aur alag hokar niche ki taraf signal deta ho aur second bottom ke between fasla ek jaisa hona chahie stay price level ka confirmation pata hona chahie double bottom bull ke support ke liye dusre technical indicator ka use karna chahie jaise ki moving average aur usi later hai strong trend ke against trading nahe karni chawey.


    Double bottom chart pattern:


    Forex trading mai ak full benefits hasil ho sagta hai agar learning nahe hai tu kamyabi bhe nahe hai agar kamyabi hasil karna hai tu apni learning ko strong kare double bottom pattern mai hard work karna hoga jaab tak forex mai koi best learning nhe hoti hai tu kamyabi nahe hoti hai double bottom pattern mai candle ko bhe check karna hota hai demand and supply ko b check karna must hai.
  • <a href="https://www.instaforex.org/ru/?x=ruforum">InstaForex</a>
  • #2 Collapse

    Re: Double Bottom Chart Pattern:

    Double Bottom Candlestick Pattern
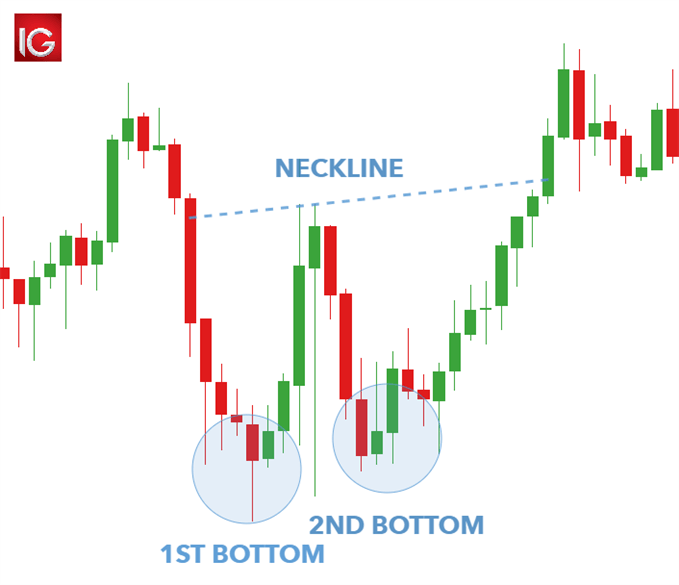
    Double Bottom Candlestick Pattern ko samajny ky liye ap ko iss bat par focus karna ho ga ky market mn 1 time par 2 same lowest points hoty hain. Jin ko market touch kar ky wapis aapis aati hai. Market ki iss position ko Double Bottom Candlestick Pattern kehty hain. Double Bottom Chart Pattern ak trend reversal pattern ha Ye pattern long bearish trend k bottom per support level per banta ha Ye pattern batata ha k sellers price ko nicha la ker jata han lakin power kam hona ki waja sa price ko hold nahe ker pata Sellers is pattern man two time price ko same level tak nicha le ker jata han lakin second bottom k bad jab price hoti ha to pher ak long bullish trend k start hona ki 50% confirmation ho jati ha Final confirmation k liye trader dono bottom k starting point ko ak trend line sa jorta ha. Is trend line ko " Neckline"" kehta han, jab price is neckline ko break kerti ha to trader ko long bullish trend ki 100 % confirmation ho jati ha
    Click image for larger version

Name:	download (2).png
Views:	2
Size:	9.4 کلوبائٹ
ID:	12431638
    Double Bottom Pattern Ki Jankari Kaisy Karen
    Double Bottom pattern ko market ma hum pahly bhe discuss kr chuky hain k is pettern ko hum is ki shape ki wja sy W pettern the kahty hain tw is hisab sy kisi the trader k leay double bottom pettern ko smjhna asaan hota ha ye pettern ek lmby downtrend k bad bnta ha or is pettern ma hmesha 2 bottom bnta hain or in bottom k drmian km uz kum 7 sy 8 candles ka distance hona chaheay tb he hum in ko double bottom pettern kahty hain agr wo distence 3 ya 4 candles ka ho ga tw wo double bottom candlestick pettern nhn ho ga.
    Click image for larger version

Name:	download.png
Views:	15
Size:	7.5 کلوبائٹ
ID:	12431639
    Double Bottom Pattern Ki Tafseel
    Double bottom chart pattern k baray mein thora share karu gi agr mein koi cheeze bhul jao to ap please bata sakty hai. Double top aur double bottom bohat hi famous aur simple se chart pattern hai. yeh pattern market ke present trend ko badall dety hai is liye in ko Reversal chart pattern b kaha jata hai.jb kisi b currency wegera ki price nichay ki taraf ja kr uper ay jaye aur phir dobara nichay ki taraf jaye magar phelay wali kam price se nicay na jaye bulke phelay wali kam price se wapas aye is ko double bottom khety hai. jisay nicay walay chart mein dhekhay ke ek dafa market nichay ki taraf gai jis ko hum bottom khety hai phir uper ayi aur dobara nichay gai bottom 2 tak is k bd market phir uper ki taraf ayi. dono bottom ko mila kr hum double double kahaye gay. aur aisi surat mein market uper jaye gi yani double bottom ki surat mein buy krna chaiye aur agr sell kia ho to trade close kr de.
    Click image for larger version

Name:	download (1).png
Views:	4
Size:	3.0 کلوبائٹ
ID:	12431640
    • #3 Collapse

      Re: Double Bottom Chart Pattern:

      INFORMATION:

      Double bottom chart pattern aik technical analysis chart pattern hai jo mostly hamein pechli price action ke trend aur momentum reversal ki maloomat deta hai.es pattern ki shakal letter W ki tarah hoti hai aur yeh pattern bahut dafa bottom per jata hai aur dobara up ja kar phir bottom per chla jata hai.jub aik hi pattern mai candle do bar aik hi bottom level se touch hoti hai tu es point ko support level kaha jata hai.yeh pattern longer time period ke liye istamal kiye jatey hai.es pattern ka opposite pattern double top chart pattern hai.

      Click image for larger version

Name:	9cab2fec-d132-4fa1-a6dd-d52f95e576c9.png
Views:	1
Size:	23.0 کلوبائٹ
ID:	12431651


      Double Bottom Chart Pattern:

      Double bottom chart pattern single rounding pattern ko follow kartey hoi banta hai.jo keh kisi bhe pattern ki potential reversal ki pehli nishani hoti hai.yeh pattern mostly aik continous bearish pattern ke end per banta hai.jis tarah hum read kar chukey hain keh es pattern ki formation down trend ke end per hoti hai.Double bottoms patterns hamesha ke liye aik makhsoos security ke douran aik ahem ya mamooli neechay ke rujhan ki pairwi karta hai, aur ulat jane aur is wajah se mumkina up trained ke aaghaz ka ishara deta hai. nateejatan, patteren ko khud safety ke liye market ke bunyadi usoolon ke mutabiq durust hona chahiye, is ke ilawa is liye ke safety jis shobay se talluq rakhti hai, aur is liye aam tor par market. bunyadi baton ko market ke halaat mein associ at degree ke mustaqbil ke ulat jane ki khususiyaat ko naqal karna chahiye. is ke ilawa, patteren ki tashkeel ke douran hajam ko qareeb se monitor kya jana chahiye. hajam mein izafah aam tor par patteren ke andar 2 oopar ki qeemat wali harkato mein hota hai. hajam mein yeh spikes oopar ki taraf maliyat ke dabao ka aik taaqatwar ishara hai aur faateh double neechay patteren ki izafi tasdeeq hai .
      Click image for larger version

Name:	0d5c5623-9f10-455b-9df4-c64583878dc4.png
Views:	2
Size:	88.9 کلوبائٹ
ID:	12431652
      • #4 Collapse

        Re: Double Bottom Chart Pattern:

        Double Bottom Chart Pattern:

        Forex Market mai double bottom tab hi banta hai jab price uper se nichey ki taraf move karne ke mood mai ajati hai aur is taraha se aik double bottom nichey se bhi banta hai jis ko hum reversal double bottom kehtey hai aur reversal double bottom us waqat banta hai jab price nichey se uper ki taraf mood mein ajati hey isliye hamen chahiye keh isko always find kartey rahen kioun keh yeh jab bhi market maibanti hey to market mein hamen aik achi trade dekhne ko mil jati hey aur hum market mai aik achi trade karne ke qabil ban saktey hai yeh ham daily basis par h1 ke chart par bhi find kr saktey hai aur uske ilawa agar hum h4 ka chart dekhen to us mai hamen weekly dekhne ko milti hey aur yeh kafi acha aur profitable pattern he isko hamen kabhi bhi miss nahin karna chahiye.

        Click image for larger version

Name:	0d5c5623-9f10-455b-9df4-c64583878dc4.png
Views:	2
Size:	88.9 کلوبائٹ
ID:	12431653


        Explanation:

        double top bottom ka indication ye hota hay key market ki M ki shakal me movement kar leti hay aur resistance level 2 times try karny key bawajood be break nahi hota aur market 1st top level ko break karny me nakam ho jaye to es ko double top pattern kaha jata hay aur jab market support level ko 2 times break na kary aur W ki shakal me movement karny key bad per se market up side me move kary to ye double bottom samja jata hay, M aur W shape me market ki movement ko double top aur bottom movement samjy jaty hey jo key technical analysis key ley bahot hi powerful tasawar key jaty hey, large time frame me agar market long period key bad M aur W shape banaye to ye yakeen key sath technical point of view se double top aur bottom pattern hi hota hay jes ko follow karna technical analysis par yakeen karny waly traders zarori samjty hey, simple words me double bottom levels strong bearish trend ka indication hota hay aur double top pattern M shape ka hota hay jo key strong bullish trend ki taraf eshara karta hay hamy es ko zaror follow karny ki kohsish karni chaye.
        Click image for larger version

Name:	bottom.png
Views:	5
Size:	20.6 کلوبائٹ
ID:	12431654
        • #5 Collapse

          Re: Double Bottom Chart Pattern:

          Presentation:

          Twofold base diagram design ak significant specialized examination of brokers designs k through utilizing hote hai.double base W shape hoti hai.aur shows a negative pattern inversion ki nishandahi karta hai. Twofold base outline design ak Bullish Inversion Example hai poke yeh apny support point ko pinnacle deta hain to Twofold Base ka signal affirmation samjha jata hai. Tab ham apni trding ky liye isi point standard aik achi passage laga sakty hain. Jo keh hamary request ko benefit deti hai. twofold top base negative inversion pattern ka signal ke sign dyta hai. Twofold top base down pattern ko badal dayta hai ky obstruction level standard hole ke tasdeq karny ke bejay twofold top 2 high focuses kay darmean key backings lows standard hota hai.

          Importance of Twofold Base Graph Example:

          Twofold base diagram design bahut jyada well known hai broker mai yeh show card hai jis sy yeh kafi maqbool hai humy apni exchanging mai use karna chahie. Twofold base outline design ke two distinct kism hoti hai ak jaise ho aur alag hokar specialty ki taraf signal deta ho aur second base ke between fasla ek jaisa hona chahie stay cost level ka affirmation pata hona chahie twofold base bull ke support ke liye dusre specialized marker ka use karna chahie jaise ki moving normal aur usi later hai solid pattern ke against exchanging nahe karni chawey.


          Twofold base diagram design:

          Forex exchanging mai ak full advantages hasil ho sagta hai agar learning nahe hai tu kamyabi bhe nahe hai agar kamyabi hasil karna hai tu apni learning major areas of strength for ko twofold base example mai difficult work karna hoga jaab tak forex mai koi best learning nhe hoti hai tu kamyabi nahe hoti hai twofold base example mai flame ko bhe check karna hota hai request and supply ko b check karna must hai.

          Twofold Base Candle Example

          Twofold Base Candle Example ko samajny ky liye ap ko iss bat standard center karna ho ga ky market mn 1 time standard 2 same bottommost extremes hoty hain. Jin ko market contact kar ky wapis aapis aati hai. Market ki iss position ko Twofold Base Candle Example kehty hain. Twofold Base Outline Example ak pattern inversion design ha Ye design long negative pattern k base per support level per banta ha Ye design batata ha k merchants cost ko nicha la ker jata han lakin power kam hona ki waja sa cost ko hold nahe ker pata Dealers is design man double cross cost ko same level tak nicha le ker jata han lakin second base k awful poke cost hoti ha to pher ak long bullish pattern k beginning hona ki half affirmation ho jati ha Last affirmation k liye broker dono base k beginning stage ko ak pattern line sa jorta ha. Is pattern line ko " Neck area"" kehta han, hit cost is neck area ko break kerti ha to broker ko long bullish pattern ki 100 % affirmation ho jati ha


          Twofold Base Example Ki Jankari Kaisy Karen

          Twofold Base example ko market mama murmur pahly bhe talk about kr chuky hain k is pettern ko murmur is ki shape ki wja sy W pettern the kahty hain tw is hisab sy kisi the broker k leay twofold base pettern ko smjhna asaan hota ha ye pettern ek lmby downtrend k awful bnta ha or is pettern mama hmesha 2 base bnta hain or in base k drmian km uz kum 7 sy 8 candles ka distance hona chaheay tb he murmur in ko twofold base pettern kahty hain agr wo distence 3 ya 4 candles ka ho ga tw wo twofold base candle pettern nhn ho ga.
          • #6 Collapse

            Re: Double Bottom Chart Pattern:

            Double Bottom Chart Pattern


            double specialized examination graph design hai jo for the most part hamein pechli cost
            activity ke pattern aur force inversion ki maloomat deta hai.es design ki
            shakal letter W ki tarah hoti hai aur yeh design bahut dafa base per
            jata hai aur dobara up ja kar phir base per chla jata hai.jub aik hello there
            design mai light bar aik hello base level se contact hoti hai tu es
            point ko support level kaha jata hai.yeh design longer time span ke
            liye istamal kiye jatey hai.es design ka inverse example twofold top
            outline design hai.


            Double Bottom Chart Patternen Formation
            bottom design and double ko follow kartey hoi banta hai.jo keh kisi bhe design ki
            potential inversion ki pehli nishani hoti hai.yeh design for the most part aik
            continous negative example ke end per banta hai.jis tarah murmur read kar
            chukey hain keh es design ki arrangement down pattern ke end per hoti
            hai.Double bottoms designs hamesha ke liye aik makhsoos security ke
            douran aik ahem ya mamooli neechay ke rujhan ki pairwi karta hai, aur
            ulat jane aur is wajah se mumkina up prepared ke aaghaz ka ishara deta
            hai. nateejatan, patteren ko khud security ke liye market ke bunyadi
            usoolon ke mutabiq durust hona chahiye, is ke ilawa is liye ke wellbeing
            jis shobay se talluq rakhti hai, aur is liye aam pinnacle standard market. bunyadi
            mallet ko market ke halaat mein associ at degree ke mustaqbil ke ulat
            jane ki khususiyaat ko naqal karna chahiye. is ke ilawa, patteren ki
            tashkeel ke douran hajam ko qareeb se screen kya jana chahiye. hajam
            mein izafah aam peak standard patteren ke andar 2 oopar ki qeemat wali harkato
            mein hota hai. hajam mein yeh spikes oopar ki taraf maliyat ke dabao ka
            aik taaqatwar ishara hai aur faateh twofold neechay patteren ki izafi
            tasdeeq hai .


            Double bottom ki all detail yahan iss picture say ham asaani say hgain kaein gy
            Last edited by ; 05-11-2022, 05:21 AM.
            • #7 Collapse

              Re: Double Bottom Chart Pattern:

              اصل پيغام ارسال کردہ از: Kainatkhan پيغام ديکھيے
              INTRODUCTION:


              Double bottom chart pattern ak important technical analysis of traders patterns k through using hote hai.double bottom W shape hoti hai.aur indicates a bearish trend reversal ki nishandahi karta hai. Double bottom chart pattern ak Bullish Reversal Pattern hai jab yeh apny support point ko tor deta hain to Double Bottom ka signal confirmation samjha jata hai. Tab ham apni trding ky liye isi point par aik achi entry laga sakty hain. Jo keh hamary order ko profit deti hai. double top bottom bearish reversal trend ka signal ke indication dyta hai. Double top bottom down trend ko badal dayta hai ky resistance level par gap ke tasdeq karny ke bejay double top 2 high points kay darmean key supports lows par hota hai.


              Meaning of Double Bottom Chart Pattern:


              Double bottom chart pattern bahut jyada popular hai trader mai yeh indicate card hai jis sy yeh kafi maqbool hai humy apni trading mai use karna chahie. Double bottom chart pattern ke two different kism hoti hai ak jaise ho aur alag hokar niche ki taraf signal deta ho aur second bottom ke between fasla ek jaisa hona chahie stay price level ka confirmation pata hona chahie double bottom bull ke support ke liye dusre technical indicator ka use karna chahie jaise ki moving average aur usi later hai strong trend ke against trading nahe karni chawey.


              Double bottom chart pattern:


              Forex trading mai ak full benefits hasil ho sagta hai agar learning nahe hai tu kamyabi bhe nahe hai agar kamyabi hasil karna hai tu apni learning ko strong kare double bottom pattern mai hard work karna hoga jaab tak forex mai koi best learning nhe hoti hai tu kamyabi nahe hoti hai double bottom pattern mai candle ko bhe check karna hota hai demand and supply ko b check karna must hai.
              Dear friend Jab Ham is market Mein double bottom chart pattern Ki Baat Karte Hain To Hamen is market Mein Kafi Jyada fayda Hota Hai Jab Ham is market Mein acche tarike se kam karte hain Hamen is market Mein Achcha kam karne ke liye pattern ke bare mein pata Hona chahie.
              • #8 Collapse

                Re: Double Bottom Chart Pattern:

                اصل پيغام ارسال کردہ از: Kainatkhan پيغام ديکھيے
                INTRODUCTION:


                Double bottom chart pattern ak important technical analysis of traders patterns k through using hote hai.double bottom W shape hoti hai.aur indicates a bearish trend reversal ki nishandahi karta hai. Double bottom chart pattern ak Bullish Reversal Pattern hai jab yeh apny support point ko tor deta hain to Double Bottom ka signal confirmation samjha jata hai. Tab ham apni trding ky liye isi point par aik achi entry laga sakty hain. Jo keh hamary order ko profit deti hai. double top bottom bearish reversal trend ka signal ke indication dyta hai. Double top bottom down trend ko badal dayta hai ky resistance level par gap ke tasdeq karny ke bejay double top 2 high points kay darmean key supports lows par hota hai.


                Meaning of Double Bottom Chart Pattern:


                Double bottom chart pattern bahut jyada popular hai trader mai yeh indicate card hai jis sy yeh kafi maqbool hai humy apni trading mai use karna chahie. Double bottom chart pattern ke two different kism hoti hai ak jaise ho aur alag hokar niche ki taraf signal deta ho aur second bottom ke between fasla ek jaisa hona chahie stay price level ka confirmation pata hona chahie double bottom bull ke support ke liye dusre technical indicator ka use karna chahie jaise ki moving average aur usi later hai strong trend ke against trading nahe karni chawey.


                Double bottom chart pattern:


                Forex trading mai ak full benefits hasil ho sagta hai agar learning nahe hai tu kamyabi bhe nahe hai agar kamyabi hasil karna hai tu apni learning ko strong kare double bottom pattern mai hard work karna hoga jaab tak forex mai koi best learning nhe hoti hai tu kamyabi nahe hoti hai double bottom pattern mai candle ko bhe check karna hota hai demand and supply ko b check karna must hai.
                Double bottom candlestick pattern aapke liye ek important aur valuable information share karne wala platform hota hai double bottom candlestick pattern mein aapko ek aisi scenario or situation available Hoti hai jismein market ek bottom level banati hai aur kuchh duration ke bad usi point per FIR apna bottom banati hai jiski vajah se use point ko aap double bottom ke naam se jante Hain double bottom ek important aur valuable information hoti hai iski vajah se market mein aapko support level ka idea hota hai aur is support ki base per aapko market mein acchi entry mil sakti hai.
                • #9 Collapse

                  Re: Double Bottom Chart Pattern:

                  Double Bottom Candlestick Pattern ko samajny ky liye ap ko iss bat par focus karna ho ga ky market mn 1 time par 2 same lowest points hoty hain. Jin ko market touch kar ky wapis aapis aati hai. Market ki iss position ko Double Bottom Candlestick Pattern kehty hain. Double Bottom Chart Pattern ak trend reversal pattern ha Ye pattern long bearish trend k bottom per support level per banta ha Ye pattern batata ha k sellers price ko nicha la ker jata han lakin power kam hona ki waja sa price ko hold nahe ker pata Sellers is pattern man two time price ko same level tak nicha le ker jata han lakin second bottom k bad jab price hoti ha to pher ak long bullish trend k start hona ki 50% confirmation ho jati ha Final confirmation k liye trader dono bottom k starting point ko ak trend line sa jorta ha. Is trend line ko " Neckline"" kehta han, jab price is neckline ko break kerti ha to trader ko long bullish trend ki 100 % confirmation ho jati ha

                  Click image for larger version

Name:	download (11).png
Views:	34
Size:	4.3 کلوبائٹ
ID:	12432003


                  Double Bottom pattern ki jankari kaisy karin

                  Double Bottom pattern ko market ma hum pahly bhe discuss kr chuky hain k is pettern ko hum is ki shape ki wja sy W pettern the kahty hain tw is hisab sy kisi the trader k leay double bottom pettern ko smjhna asaan hota ha ye pettern ek lmby downtrend k bad bnta ha or is pettern ma hmesha 2 bottom bnta hain or in bottom k drmian km uz kum 7 sy 8 candles ka distance hona chaheay tb he hum in ko double bottom pettern kahty hain agr wo distence 3 ya 4 candles ka ho ga tw wo double bottom candlestick pettern nhn ho ga.

                  double Bottom pattern ki Tafseel

                  Double bottom chart pattern k baray mein thora share karu gi agr mein koi cheeze bhul jao to ap please bata sakty hai. Double top aur double bottom bohat hi famous aur simple se chart pattern hai. yeh pattern market ke present trend ko badall dety hai is liye in ko Reversal chart pattern b kaha jata hai.jb kisi b currency wegera ki price nichay ki taraf ja kr uper ay jaye aur phir dobara nichay ki taraf jaye magar phelay wali kam price se nicay na jaye bulke phelay wali kam price se wapas aye is ko double bottom khety hai. jisay nicay walay chart mein dhekhay ke ek dafa market nichay ki taraf gai jis ko hum bottom khety hai phir uper ayi aur dobara nichay gai bottom 2 tak is k bd market phir uper ki taraf ayi. dono bottom ko mila kr hum double double kahaye gay. aur aisi surat mein market uper jaye gi yani double bottom ki surat mein buy krna chaiye aur agr sell kia ho to trade close kr de.

                  Click image for larger version

Name:	download (10).png
Views:	2
Size:	4.9 کلوبائٹ
ID:	12432004


                  Explanation

                  double top bottom ka indication ye hota hay key market ki M ki shakal me movement kar leti hay aur resistance level 2 times try karny key bawajood be break nahi hota aur market 1st top level ko break karny me nakam ho jaye to es ko double top pattern kaha jata hay aur jab market support level ko 2 times break na kary aur W ki shakal me movement karny key bad per se market up side me move kary to ye double bottom samja jata hay, M aur W shape me market ki movement ko double top aur bottom movement samjy jaty hey jo key technical analysis key ley bahot hi powerful tasawar key jaty hey, large time frame me agar market long period key bad M aur W shape banaye to ye yakeen key sath technical point of view se double top aur bottom pattern hi hota hay jes ko follow karna technical analysis par yakeen karny waly traders zarori samjty hey, simple words me double bottom levels strong bearish trend ka indication hota hay aur double top pattern M shape ka hota hay jo key strong bullish trend ki taraf eshara karta hay hamy es ko zaror follow karny ki kohsish karni chaye.
                  • #10 Collapse

                    Re: Double Bottom Chart Pattern:

                    market 1st top level ko break karny me nakam ho jaye to es ko double top pattern kaha jata hay aur jab market support level ko 2 times break na kary aur W ki shakal me movement karny key bad per se market up side me move kary to ye double bottom samja jata hay, M aur W shape me market ki movement ko double top aur bottom movement samjy jaty hey jo key technical analysis key ley bahot hi powerful tasawar key jaty hey, large time frame me agar market long period key bad M aur W shape banaye to ye yakeen key sath technical point of view se double top aur bottom pattern hi hota hay jes ko follow karna technical analysis par yakeen karny waly traders zarori samjty hey, simple words me double bottom levels strong bearish trend ka indication hota hay aur double top pattern M shape ka hota hay jo key strong bullish trend ki taraf eshara karta hay hamy es ko zaror follow karny ki kohsish karni chaye.market touch kar ky wapis aapis aati hai. Market ki iss position ko Double Bottom Candlestick Pattern kehty hain. Double Bottom Chart Pattern ak trend reversal pattern ha Ye pattern long bearish trend k bottom per support level per banta ha Ye pattern batata ha k sellers price ko nicha la ker jata han lakin power kam hona ki waja sa price ko hold nahe ker pata Sellers is pattern man two time price ko same level tak nicha le ker jata han lakin second bottom k bad jab price hoti ha to pher ak long bullish trend k start hona ki 50% confirmation ho jati ha Final confirmation k liye trader dono bottom k starting point ko ak trend line sa jorta ha. Is trend line ko " Neckline"" kehta han, jab price is neckline ko break kerti ha to trader ko long bullish trend ki 100 % confirmation ho jati hapattern aapke liye ek important aur valuable information share karne wala platform hota hai double bottom candlestick pattern mein aapko ek aisi scenario or situation available Hoti hai jismein market ek bottom level banati hai aur kuchh duration ke bad usi point per FIR apna bottom banati hai jiski vajah se use point ko aap double bottom ke naam se jante Hain double bottom ek important aur valuable information hoti hai iski vajah se market mein aapko support level ka idea hota hai aur is support ki base per aapko market mein acchi entry mil sakti hai.

                    market ke present trend ko badall dety hai is liye in ko Reversal chart pattern b kaha jata hai.jb kisi b currency wegera ki price nichay ki taraf ja kr uper ay jaye aur phir dobara nichay ki taraf jaye magar phelay wali kam price se nicay na jaye bulke phelay wali kam price se wapas aye is ko double bottom khety hai. jisay nicay walay chart mein dhekhay ke ek dafa market nichay ki taraf gai jis ko hum bottom khety hai phir uper ayi aur dobara nichay gai bottom 2 tak is k bd market phir uper ki taraf ayi. dono bottom ko mila kr hum double double kahaye gay. aur aisi surat mein market uper jaye gi yani double bottom ki surat mein buy krna chaiye aur agr sell kia ho to trade close kr de.pettern the kahty hain tw is hisab sy kisi the trader k leay double bottom pettern ko smjhna asaan hota ha ye pettern ek lmby downtrend k bad bnta ha or is pettern ma hmesha 2 bottom bnta hain or in bottom k drmian km uz kum 7 sy 8 candles ka distance hona chaheay tb he hum in ko double bottom pettern kahty hain agr wo distence 3 ya 4 candles ka ho ga tw wo double bottom candlestick pettern nhn ho ga.Candlestick Pattern ko samajny ky liye ap ko iss bat par focus karna ho ga ky market mn 1 time par 2 same lowest points hoty hain. Jin ko market touch kar ky wapis aapis aati hai. Market ki iss position ko Double Bottom Candlestick Pattern kehty hain. Double Bottom Chart Pattern ak trend reversal pattern ha Ye pattern long bearish trend k bottom per support level per banta ha Ye pattern batata ha k sellers price ko nicha la ker jata han lakin power kam hona ki waja sa price ko hold nahe ker pata Sellers is pattern man two time price ko same level tak nicha le ker jata han lakin second bottom k bad jab price hoti ha to pher ak long bullish trend k start hona ki 50% confirmation ho jati haPattern ko samajny ky liye ap ko iss bat par focus karna ho ga ky market mn 1 time par 2 same lowest points hoty hain. Jin ko market touch kar ky wapis aapis aati hai. Market ki iss position ko Double Bottom Candlestick Pattern kehty hain. Double Bottom Chart Pattern ak trend reversal pattern ha Ye pattern long bearish trend k bottom per support level per banta ha Ye pattern batata ha k sellers price ko nicha la ker jata han lakin power kam hona ki waja sa price ko hold nahe ker pata Sellers is pattern man two time price ko same level tak nicha le ker jata han lakin second bottom k bad jab price hoti ha to pher ak long bullish trend k start hona ki 50% confirmation ho jati ha Final confirmation k liye trader dono bottom k starting point ko ak trend line sa jorta ha. Is trend line ko " Neckline"" kehta han


                    Pattern ko samajny ky liye ap ko iss bat par focus karna ho ga ky market mn 1 time par 2 same lowest points hoty hain. Jin ko market touch kar ky wapis aapis aati hai. Market ki iss position ko Double Bottom Candlestick Pattern kehty hain. Double Bottom Chart Pattern ak trend reversal pattern ha Ye pattern long bearish trend k bottom per support level per banta ha Ye pattern batata ha k sellers price ko nicha la ker jata han lakin power kam hona ki waja sa price ko hold nahe ker pata Sellers is pattern man two time price ko same level tak nicha le ker jata han lakin second bottom k bad jab price hoti ha to pher ak long bullish trend k start hona ki 50% confirmation ho jati ha Final confirmation k liye trader dono bottom k starting point ko ak trend line sa jorta ha. Is trend line ko " Neckline"" kehta han, jab price is neckline ko break kerti ha to trader ko long bullish trend ki 100 % confirmation ho jati hacandlestick pattern aapke liye ek important aur valuable information share karne wala platform hota hai double bottom candlestick pattern mein aapko ek aisi scenario or situation available Hoti hai jismein market ek bottom level banati hai aur kuchh duration ke bad usi point per FIR apna bottom banati hai jiski vajah se use point ko aap double bottom ke naam se jante Hain double bottom ek important aur valuable information hoti hai iski vajah se market mein aapko support level ka idea hota hai aur is support ki base per aapko market mein acchi entry mil sakti hai.pattern k base per support level per banta ha Ye design batata ha k merchants cost ko nicha la ker jata han lakin power kam hona ki waja sa cost ko hold nahe ker pata Dealers is design man double cross cost ko same level tak nicha le ker jata han lakin second base k awful poke cost hoti ha to pher ak long bullish pattern k beginning hona ki half affirmation ho jati ha Last affirmation k liye broker dono base k beginning stage ko ak pattern line sa jorta ha. Is pattern line ko " Neck area"" kehta han, hit cost is neck area ko break kerti ha to broker ko long bullish pattern ki 100 % affirmation ho jati haexample twofold top
                    outline design hai.


                    • #11 Collapse

                      Re: Double Bottom Chart Pattern:

                      Double Bottom Chart Pattern:
                      Candlestick Pattern ko samajny ky liye ap ko iss bat par focus karna ho ga ky market mn 1 time par 2 same lowest points hoty hain. Jin ko market touch kar ky wapis aapis aati hai. Market ki iss position ko Double Bottom Candlestick Pattern kehty hain. Double Bottom Chart Pattern ak trend reversal pattern ha Ye pattern long bearish trend k bottom per support level per banta ha Ye pattern batata ha k sellers price ko nicha la ker jata han lakin power kam hona ki waja sa price ko hold nahe ker pata Sellers is pattern man two time price ko same level tak nicha le ker jata han lakin second bottom k bad jab price hoti ha to pher ak long bullish trend k start hona ki 50% confirmation ho jati ha Final confirmation k liye trader dono bottom k starting point ko ak trend line sa jorta ha. Is trend line ko " Neckline"" kehta han, jab price is neckline ko break kerti ha to trader ko long bullish trend ki 100 % confirmation ho jati ha double bottom tab hi banta hai jab price uper se nichey ki taraf move karne ke mood mai ajati hai aur is taraha se aik double bottom nichey se bhi banta hai jis ko hum reversal double bottom kehtey hai aur reversal double bottom us waqat banta hai jab price nichey se uper ki taraf mood mein ajati hey isliye hamen chahiye keh isko always find kartey rahen kioun keh yeh jab bhi market maibanti hey to market mein hamen aik achi trade dekhne ko mil jati hey aur hum market mai aik achi trade karne ke qabil ban saktey hai yeh ham daily basis par h1 ke chart par bhi find kr saktey hai aur uske ilawa agar hum h4 ka chart dekhen to us mai hamen weekly dekhne ko milti hey aur yeh kafi acha aur profitable pattern he isko hamen kabhi bhi miss nahin karna chahiye.Double bottom chart pattern ak important technical analysis of traders patterns k through using hote hai.double bottom W shape hoti hai.aur indicates a bearish trend reversal ki nishandahi karta hai. Double bottom chart pattern ak Bullish Reversal Pattern hai jab yeh apny support point ko tor deta hain to Double Bottom ka signal confirmation samjha jata hai. Tab ham apni trding ky liye isi point par aik achi entry laga sakty hain. Jo keh hamary order ko profit deti hai. double top bottom bearish reversal trend ka signal ke indication dyta hai. Double top bottom down trend ko badal dayta hai ky resistance level par gap ke tasdeq karny ke bejay double top 2 high points kay darmean key supports lows par hota hai.Double Bottom Candlestick Pattern ko samajny ky liye ap ko iss bat par focus karna ho ga ky market mn 1 time par 2 same lowest points hoty hain. Jin ko market touch kar ky wapis aapis aati hai. Market ki iss position ko Double Bottom Candlestick Pattern kehty hain. Double Bottom Chart Pattern ak trend reversal pattern ha Ye pattern long bearish trend k bottom per support level per banta ha Ye pattern batata ha k sellers price ko nicha la ker jata han lakin power kam hona ki waja sa price ko hold nahe ker pata Sellers is pattern man two time price ko same level tak nicha le ker jata han lakin second bottom k bad jab price hoti ha to pher ak long bullish trend k start hona ki 50% confirmation ho jati ha Final confirmation k liye trader dono bottom k starting point ko ak trend line sa jorta ha. Is trend line ko " Neckline"" kehta han, jab price is neckline ko break kerti ha to trader ko long bullish trend ki 100 % confirmation ho jati ha..

                      Explanation:
                      Reversal chart pattern b kaha jata hai.jb kisi b currency wegera ki price nichay ki taraf ja kr uper ay jaye aur phir dobara nichay ki taraf jaye magar phelay wali kam price se nicay na jaye bulke phelay wali kam price se wapas aye is ko double bottom khety hai. jisay nicay walay chart mein dhekhay ke ek dafa market nichay ki taraf gai jis ko hum bottom khety hai phir uper ayi aur dobara nichay gai bottom 2 tak is k bd market phir uper ki taraf ayi. dono bottom ko mila kr hum double double kahaye gay. aur aisi surat mein market uper jaye gi yani double bottom ki surat mein buy krna chaiye aur agr sell kia ho to trade close kr de.pettern the kahty hain tw is hisab sy kisi the trader k leay double bottom pettern ko smjhna asaan hota ha ye pettern ek lmby downtrend k bad bnta ha or is pettern ma hmesha 2 bottom bnta hain or in bottom k drmian km uz kum 7 sy 8 candles ka distance hona chaheay tb he hum in ko double bottom pettern kahty hain agr wo distence 3 ya 4 candles ka ho ga tw wo double bottom candlestick pettern nhn ho ga.Candlestick Pattern ko samajny ky liye ap ko iss bat par focus karna ho ga ky market mn 1 time par 2 same lowest points hoty hain. Jin ko market touch kar ky wapis aapis aati hai. Market ki iss position ko Double Bottom Candlestick Pattern kehty hain. Double Bottom Chart Pattern ak trend reversal pattern ha Ye pattern long bearish trend k bottom per support level per banta ha Ye pattern batata ha k sellers price ko nicha la ker jata han lakin power kam hona ki waja sa price ko hold nahe ker pata Sellers is pattern man two time price ko same level tak nicha le ker jata han lakin second bottom k bad jab price hoti ha to pher ak long bullish trend k start hona ki 50% confirmation ho jati haPattern ko samajny ky liye ap ko iss bat par focus karna ho ga ky market mn 1 time par 2 same lowest points hoty hain. Jin ko market touch kar ky wapis aapis aati hai. Market ki iss position ko Double Bottom Candlestick Pattern kehty hain. Double Bottom Chart Pattern ak trend reversal pattern ha Ye pattern long bearish trend k bottom per support level per banta ha Ye pattern batata ha k sellers price ko nicha la ker jata han lakin power kam hona ki waja sa price ko hold nahe ker pata Sellers is pattern man two time price ko same level tak nicha le ker jata han Double bottom chart pattern k baray mein thora share karu gi agr mein koi cheeze bhul jao to ap please bata sakty hai. Double top aur double bottom bohat hi famous aur simple se chart pattern hai. yeh pattern market ke present trend ko badall dety hai is liye in ko Reversal chart pattern b kaha jata hai.jb kisi b currency wegera ki price nichay ki taraf ja kr uper ay jaye aur phir dobara nichay ki taraf jaye magar phelay wali kam price se nicay na jaye bulke phelay wali kam price se wapas aye is ko double bottom khety hai. jisay nicay walay chart mein dhekhay ke ek dafa market nichay ki taraf gai jis ko hum bottom khety hai phir uper ayi aur dobara nichay gai bottom 2 tak is k bd market phir uper ki taraf ayi. dono bottom ko mila kr hum double double kahaye gay. aur aisi surat mein market uper jaye gi yani double bottom ki surat mein buy krna chaiye aur agr sell kia ho to trade close kr de. indication ye hota hay key market ki M ki shakal me movement kar leti hay aur resistance level 2 times try karny key bawajood be break nahi hota aur market 1st top level ko break karny me nakam ho jaye to es ko double top pattern kaha jata hay aur jab market support level ko 2 times break na kary aur W ki shakal me movement karny key bad per se market up side me move kary to ye double bottom samja jata hay, M aur W shape me market ki movement ko double top aur bottom movement samjy jaty hey jo key technical analysis key ley bahot hi powerful tasawar key jaty hey, large time frame me agar market long period key bad M aur W shape banaye to ye yakeen key sath technical point of view se double top aur bottom pattern hi hota hay jes ko follow karna technical analysis par yakeen karny waly traders zarori samjty hey, simple words me double bottom levels strong bearish trend ka indication hota hay Candle Example ko samajny ky liye ap ko iss bat standard center karna ho ga ky market mn 1 time standard 2 same bottommost extremes hoty hain. Jin ko market contact kar ky wapis aapis aati hai. Market ki iss position ko Twofold Base Candle Example kehty hain. Twofold Base Outline Example ak pattern inversion design ha Ye design long negative pattern k base per support level per banta ha Ye design batata ha k merchants cost ko nicha la ker jata han lakin power kam hona ki waja sa cost ko hold nahe ker pata Dealers is design man double cross cost ko same level tak nicha le ker jata han lakin second base k awful poke cost hoti ha to pher ak long bullish pattern k beginning hona ki half affirmation ho jati ha Last affirmation k liye broker dono base k beginning stage ko ak pattern line sa jorta ha. Is pattern line ko " Neck area"" kehta han, hit cost is neck area ko break kerti ha to broker ko long bullish pattern ki 100 % affirmation ho jati ha..


                      • #12 Collapse

                        Re: Double Bottom Chart Pattern:

                        Twofold Base Graph Example:
                        Twofold Base Candle Example
                        Twofold Base Candle Example ko samajny ky liye ap ko iss bat standard center karna ho ga ky market mn 1 time standard 2 same bottommost extremes hoty hain. Jin ko market contact kar ky wapis aapis aati hai. Market ki iss position ko Twofold Base Candle Example kehty hain. Twofold Base Graph Example ak pattern inversion design ha Ye design long negative pattern k base per support level per banta ha Ye design batata ha k venders cost ko nicha la ker jata han lakin power kam hona ki waja sa cost ko hold nahe ker pata Merchants is design man double cross cost ko same level tak nicha le ker jata han lakin second base k terrible hit cost hoti ha to pher ak long bullish pattern k beginning hona ki half affirmation ho jati ha Last affirmation k liye broker dono base k beginning stage ko ak pattern line sa jorta ha. Is pattern line ko " Neck area"" kehta han, punch cost is neck area ko break kerti ha to merchant ko long bullish pattern ki 100 % Twofold Base Example Ki Jankari Kaisy KarenTwofold Base example ko market mama murmur pahly bhe examine kr chuky hain k is pettern ko murmur is ki shape ki wja sy W pettern the kahty hain tw is hisab sy kisi the merchant k leay twofold base pettern ko smjhna asaan hota ha ye pettern ek lmby downtrend k awful bnta ha or is pettern mama hmesha 2 base bnta hain or in base k drmian km uz kum 7 sy 8 candles ka distance hona chaheay tb he murmur in ko twofold base pettern kahty hain agr wo distence 3 ya 4 candles ka ho ga tw wo twofold base candle pettern
                        \Twofold Base Example Ki Tafseel
                        Twofold base graph design k baray mein thora share karu gi agr mein koi cheeze bhul jao to ap please bata sakty hai. Twofold top aur twofold base bohat hey well known aur straightforward se diagram design hai. yeh design market ke present pattern ko badall dety hai is liye in ko Inversion diagram design b kaha jata hai.jb kisi b money wegera ki cost nichay ki taraf ja kr uper ay jaye aur phir dobara nichay ki taraf jaye magar phelay wali kam cost se nicay na jaye bulke phelay wali kam cost se wapas yes is ko twofold base khety hai. jisay nicay walay outline mein dhekhay ke ek dafa market nichay ki taraf gai jis ko murmur base khety hai phir uper ayi aur dobara nichay gai base 2 tak is k bd market phir uper ki taraf ayi. dono base ko
                        • <a href="https://www.instaforex.org/ru/?x=ruforum">InstaForex</a>
                        • #13 Collapse

                          Re: Double Bottom Chart Pattern:

                          WHAT IS DUBBLE BOTTOM

                          dear trader ye bahut he ahin topic ha ham dubble botom ka bary main parh rahy hanjo ka 1 trader ka lye bahut he ahim hota ha toye asal main ha kaya ye market ka esa point hota ha jis par market 2 dafa girti ha lakin is ko brak nhe kar pati ha to is waja sa ye point bahut he ahim hota ha kun ka is ka bad market bahut tezi sa bounce karti ha to jo expert hoty han ye is sa acha khasa faida hail kar lety han kun ka in ko pata hota ha market ki condition ka or woh is ko sahi sa analysis kar lety han islye marekt in ko acha proit deti ha or ye nuksan sa bach jaty han.

                          DUBBLE BOTTOM INFORMATION

                          Ye bat bahut he ahim ha ka ap dubble bottom chart pattren ko kis tarah sa find karen ye itna mushkill nhe ha par ap ko market ka bary main ya chart ka bary main information ka hona zarori ha to ap jab bhe chart ko dekhen ga ap is ko assani sa find kar len ga or ap na ye bat bhe yad rakhni ha ka dubble botom agar sport par bany to ye zeyada power full hota ha or ap ko is sa nuksan bhe hota ha to ap market ko or is pattren ko analysis kar ka is sa acha khasa profit bana skty han.

                          TRADE WITH DUBBLE BOTTOM

                          dubble bottom ko find karna bahut he assan hota ha lakin ap na koshish karni ha ka isy bary time frame pa talash karen taky ap ko acha profit ho to is ko find kasrnyy ka bad ap na is ko proper analysis karna ha break out ka khayal rakhna ha conform hony pa ap na trade leni ha to jab ap is o analysis karen ga to ap ko pata chal jaye ga ka kahan tak market ja skti ha us ka mutabik pher ap na sl or tp ka sath trade iopen karni ha.
                          Click image for larger version

Name:	DoubleBottomSampleImage.png
Views:	3
Size:	16.9 کلوبائٹ
ID:	12432040

                          BREAK OUT AND CONFORMATION

                          Ybat bahut he ahimha market main kuch bhe 100% nhe hota ha to ap na carely is main work karna hota ha hamessha jab bhe ap asy pattren par work karen break out ka wait kiya karen us ka bad jab market ap ko conformation de tab ap na is main trader open karni hoti ha agar ap asy he andazy pe trade karen ga to ismain ap ko nuksan ka samna ho skta ha to ap na is sa bachna ha or acha kam karna ha.

                          اب آن لائن

                          Working...
                          X