Asslam.u.Aliakum Dosto...
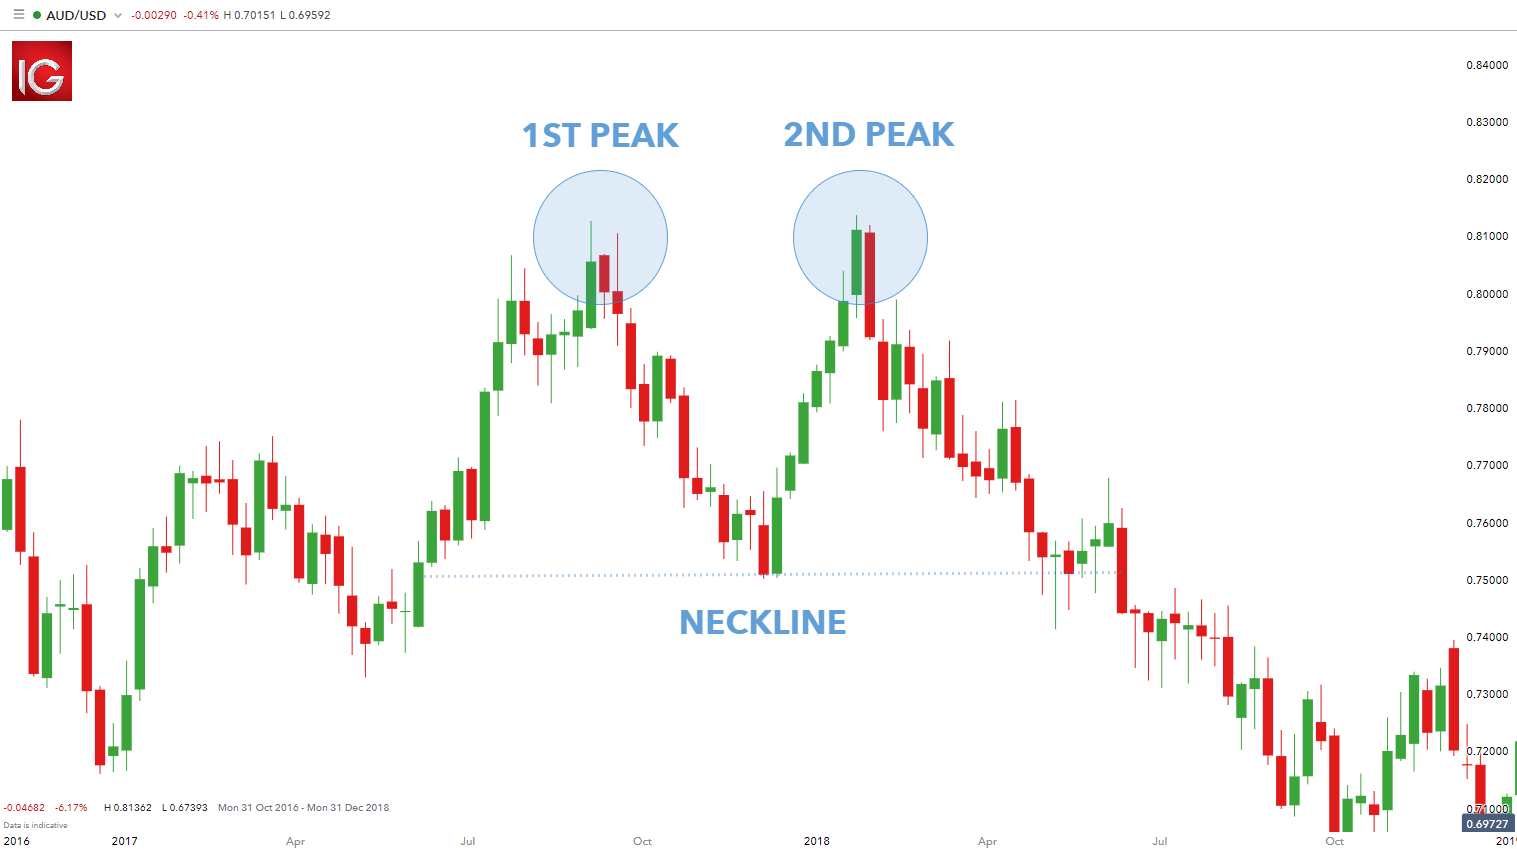
Double Top Chart Pattern:
Double Top Chart Pattern ak bullish trend reversal chart pattern hai. jo currency pairs aur commodities k price chart man long bullish trend k top per banta ha. Is pattern man first buyers price ko oper le ker jata han lakin buyers k pressure man decrease ki waja sa sellers price ko nicha le ata han. Lakin buyer ak bar pher price ko oper le ker jata han lakin weak hona ki waja sa sellers proce ko nicha le atta han. Is terha price double top banati ha jo same price level sa start hoti ha, ager double Top k start level ko trend line sa jora jae to is line ko Neckline kehta han. Is pattern per trading k liye neckline bhot importance rukhti ha q k is pattern k complete hona per price neckline ko break karti hai.
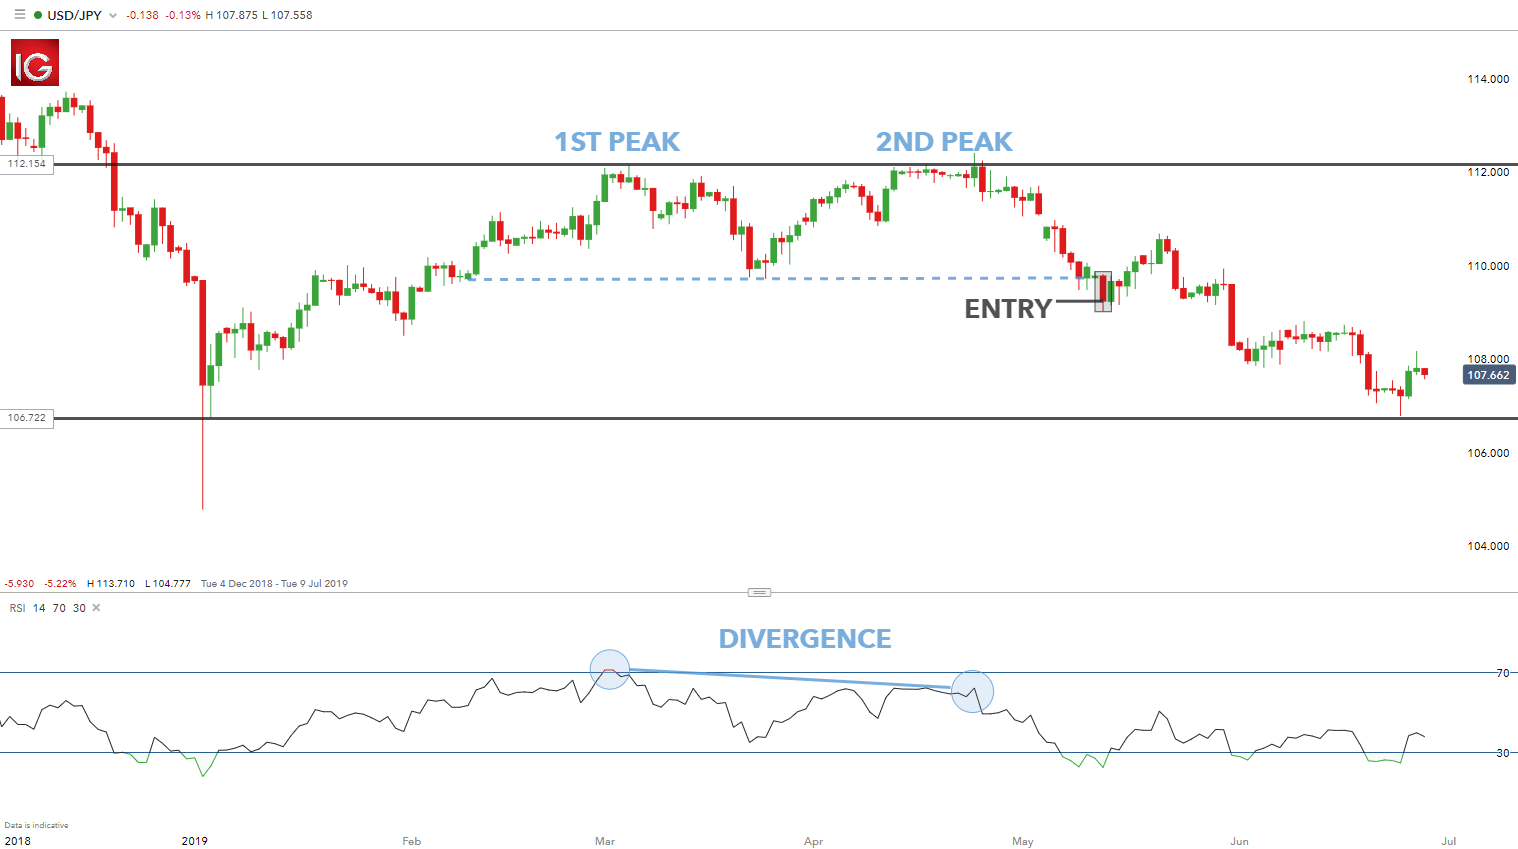
Trading With Double Top Candlestick Pattern:
Double Top Chart Pattern per trading k liye zarori ha k trader is pattern k complete hona ka wait kerna chaheye. Jab price neckline k pass a ker candle ka close Neckline sa nicha de to is sa breakout ki confirmation ho jati ha. Trader ko trade active kerna k liye price ka neckline ko re-test kerna ka wait kerna chaheye. Jab price neckline ko re-test kerna ki confirmation de to is per trader ko Sell ki Trade active kerni chahiye.
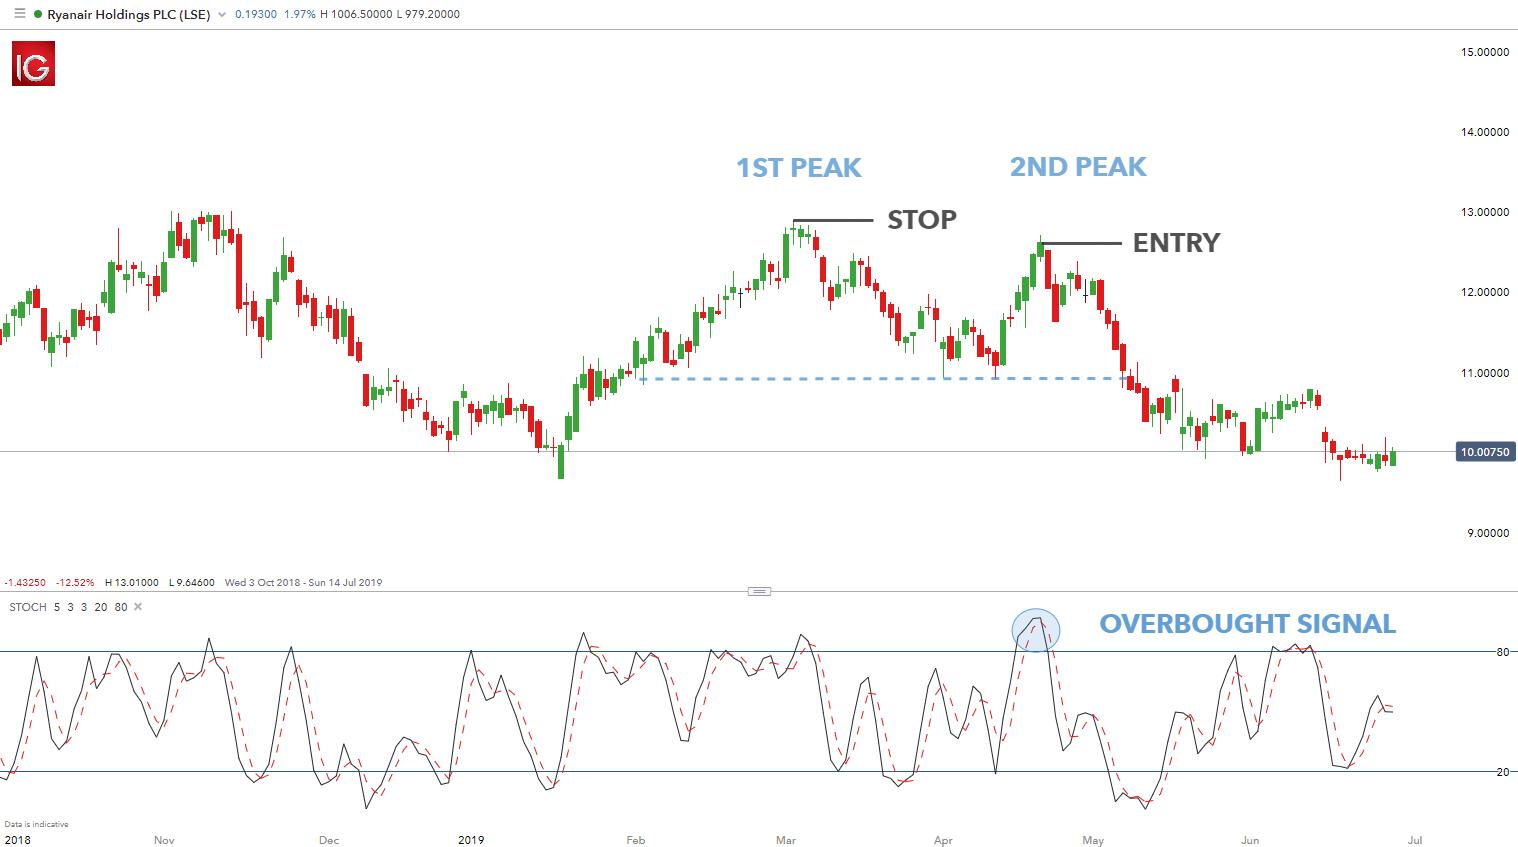
How to set Stop loss and Take Profit:
Double Top Chart Pattern per trading k doran trader ko Stoploss price k last top k oper place kerna chaheye aur Take Profit ko next support levels per Tp-1, Tp-2 aur Tp-3 ker k place karain.


تبصرہ
Расширенный режим Обычный режим