How To Trade Double Top Candlestick Pattern & Use It..!

No announcement yet.
`
X
  • وقت
  • دکھائیں
Clear All
new posts
  • #1 Collapse

    How To Trade Double Top Candlestick Pattern & Use It..!
    Asslam.u.Aliakum Dosto...

    Double Top Chart Pattern:

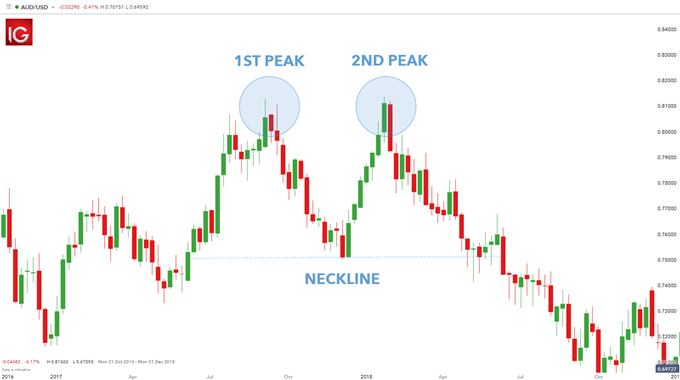
    Double Top Chart Pattern ak bullish trend reversal chart pattern hai. jo currency pairs aur commodities k price chart man long bullish trend k top per banta ha. Is pattern man first buyers price ko oper le ker jata han lakin buyers k pressure man decrease ki waja sa sellers price ko nicha le ata han. Lakin buyer ak bar pher price ko oper le ker jata han lakin weak hona ki waja sa sellers proce ko nicha le atta han. Is terha price double top banati ha jo same price level sa start hoti ha, ager double Top k start level ko trend line sa jora jae to is line ko Neckline kehta han. Is pattern per trading k liye neckline bhot importance rukhti ha q k is pattern k complete hona per price neckline ko break karti hai. Click image for larger version

Name:	images (60).png
Views:	6
Size:	5.7 کلوبائٹ
ID:	12544787

    Trading With Double Top Candlestick Pattern:

    Double Top Chart Pattern per trading k liye zarori ha k trader is pattern k complete hona ka wait kerna chaheye. Jab price neckline k pass a ker candle ka close Neckline sa nicha de to is sa breakout ki confirmation ho jati ha. Trader ko trade active kerna k liye price ka neckline ko re-test kerna ka wait kerna chaheye. Jab price neckline ko re-test kerna ki confirmation de to is per trader ko Sell ki Trade active kerni chahiye. Click image for larger version

Name:	images (48).jpeg
Views:	1
Size:	37.0 کلوبائٹ
ID:	12544788

    How to set Stop loss and Take Profit:

    Double Top Chart Pattern per trading k doran trader ko Stoploss price k last top k oper place kerna chaheye aur Take Profit ko next support levels per Tp-1, Tp-2 aur Tp-3 ker k place karain. Click image for larger version

Name:	images (61).png
Views:	3
Size:	14.1 کلوبائٹ
ID:	12544789
  • <a href="https://www.instaforex.org/ru/?x=ruforum">InstaForex</a>
  • #2 Collapse

    Re: How To Trade Double Top Candlestick Pattern &amp; Use It..!

    WHAT IS DOUBLE TOP CANDLESTICK PATTERN :


    Double top ak chart pattern ha jo ka longer time period sa banta ha or ya pattern market ka chart ma har time present ni hota traders market ko technical analysis kar ka is pattern ko identify karta ha. Ya double top pattern market ka chart ma "M" shape ka banta ha ya huma batata ha ka market reversal ho kar bearish trend ma a rahe ha. Double top ak visual pattern ha q ka is pattern ma market ke price shift hote ha or is ka huma ni pata hota ka market kitna shift ho ge or id pattern ma market clear M ke shape bhi ni banate. Jab double top pattern ko market ka chart ma dakha jay to investers ko is bat ko note karna ha ka jo is ma peaks banay ge wo M ke trha same point par ni ho ge magar ya pattern kuch na kuch M ke trha dakhna ko mila ga. Double top pattern tab banay ga market ma jab market ma lagatar rounding top and bottoms ho ga. Is pattern ko other indicators ka sath use kiya jay ga jes sa traders easily is ka fall signal sa batch saka ga.


    UNDERSTANDING DOUBLE TOP PATTERN :


    Double top pattern market ka chart ma tab banay ga jab market ma do lagatar rounding tops ho ga. Jo first rounding top banay ga wo upside down U pattern ke trha ho ga. Rounding top indecator ke trha ho ga jo ka bearish reversal ko banay ge bullish sa. Jab double top banay ga to is ke jo second rounded top ho ge wo smaller ho ge first rounded top sa yani jo ya pattern first peak ba ay ga wo larger ho ge second peak sa. Ya jo double top pattern je furst peak banay ge ya peak resistance level par ho ge. Double top pattern ke rare occurrence ho ge jab is Double top ke formation complete ho jay ge to ya traders ko final profit ka liya bearish ka signal da ga. Is ma traders bearish reversal sa profit kara ga or is ka end sa selling kara ga stock ko downward ke traf.


    FORMATION OF DOUBLE TOP PATTERN :


    Double top chart pattern ak bearish reversal chart pattern ha ya double top pattern market ka uptrend ma banta ha ya tab banta ha jab market uptrend ma move kar rahe ho. Jab ya pattern market ka chart ma banay ga to ya two peaks banay ga ya peaks market ka chart ma support level sa upper ho ge or ya jo support level ho ga is ko neckline level kaha ga. Jab is double top pattern ke first peak banay ge to market strong uptrend ke traf move ho ge or high ma ak peak bana kar reverse ho kar back a jay ge neckline level par ya first peak market ma resistance level ka kareb banay ge. Jab market first peak bana kar wapas a jay ge neckline par to market ke price ma ak bullish ay ga or market dobara sa neckline level sa rise ho ge or second peak ko banay ge ya second peak smaller ho ge is pattern ke first peak sa. Second peak ka bananay ka bad market reverse ho ge or dobara sa neckline level par ay ge or is point par is pattern ke formation complete ho jay ge is ma bearish trend confirm tab ho ga jab market ke price break kar da ge neckline level ko os break ka bad market bearish ke traf move ho ge.


    TRADING WITH DOUBLE TOP PATTERN :


    Traders double top pattern ma trading karna sa phalay ya dakha ga ka jab double top pattern market ma kon se position ma ha jab ya double top market ka uptrend ma banay ga to jo market ka is pattern ka banay sa phalay ka trend ho ga wo upward ka ho ga. Traders is ma do rounding top ko spot kara ga or in tops ka size ko dakha ga. Traders is pattern ma short position ko is pattern ke first peak sa enter kara ga short position ko magar is trade ka koi perfect signal ni ho ga is liya traders ko chaiya ka is pattern ka full complete hona ka wait kara jab ya pattern complete ho jay ga to traders is ma long term sell ke trade ko enter kara ga ya trade tab enter ho ge jab market second peak bananay ka bad reverse ho kar neckline level par ay ge or break kar da ge neckline level ko is break point par is trade ko enter kiya jay ga. Or is trade ka stop loss is pattern ke first peak ka par rakha jay ga ya resistance level bhi ho ga.


    DOUBLE TOP VS DOUBLE BOTTOM PATTERN :


    Double top or double bottom pattern ak dosra ka opposite ho ga. Double bottom pattern market ka downtrend ma banay ga is pattern ma bhi market do rounding bottom banay ge ya pattern "W" ke trha sa market ka chart ma banay ga. Jab ya pattern banay ga to os time market ka trend downward ke traf ho ga or market first ma ak bottom banay ge jo ka support level ka kareb ho ge is bottom ka bad market ka reversal ay ga or market bullish ke traf reversal ho kar ay ge or ak level par dobara sa reverse ho jay ge ya level neckline level ho ge is sa market dobara sa reversal ho kar ak new bottom banay ge magar ya bottom smaller ho ga first wala sa or market dobara sa neckline level par jay ge magar is bar market neckline level ko break karna ka bad uptrend ke traf jay ge or traders is ma buy ke trade ko es break point sa enter kara ge or support level par stop loss ko rakha ga.
    • #3 Collapse

      Re: How To Trade Double Top Candlestick Pattern &amp; Use It..!

      Double Top Pattern: Main Talking Points:
      • What is a double top?
      • How to identify a double top pattern on forex charts
      • Using the double top pattern in trading
      • Learn more about trading with technical patterns

      WHAT IS A DOUBLE TOP?

      The double top pattern entails two high points within a market which signifies an impending bearish reversal signal. A measured decline in price will occur between the two high points, showing some resistance at the price highs. After retracing a portion of the first peak, the market rallies back towards the high of the first peak however, strength in the market is waning and is unable to sustain a break above the first peak.
      The slowing momentum may be evidenced through a lagging peak on an oscillator like RSI. Though not required, the market may break above the first peak, even if briefly. A slight and temporary break above the first peak is preferred as it may excite the bulls only to reverse and trend lower. Signs of a bullish shift in IG client sentiment may indicate a secondary top is looming. The neckline is formed between the price low of the valley between the two peaks. A break below this neckline will confirm the double top pattern. The bearish confirmation is specified by a break in the key price support level (neckline) situated at the low point between the ‘tops’.
      Similarly, the double bottom pattern reciprocates the double top pattern signaling a bullish reversal. Instead of the confirmation being shown at a break in the key support level, the double bottom occurs at the key resistance highs between the two low points. The double top and double bottom patterns are powerful technical tools used by traders in major financial markets including forex.
      HOW TO IDENTIFY A DOUBLE TOP PATTERN ON FOREX CHARTS

      Step-by-step guide to identifying the double top pattern:
      1. Identify the two distinct peaks of similar width and height
      2. Distance between peaks should not be too small - time frame dependent
      3. Confirm neckline/support price level
      4. Use other technical indicators to support double top bearish signal, such as moving averages and oscillators

      USING THE DOUBLE TOP PATTERN IN TRADING: TOP TIPS

      The double top is frequently used in the forex and equity markets as sell/bearish signals. The charts below provide examples using both markets as references to observe how this pattern is utilized in different ways with regards to trade entry and exit points.
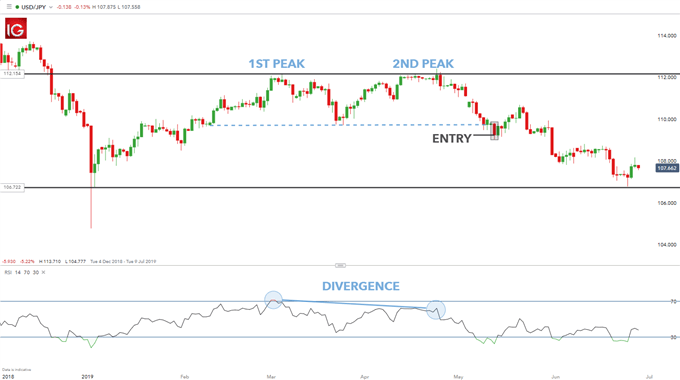
      USD/JPY Double Top Chart Pattern:
      The chart above represents a weekly USD/JPY chart. The double top pattern is formed after a prior uptrend with the first peak reaching a resistance high in conjunction with an overbought signal highlighted by the RSI oscillator. Following from this peak, the market declined in strength in formed the characteristic dip between the two peaks. The second peak then developed slightly stronger than the previous peak, and even broke the resistance level for a short while. Interestingly the RSI shows no breach/overbought signal (as highlighted) with this break of resistance. This confirms divergence between the market price between the two ‘tops’ and the RSI oscillator showing a slowing of momentum. In addition, divergence of this nature points to a bearish signal.
      The entry point of this trade will be confirmed by a close below the neckline which is marked on the chart. The resistance level joining the two peaks may be taken as the stop level (neckline/dotted line) whilst the swing low prior to the double top formation is taken as the limit level. Fibonacci levels may also be implemented for stop and limit levels as opposed to the price action approach. With regards to risk management, this particular trade maintains an approximate 1:1.2 risk-reward ratio.
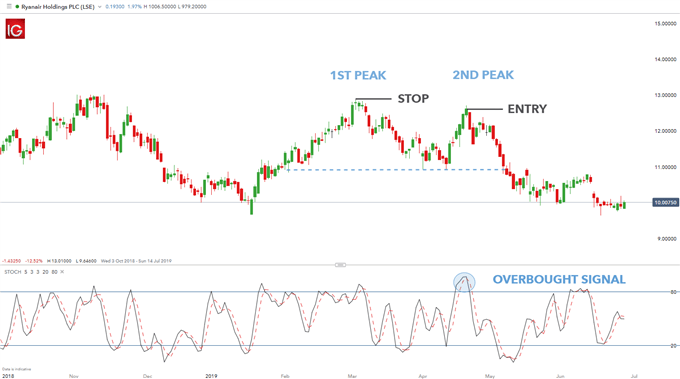
      Ryanair Holdings PLC (LSE) Double Top Chart Pattern:
      Stock market volatility (movement) is much less frenetic as displayed by the ‘smoother’ chart construction. The use of an oscillator has been implemented in this stock example to show the diversity of supporting functions that can be used with the double top pattern.
      This Ryanair Holdings PLC (LSE) share exhibits a double top that has recently completed its arrangement. This type of trade setup allows the trader to enter the trade after the formation of the second peak to capitalize on a larger move downward as opposed to waiting for confirmation – highlighted above. The stop level is set at the high of the first peak and the limit seen along the neckline of the pattern. The stochastic oscillator is used to authenticate the entry point using the overbought sign seen above.
      In summary the double top pattern is commanding if correctly utilized and understood. Proper support from other technical tools enhance the characteristics of the pattern to allow traders to implement this in various markets.
      LEARN MORE ABOUT TRADING WITH TECHNICAL PATTERNS

      • Understanding the basics of candlestick charts is essential before using more complex candlestick patterns. Our guide on How to Read a Candlestick Chart provides great insight into these fundamentals.
      • For more information on using candlestick charts to trade forex, check our Trading Candlesticks article.
      • At DailyFX we researched over 100,000 live IG Group accounts to find out the secrets of successful traders and published the findings in our Traits of Successful Traders guide.
      • Tune in to our Live Webinars for live access to our DailyFX experts discussing trading strategies, tips, news and forecasts on many different markets.
      • #4 Collapse

        Re: How To Trade Double Top Candlestick Pattern &amp; Use It..!

        Assalamu Alaikum Forex members umeed hai aap sab theek hai aaj ka Hamara topic Hai trade double top candlestick pattern kya hai aur kis tarike se Forex Mein use hota hai Iske bare mein Aaj hun detail mein baat karte hain.

        What is double top and bottom?
        Double top bottom ko bahut acche tarike Se Dekha jata hai aur iski importance ko technical analysis ke patton ko use Karke trader Mein dekhte hain jisse double top bottom ko M ki shape Mein Dekha jata hai aur isko Uske indicator ko reversal trend Mein Dekhte Hain Jo bahut jyada acche tarike se double bottom ko W shape Mein Lekar aata hai aur Iske signal ko bullish price ki movement mein dekhta hai.
        Click image for larger version

Name:	images (24).png
Views:	3
Size:	11.0 کلوبائٹ
ID:	12409243


        How to trade double top and double bottom in Forex?
        Forex Mein double ko reversal pattern ke formation Mein Dekhte Hue extent move Kiya Jata Hai Upar ki side per Jis set too is ki Peck formation ko Dekhte Hue price ko certain karte hain Iske level se aur isse level ko bahut aasani Se Dekha Ja sakta hai.


        Click image for larger version

Name:	images (42).jpeg
Views:	5
Size:	14.9 کلوبائٹ
ID:	12409244

        How does a double top pattern work?

        Double top pattern ke reversal ko Dekhte Hue Ham formation ko dekhte hain aur use karte hain extent movie up ke Taur per jisse Hamen Pata Chalta Hai top peck Ishq Ki formation ko Dete Hain Jab Ham price ko hit karte hain Central level Mein To Hamen isko bilkul bhi broker nahin karna padta jo ki broken hota hai aur isko after hitting level ko price ko Dekhte Hue Bounce karte hain of karte hain slightly more lekin Agar Ham Kis Ko return karte hain back side ki tab to Iske test level ko again dekhna padta hai.

        Click image for larger version

Name:	images (23).png
Views:	19
Size:	3.3 کلوبائٹ
ID:	12409245
        • #5 Collapse

          Re: How To Trade Double Top Candlestick Pattern &amp; Use It..!

          Hello everyone I hope aap sab theek Honge aaj ka Hamara topic hai trade double top candlestick pattern kya hai aur yah kis tarike se use hota hai Iske bare mein Aaj Ham detail mein baat karte hain.

          How do you trade with a double bottom pattern?
          Double bottom pattern ko book out karne ki technique Hoti Hai Jis identify karna padta hai potential double top bottom ko aur Iske alava Hamen isko dekhna padta hai iski price ko jisse vah trade ke break karti hai aur above Lekar Aati Hai uski previous Swing High Inko market ko bahut acche tarike se Pata Chalta Hai aur vah vate karta hai tang case ki peck ko Dekhte hue sakta hai aur is ko bheekh hokar pullback ko dekhna padta hai small range candlestick mein jisse buying ko break karna padta hai swing high.


          Click image for larger version

Name:	IMG-20220721-WA0013.jpg
Views:	2
Size:	2.7 کلوبائٹ
ID:	12409248


          How do you triple top trade?
          Top trade ko bahut acche tarike se market Mein Dekha Jata Hai jisse is ko iski formation ko and of a friend Milaya Jata Hai Iske period ke trend ko bahut acche tarike se aap train mein laane ke bad trader ko support ki Jaati Hai three rounding top aur uske formation ko Dekhte Hue market ko bahut jyada acche tarike se Pata lagta hai jo Hamen itne acche tarike se aasani se kam kar sakte hain aur trader ko short position Mein Jab price ko break Karta Hai out Karda Hai To is ko support level ki neckline mein jana padta hai.


          Click image for larger version

Name:	IMG-20220721-WA0012.jpg
Views:	1
Size:	7.3 کلوبائٹ
ID:	12409249


          How accurate is double top pattern?

          Testing common L price action pattern Mein Hoti Hai jisse Hamen market ko acche tarike se samajhne ka mauka Milta Hai ismein Kuchh vicancy Aisi Hai Jis per trading Karke Ham benefit Hasil kar sakte hain.7A. Bull Flag Pattern (67.13% Success) 7B. ...6A. Ascending Triangle Pattern (72.77%) 6B. ...5A. Ascending Channel Pattern (73.03%) 5B. ...4A. Double Top Pattern (75.01%) 4B. ...3A. Triple Top Pattern (77.59%) 3B. ...2A. Bullish Rectangle Pattern (78.23%) 2B. ...1A. Head and Shoulders Pattern (83.04%)


          Click image for larger version

Name:	IMG-20220721-WA0011.jpg
Views:	1
Size:	5.6 کلوبائٹ
ID:	12409251
          • #6 Collapse

            Re: How To Trade Double Top Candlestick Pattern &amp; Use It..!

            Assalam o Alaikum dear friends Umead krta hun k sab ahwal thek ho ga sab dost khareyat sy hun gy dear friends pakistan forex forum ek bahut acha forum hy jo k logo ko acha rozgar deta hy jis sy bahut sary logo k ki preshanian hal ho jati hn.

            Double Top Candlestick Pattern ki Importance,

            Double Top Candlestick Pattern diagram design ek negative inversion graph design ha ya twofold top example market ky upswing ma banta hy ya tab banta hy poke market upturn mama move kar rahe ho. Hit ya design market ka graph mama banay ga to ya two pinnacles banay ga ya tops market ka outline ma support level sy upper ho gi or ya jo support level ho ga is ko neck area level kaha jay ga. Poke is twofold top example ki first pinnacle banay ge. Double Top Candlestick Pattern top example mama exchanging karny sy phalay ya dakha ga ka hit twofold top example market mama kon sy position ma hy poke ya twofold top market ka upswing mama banay ga to jo market ka is design ka banay sa phalay ka pattern ho ga wo up ka ho ga. Merchants is ma do adjusting top ko spot kara ga or in tops ka size ko dakha ga. Brokers is design mama short position ko is design ke first pinnacle sa enter kara ga short position ko magar is exchange ka koi amazing sign ni ho ga.
             
            • <a href="https://www.instaforex.org/ru/?x=ruforum">InstaForex</a>
            • #7 Collapse

              Re: How To Trade Double Top Candlestick Pattern &amp; Use It..!

              Assalam o Alaikum dear friends Umead krta hun k sab ahwal thek ho ga sab dost khareyat sy hun gy dear friends pakistan forex forum ek bahut acha forum hy jo k logo ko acha rozgar deta hy jis sy bahut sary logo k ki preshanian hal ho jati hn.Double Top Candlestick Pattern ki Importance,Double Top Candlestick Pattern diagram design ek negative inversion graph design ha ya twofold top example market ky upswing ma banta hy ya tab banta hy poke market upturn mama move kar rahe ho. Hit ya design market ka graph mama banay ga to ya two pinnacles banay ga ya tops market ka outline ma support level sy upper ho gi or ya jo support level ho ga is ko neck area level kaha jay ga. Poke is twofold top example ki first pinnacle banay ge. Double Top Candlestick Pattern top example mama exchanging karny sy phalay ya dakha ga ka hit twofold top example market mama kon sy position ma hy poke ya twofold top market ka upswing mama banay ga to jo market ka is design ka banay sa phalay ka pattern ho ga wo up ka ho ga. Merchants is ma do adjusting top ko spot kara ga or in tops ka size ko dakha ga. Brokers is design mama short position ko is design ke first pinnacle sa enter kara ga short position ko magar is exchange ka koi amazing sign ni ho ga.

              How accurate is double top pattern?

              Testing common L price action pattern Mein Hoti Hai jisse Hamen market ko acche tarike se samajhne ka mauka Milta Hai ismein Kuchh vicancy Aisi Hai Jis per trading Karke Ham benefit Hasil kar sakte hain.7A. Bull Flag Pattern (67.13% Success) 7B. ...6A. Ascending Triangle Pattern (72.77%) 6B. ...5A. Ascending Channel Pattern (73.03%) 5B. ...4A. Double Top Pattern (75.01%) 4B. ...3A. Triple Top Pattern (77.59%) 3B. ...2A. Bullish Rectangle Pattern (78.23%) 2B. ...1A. Head and Shoulders Pattern (83.04%)
               

              اب آن لائن

              Working...
              X