Trading with Breaking line Candlestick Pattern
X
  • وقت
  • دکھائیں
Clear All
new posts
  • #1 Collapse

    Trading with Breaking line Candlestick Pattern
    Breaking line pattern

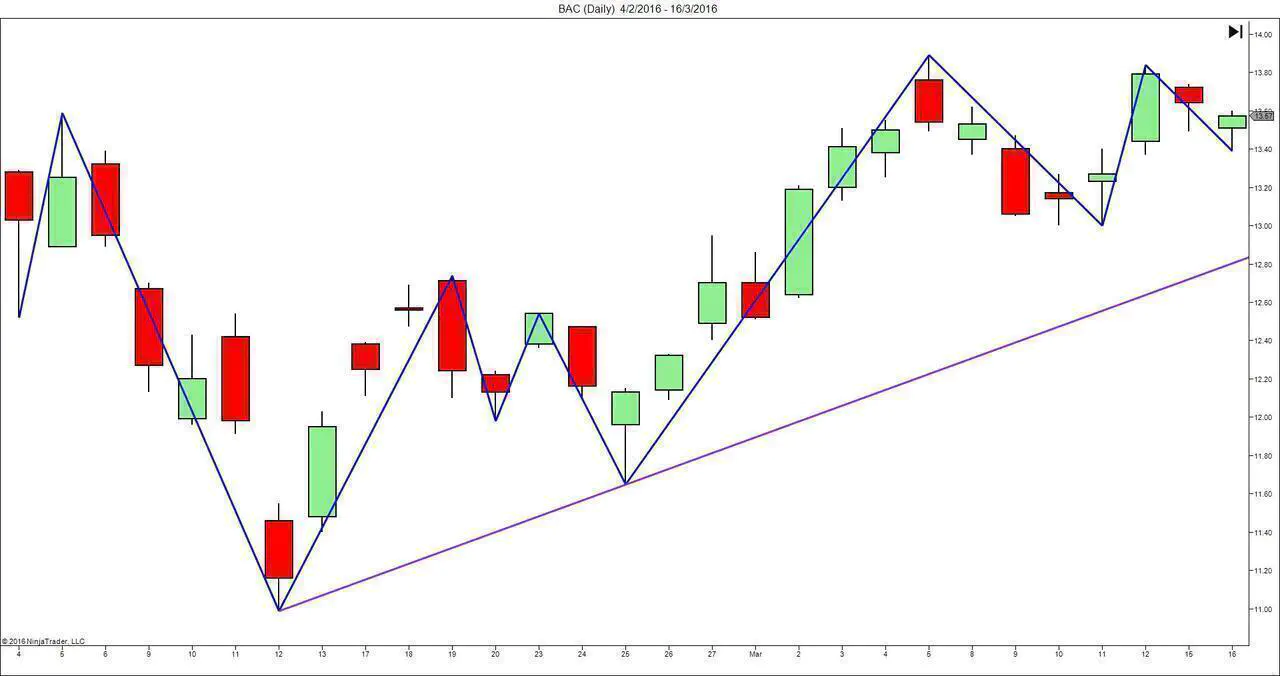
    Breaking line pattern is waqat creat hota hai jab market continue downward movement kerty huey jah aik bearish candle complete hony ky bahd next candle kuch gap ky sath down sy start ho ker bullish candle is terha sy creat ho ky last bearish candle ky more than fifty percent per close ho jaey tou aesy main jo pattern creat hota hai usko Breaking line pattern kethy hain aur jab yeh pattern complete hota hai tou isky bahd market ki hundred percent movement ka uptrend start ho jata hai aur wahan per buy ki trade open ker ky ham bahot achi earning ker sakty hain.

    Click image for larger version

Name:	images - 2022-02-17T140201.005.png
Views:	3
Size:	16.3 کلوبائٹ
ID:	12512654

    Trading Strategy with Breaking line pattern

    Forex market hamesha kisi na kisi pattern ki base per movement ker rehi hoti hai agar Ham tamam patterns ko achi terha samajh lain tou forex market main hamari liay trade kerna asan ho jata hai ky jab pattern ki base per market movement ker rehi hoti hai tou aesy time per Ham pattern ky knowledge ky mutabiq trade open ker ky bahot achi earning ker sakty hain

    Click image for larger version

Name:	images - 2022-02-17T140230.069.png
Views:	3
Size:	10.4 کلوبائٹ
ID:	12512655

    Timeframe for Breaking line pattern

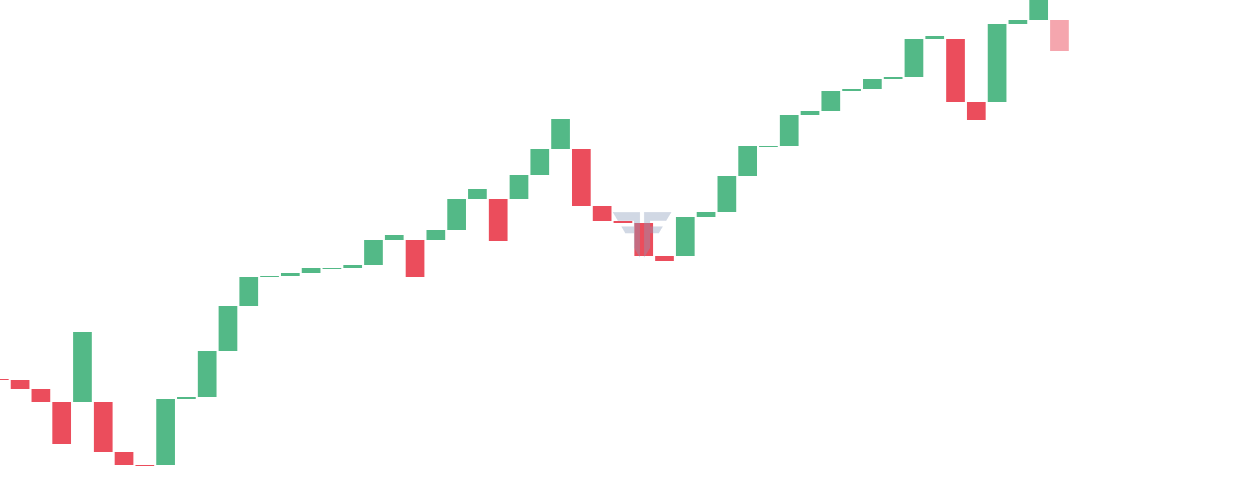
    Is pattern me apko trade buy ki avail krni chye aor apka stoploss beolw the support honq chye yeh aik confirm trade bn sakti hai trrading market ma candlestick chart ko bahot powerful smjha jata hai Forex trading business sab sy bara technical tool trading chart he hai trading chart ky ander different time frame hain lkn agr ap higher time frame use kren gay to iski achi predictions milen gi aor double boot on pattern agr 4h ya is sy bary trading chart py bny to yeh zeyada perfect ho ga.
  • <a href="https://www.instaforex.org/ru/?x=ruforum">InstaForex</a>
  • #2 Collapse

    Trading ke duniya mein candlestick patterns ka bohat zyada importance hai. Yeh patterns humein market ki psychology aur price action ko samajhne mein madad karte hain. Candlestick patterns ke through hum market ke trend ko pehchan sakte hain aur trading decisions le sakte hain. Breaking Line Candlestick Pattern do candlesticks ka combination hota hai jo market mein trend reversal ko indicate karta hai. Yeh pattern bullish aur bearish dono scenarios mein ban sakta hai. Pehle hum bullish breaking line pattern ko samajhte hain.


    Bullish Breaking Line Pattern
    1. First Candle: Pehli candle ek lambi bearish red candle hoti hai jo indicate karti hai ke market mein selling pressure zyada hai.
    2. Second Candle: Doosri candle bullish green candle hoti hai jo pehli candle ke body ke beech se start hoti hai aur pehli candle ke high se zyada close hoti hai. Yeh indication hoti hai ke buyers market mein enter ho gaye hain aur unhone sellers ko overpower kar liya hai.
    Bearish Breaking Line Pattern
    1. First Candle: Pehli candle ek lambi bullish green candle hoti hai jo indicate karti hai ke market mein buying pressure zyada hai.
    2. Second Candle: Doosri candle bearish red candle hoti hai jo pehli candle ke body ke beech se start hoti hai aur pehli candle ke low se neeche close hoti hai. Yeh indication hoti hai ke sellers market mein enter ho gaye hain aur unhone buyers ko overpower kar liya hai.
    Breaking Line Candlestick Pattern Ka Use Trading Mein
    Breaking Line Candlestick Pattern ko trading mein use karne ke liye kuch important cheezon ka dhyan rakhna padta hai:

    Confirmation
    Breaking Line Pattern ko tab tak use nahi karna chahiye jab tak confirmation na mil jaye. Confirmation ka matlab hai ke doosri candle ka close pehli candle ke high/low ke upar/neeche ho.

    Volume Analysis
    Volume analysis bhi bohat important hota hai. Jab bhi Breaking Line Pattern ban raha ho, toh volume ka high hona zaroori hai. Yeh indication hoti hai ke market mein significant movement aa rahi hai.

    Support and Resistance Levels
    Breaking Line Pattern ko support aur resistance levels ke saath dekhna chahiye. Agar yeh pattern support level ke paas banta hai, toh bullish reversal ke chances zyada hote hain. Agar yeh pattern resistance level ke paas banta hai, toh bearish reversal ke chances zyada hote hain.

    Trading Strategies Using Breaking Line Candlestick Pattern
    Breaking Line Candlestick Pattern ke through hum alag alag trading strategies ko implement kar sakte hain. Neeche kuch common strategies discuss ki gayi hain.

    Bullish Breaking Line Pattern Strategy
    1. Identification: Pehle hum bullish breaking line pattern ko identify karte hain. Isme pehli candle bearish aur doosri candle bullish hoti hai jo pehli candle ke body ke middle se start hoti hai aur high ke upar close hoti hai.
    2. Confirmation: Doosri candle ka close pehli candle ke high ke upar hona chahiye.
    3. Entry Point: Confirmation ke baad hum bullish trade initiate karte hain. Entry point doosri candle ke close par hota hai.
    4. Stop Loss: Stop loss pehli candle ke low ke neeche place karna chahiye.
    5. Take Profit: Take profit level previous resistance level par ya risk-reward ratio ke hisaab se decide karna chahiye.
    Bearish Breaking Line Pattern Strategy
    1. Identification: Pehle hum bearish breaking line pattern ko identify karte hain. Isme pehli candle bullish aur doosri candle bearish hoti hai jo pehli candle ke body ke middle se start hoti hai aur low ke neeche close hoti hai.
    2. Confirmation: Doosri candle ka close pehli candle ke low ke neeche hona chahiye.
    3. Entry Point: Confirmation ke baad hum bearish trade initiate karte hain. Entry point doosri candle ke close par hota hai.
    4. Stop Loss: Stop loss pehli candle ke high ke upar place karna chahiye.
    5. Take Profit: Take profit level previous support level par ya risk-reward ratio ke hisaab se decide karna chahiye.
    Bullish Breaking Line Pattern
    Suppose karo ke market downtrend mein hai aur humein ek lambi bearish candle dekhne ko milti hai. Agle din humein ek bullish candle dekhne ko milti hai jo pehli bearish candle ke body ke middle se start hoti hai aur uske high ke upar close hoti hai. Yeh indication hoti hai ke buyers ne control le liya hai aur market mein trend reversal ho sakta hai.

    Bearish Breaking Line Pattern
    Suppose karo ke market uptrend mein hai aur humein ek lambi bullish candle dekhne ko milti hai. Agle din humein ek bearish candle dekhne ko milti hai jo pehli bullish candle ke body ke middle se start hoti hai aur uske low ke neeche close hoti hai. Yeh indication hoti hai ke sellers ne control le liya hai aur market mein trend reversal ho sakta hai.


    Breaking Line Candlestick Pattern ek powerful tool hai jo traders ko market ke trend reversal ko pehchanne mein madad karta hai. Is pattern ko use karte waqt humein kuch important cheezon ka dhyan rakhna chahiye jaise ke confirmation, volume analysis aur support/resistance levels. Yeh pattern bullish aur bearish dono scenarios mein kaam aa sakta hai aur iske through hum alag alag trading strategies ko implement kar sakte hain. Is pattern ke use se traders ko market mein better trading decisions lene mein madad milti hai aur risk management bhi improve hota hai. Trading mein success ke liye patience aur practice zaroori hoti hai. Is pattern ko real market conditions mein use karke hum apni trading skills ko enhance kar sakte hain


    Believe in yourself and your abilities. When you fight for your dreams, you can achieve anything.
    • #3 Collapse

      Trading with Breaking Line Candlestick Pattern

      Breaking Line Candlestick Pattern Kya Hai?

      Breaking Line Candlestick Pattern ek ahem aur maqbool trading pattern hai jo technical analysis mein use hota hai. Ye pattern do alag-alag candlesticks se mil kar banta hai, jo trend reversal ya continuation ke bare mein hint deti hain. Is pattern ko samajhna aur istemal karna traders ke liye bohot zaroori hai kyun ke ye market movements ko predict karne mein madadgar ho sakta hai.


      Breaking Line Candlestick Pattern Ki Pehchaan


      Breaking Line Candlestick Pattern do candlesticks par mabni hota hai. Yeh pattern bullish aur bearish dono trends mein paaya ja sakta hai.
      1. Bullish Breaking Line Pattern:
        • Pehli candlestick bearish hoti hai, jo market downtrend ko indicate karti hai.
        • Doosri candlestick bullish hoti hai aur pehli candlestick ke high se upar close hoti hai. Ye indicate karta hai ke market mein reversal ho sakta hai aur prices ab upar jaane wali hain.
      2. Bearish Breaking Line Pattern:
        • Pehli candlestick bullish hoti hai, jo market uptrend ko indicate karti hai.
        • Doosri candlestick bearish hoti hai aur pehli candlestick ke low se neeche close hoti hai. Ye indicate karta hai ke market mein reversal ho sakta hai aur prices ab neeche jaane wali hain.
      Click image for larger version

Name:	images (23).png
Views:	16
Size:	12.8 کلوبائٹ
ID:	12989870
      Breaking Line Candlestick Pattern Ka Analysis


      Yeh pattern technical analysis ke liye bohot useful hai. Isse traders ko market ke future movements ka andaza lagane mein madad milti hai. Breaking Line Candlestick Pattern ko samajhne ke liye kuch zaroori points hain:
      1. Trend Identification:
        • Pattern ko sahi se identify karne ke liye, current trend ka maloom hona zaroori hai. Agar market uptrend mein hai aur bearish breaking line pattern ban raha hai, to ye reversal ka signal ho sakta hai.
        • Agar market downtrend mein hai aur bullish breaking line pattern ban raha hai, to ye bhi reversal ka signal ho sakta hai.
      2. Volume Confirmation:
        • Pattern ko confirm karne ke liye volume ka analysis bhi zaroori hai. Agar doosri candlestick high volume ke saath close hoti hai, to pattern zyada strong hota hai aur iski credibility barh jaati hai.
      3. Support and Resistance Levels:
        • Breaking Line Candlestick Pattern ko support aur resistance levels ke saath dekhna bohot ahem hai. Agar pattern support level par ban raha hai, to ye strong bullish signal ho sakta hai.
        • Agar pattern resistance level par ban raha hai, to ye strong bearish signal ho sakta hai.

      Trading Strategy with Breaking Line Candlestick Pattern


      Breaking Line Candlestick Pattern ko trading mein istemal karte waqt kuch trading strategies ko follow karna zaroori hai. Yeh strategies aapke trading decisions ko improve kar sakti hain.
      1. Entry Point:
        • Bullish Breaking Line Pattern ke case mein, doosri candlestick ke close hone ke baad buy position lena chahiye.
        • Bearish Breaking Line Pattern ke case mein, doosri candlestick ke close hone ke baad sell position lena chahiye.
      2. Stop Loss:
        • Bullish pattern mein, stop loss pehli candlestick ke low ke neeche set karna chahiye.
        • Bearish pattern mein, stop loss pehli candlestick ke high ke upar set karna chahiye.
      3. Profit Target:
        • Profit target ko identify karne ke liye previous support aur resistance levels ka analysis karna chahiye.
        • Risk-reward ratio ko dhyan mein rakhte hue target set karna chahiye, jaise 1:2 ya 1:3 ratio.
      4. Risk Management:
        • Trading mein risk management bohot zaroori hai. Hamesha apne capital ka sirf ek chhota hissa risk par lagaayein, jaise 1-2% per trade.
        • Diversification ko apnaayein aur ek hi asset par zyada focus na karein.
      Click image for larger version

Name:	images (22).png
Views:	9
Size:	30.3 کلوبائٹ
ID:	12989871
      Breaking Line Candlestick Pattern Ka Example


      Ek bullish breaking line candlestick pattern ka example:
      1. Pehli candlestick bearish hai aur uska close peechlay lows ke aas-paas hota hai.
      2. Doosri candlestick bullish hai aur uska close pehli candlestick ke high ke upar hota hai. Ye indicate karta hai ke buyers market mein wapas aa gaye hain aur prices ab upar jaane wali hain.

      Is pattern ko identify karke, trader doosri candlestick ke close hone ke baad buy position le sakta hai. Stop loss pehli candlestick ke low ke neeche set karna aur profit target previous resistance level ke aas-paas set karna chahiye.

      Click image for larger version

Name:	images (21).png
Views:	10
Size:	10.8 کلوبائٹ
ID:	12989872

      Conclusion

      Breaking Line Candlestick Pattern ek powerful tool hai jo traders ko market ke trends aur reversals ko predict karne mein madad karta hai. Is pattern ko sahi se samajhne aur istemal karne ke liye trend analysis, volume confirmation, aur support-resistance levels ka dhyan rakhna zaroori hai. Trading strategies, risk management aur discipline ke sath is pattern ko follow karne se aap apni trading performance ko improve kar sakte hain.
      منسلک شدہ فائلیں
      • #4 Collapse

        Trading with Breaking line Candlestick Pattern.


        Trading with Breaking Line Candlestick Pattern" ek technical analysis technique hai jo candlestick chart patterns ka use karke trading decisions banane mein madad karti hai. "Breaking line" candlestick pattern ka concept niche diya gaya hai.

        Click image for larger version

Name:	images (25).png
Views:	14
Size:	7.5 کلوبائٹ
ID:	12990009


        Breaking Line Candlestick Pattern.

        Breaking Line Pattern ek bullish reversal pattern hai jo do candles se milke banta hai.


        1.First Candle.


        Ek bearish (red) candle hoti hai jo market mein selling pressure ko show karti hai.


        2.Second Candle.


        Ek bullish (green) candle hoti hai jo previous bearish candle ke closing price ke upar close hoti hai.


        Pattern Identification.


        1.First Candle.

        Yeh ek red candle hoti hai jo price downtrend ko dikhati hai.

        2.Second Candle.

        Yeh green candle hoti hai jo pehli candle ke opening price ke upar close hoti hai.


        Trading Strategy.


        1.Confirmation.

        Jab breaking line pattern form hota hai, toh confirmation ke liye traders ko doosre indicators ya volume ka analysis karna chahiye.
        ​​​​​​
        2.Entry Point.

        Second bullish candle close hone ke baad traders market mein enter kar sakte hain.

        3.Stop Loss.

        First bearish candle ke low ke neeche stop loss set kar sakte hain.

        4.Take Profit.

        Previous resistance levels ya risk-reward ratio ke hisaab se profit target set kar sakte hain.


        Advantages.


        . Simplicity.

        Simple pattern recognition.

        . Effectiveness.

        Potential trend reversal points ko identify karta hai.


        Limitations.


        . False Signals.

        Kabhi kabhi yeh pattern false signals bhi de sakta hai, isliye doosre indicators ka use zaroori hai.

        . Market Conditions.

        Yeh pattern sabhi market conditions mein equally effective nahi hota.


        Click image for larger version

Name:	download (51).jpeg
Views:	8
Size:	13.3 کلوبائٹ
ID:	12990010

        Summary.


        Candlestick patterns trading mein ek powerful tool ho sakte hain, magar inhe akela use karne ke bajaye doosre technical analysis tools ke sath integrate karna best practice hota hai.
        • <a href="https://www.instaforex.org/ru/?x=ruforum">InstaForex</a>
        • #5 Collapse

          **Breaking Line Candlestick Pattern Se Trading: Aik Comprehensive Guide**
          Breaking Line candlestick pattern technical analysis mein ek important reversal signal ke taur par use hota hai. Yeh pattern market ke trend changes aur potential reversals ko identify karne mein madad karta hai. Is pattern ko samajhna aur effectively use karna trading decisions ko enhance kar sakta hai.

          **Breaking Line Candlestick Pattern Kya Hai?**

          Breaking Line pattern ek two-candlestick reversal pattern hai jo ek strong trend ke baad banta hai. Yeh pattern tab hota hai jab ek large bullish candlestick ke baad ek smaller bearish candlestick develop hota hai, jo pehli candlestick ke close level se open hota hai aur downward move karta hai. Yeh pattern ek potential trend reversal ya consolidation phase ka indication hota hai.

          **Pattern Ka Analysis**

          1. **Candlestick Formation:** Breaking Line pattern ka formation clear hone ke liye, pehli candlestick ko strong bullish hona chahiye aur dusri candlestick ko pehli candlestick ke close ke niche open hona chahiye. Dusri candlestick ka body chhota hona chahiye aur downward movement ko represent karna chahiye.

          2. **Trend Reversal:** Yeh pattern ek existing trend ke baad banta hai, aur iska main purpose trend reversal ya consolidation ko indicate karna hota hai. Agar yeh pattern uptrend ke baad banta hai, to yeh bearish reversal signal hota hai; agar downtrend ke baad banta hai, to yeh bullish reversal signal hota hai.

          3. **Volume Analysis:** Volume analysis pattern ke confirmation ke liye zaroori hota hai. Agar dusri candlestick ke dauran volume increase hota hai, to yeh signal hota hai ke market mein strong selling ya buying pressure hai, jo pattern ke reliability ko enhance karta hai.

          4. **Entry Aur Exit Points:** Breaking Line pattern ke baad entry point typically dusri candlestick ke close ke niche hota hai, agar bearish pattern hai, aur buy position open ki ja sakti hai agar bullish pattern hai. Stop loss ko previous candlestick ke high/low ke above/below set kiya jata hai aur take profit levels ko pattern ke size aur market conditions ke basis par determine kiya jata hai.

          5. **Risk Management:** Effective risk management pattern ke trading mein zaroori hoti hai. Stop loss aur take profit levels ko strategically set karna traders ko unexpected market movements se bachata hai aur profits secure karta hai.

          **Conclusion**

          Breaking Line candlestick pattern ek useful tool hai jo market ke potential reversals ko identify karne mein madad karta hai. Candlestick formation, trend reversal, volume analysis, aur risk management ke zariye, aap is pattern ko effectively use kar sakte hain aur trading decisions ko improve kar sakte hain. Accurate analysis aur strategic planning se aap market ke changes ko capitalize kar sakte hain aur profitable trades execute kar sakte hain.

          اب آن لائن

          avatar Ayn
          avatar Adil88
          Working...
          X