Bullish Belt-Hold Pattern

No announcement yet.
`
X
  • وقت
  • دکھائیں
Clear All
new posts
  • #1 Collapse

    Bullish Belt-Hold Pattern
    Assalamu Alaikum Dosto!


    Bullish Belt-Hold Pattern


    Bullish Belt-Hold pattern two days candle par mushtamil hai aik bullish trend reversal pattern hai, jisbko aam tawar par single pattern bhi tasawar kia jata hai, q k pattern ki pehlee candle aik bearish trend ki strong real body wali long black ya bearish candle hotti hai. Pattern ki dosree candle aik strong bullish candle hotti hai, jo k open pehlee candle k below gap main hotti hai, lekin open bearish candle k real body main hotti hai. Bullish candle aik Marubozu ya Bozu candle hotti hai, q k is k down side par koi bhi shadow ya wock nahi hotti, jab k upward side par shafow acceptable hai.

    Click image for larger version

Name:	images (221).png
Views:	5
Size:	16.9 کلوبائٹ
ID:	12500298

    Candles Formation


    Bullish Belt-Hold pattern ko kuch trader single pattern jab k ziadda tar trader double candles pattern tasawar kartte hen. Pattern ki pehlee candle aik strong bearish jab k fosree candle aik strong bullish candle hotti hai. Jis ki formation darjazzel tarah se hotti hai;

    Click image for larger version

Name:	images (4) (123).jpeg
Views:	1
Size:	12.7 کلوبائٹ
ID:	12500301

    1. First Candle: Bullish Belt-Hold pattern ki pehlee candle aik black ya red color main bearish candle hotti hai, jo k previous bearish trend ki taqqat dekhatti hai. Ye candle aik normal size main bantti hai.

    2. Second Candle: Bullish Belt-Hold pattern ki dosree candle aik strong bullish candle hotti hai, jo k pehlee candle se below gap main open hotti hai, aur close pehlee candle k midpoint se above hotti hai. Ye candle aik Bozu candle hotti hai, jis ki down side par koi wick nahi hotti hai.

    Explaination

    Bullish Belt-Hold pattern aik strong bullish trend reversal pattern hai, jo k prices k bottom main bantta hai. Ye pattern two day candles par mushtamil hota hai, jis main pehlee candle aik strong bearish candle hotti hai, jo k market main bearish trend ki mazbotti battati hai. Pattern ki dosree candle aik strong bozu candle hotti hai, jo k pehlee candle se below gap main open hotti hai. Dosree candle color main white/green ya bullish candle hotti hai, jo k pehlee candle k midpoint se above close hotti hai. Bozu candle ki up side par wick to ho saktti hai lekin down side par koi wick nahi honni chaheye.
    Bullish Belt-Hold pattern shape main "Bullish Piercing Line Pattern" aur "Bullish Meeting Line Pattern" se mushabehatt rakhtti hai. Lekin meeting line pattern main dosree bullish candle pehlee candle k closing price par in-line close hotti hai, jab k piercing line pattern main dosree bullish candle k down side par bhi wick ho saktti hai. Bullish Piercing line ki shape Bullish Belt-Hold pattern se ziadda meltti jultti hai. Ye pattern aksar market main waqfa jaise weekend ya hollyday honne ki wajja se bannta hai, jo k market main bulls power dekhatti hai.

    Click image for larger version

Name:	images (219).png
Views:	44
Size:	13.3 کلوبائٹ
ID:	12500299

    Trading

    Bullish Belt-Hold pattern market main bearish trend k baad bullish ki wapasi aur buyers ka market par control ki information detti hai. Ye pattern ziadda tar markets main long break ya news events ki wajja se bantta hai. Pattern ki dosree bullish candle gap main open honne k bawajood pehlee candle k midpoint se above bhi close hotti hai aur dosrra is ka lower side par koi wick bhi nahi hotta hai, jis se market main buyers k taqqat ka andazza hotta hai.
    Market main entry karnne se pehle pattern ki position lazzmi note karen, q k aggar prices lower area main na ho to ye pattern single pattern bhi tasawar hotta hai. Trend confirmation k leye kisi relaible indicator ya teesree bullish candle k baad hi buy k trades lagayen. Stop Loss pattern k sab se lower position yanni bullish candle k opening price se two pips below set karen.

    Click image for larger version

Name:	images (220).png
Views:	15
Size:	5.2 کلوبائٹ
ID:	12500297
  • <a href="https://www.instaforex.org/ru/?x=ruforum">InstaForex</a>
  • #2 Collapse

    Re: Bullish Belt-Hold Pattern

    bhot he nice and good sharing ki haiin apne forex k releted agar best earning karna hain tu forex trading main har trades ko apni learning ko strong karna must hain qk jaaab tak learning strong nhe hoti hain tu asa koi b traders nhe hota hain k kmayabi hasil kar sake forex trading main best earning ho skti hain forex trading main kamyabi b mil skti hain jo b traaders achi earning karna chahata hain tu us traders ko achi tara forex trading ko samjhna must hota hain qk forex trading main best leaning karne wale traders he kamyab traders ban skte hain or full kamyabi pah skte hain


    how to trade on Bullish belt hold pattren


    agar forex trading main ek traders ko easy ho kar kaaam karna hain tu hard work karna hota hain qk Bullish belt hold pattren main kaam karne k liye achi tara learning karna parta hain qk jaaab tak learning strong nhe hoti hain tu earning b nhe ho skti hain achi earning karne k liye learning ka hona must hain Bullish belt hold pattren main pratice karna must hota hain bina pratice k koi b kamyab nhe hota hain forex trading ka busniess full trusted busniess hain agar learning goood hain tu best earing hain jaaab tak learning good nhe hain tu earning kabi b nhe hain learning karne k liye hard work karna must hota hain learning karne k liye learning ko incress karna must hota hain forex trading ka busniess kafi risk wala busniess hain forex trading ka busniess achi kamyabi de skta hain kamyab hone k liye hard work karna mut hain


    Click image for larger version

Name:	images.png
Views:	7
Size:	4.6 کلوبائٹ
ID:	12365599
    • #3 Collapse

      Re: Bullish Belt-Hold Pattern

      bhot he quite great sharing ki haiin apne forex k releted agar best procuring karna hain tu forex exchanging fundamental har exchanges ko apni learning ko solid karna must hain qk jaaab tak learning solid nhe hoti hain tu asa koi b dealers nhe hota hain k kmayabi hasil kar purpose forex exchanging primary best acquiring ho skti hain forex exchanging principle kamyabi b mil skti hain jo b traaders achi procuring karna chahata hain tu us merchants ko achi tara forex exchanging ko samjhna must hota hain qk forex exchanging fundamental best inclining karne rib brokers he kamyab merchants boycott skte hain or full kamyabi pah skte hain

      the most effective method to exchange on Bullish belt hold pattren

      agar forex exchanging primary ek dealers ko simple ho kar kaaam karna hain tu difficult work karna hota hain qk Bullish belt hold pattren fundamental kaam karne k liye achi tara learning karna parta hain qk jaaab tak learning solid nhe hoti hain tu procuring b nhe ho skti hain achi acquiring karne k liye learning ka hona must hain Bullish belt hold pattren principle pratice karna must hota hain bina pratice k koi b kamyab nhe hota hain forex exchanging ka busniess full trusted busniess hain agar learning goood hain tu best earing hain jaaab tak learning great nhe hain tu procuring kabi b nhe hain learning karne k liye difficult work karna must hota hain learning karne k liye learning ko incress karna must hota hain forex exchanging ka busniess kafi hazard wala busniess hain forex exchanging ka busniess achi kamyabi de skta hain kamyab sharpen k liye difficult work karna mut hain
      • #4 Collapse

        Re: Bullish Belt-Hold Pattern

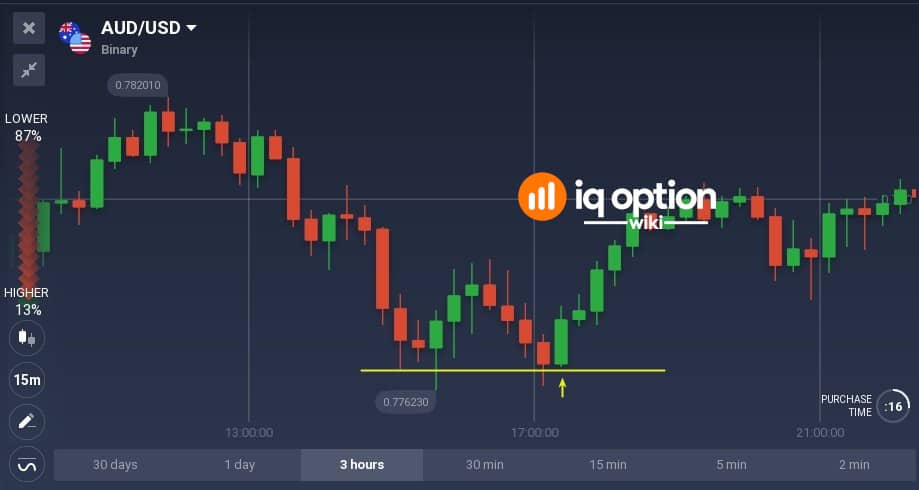
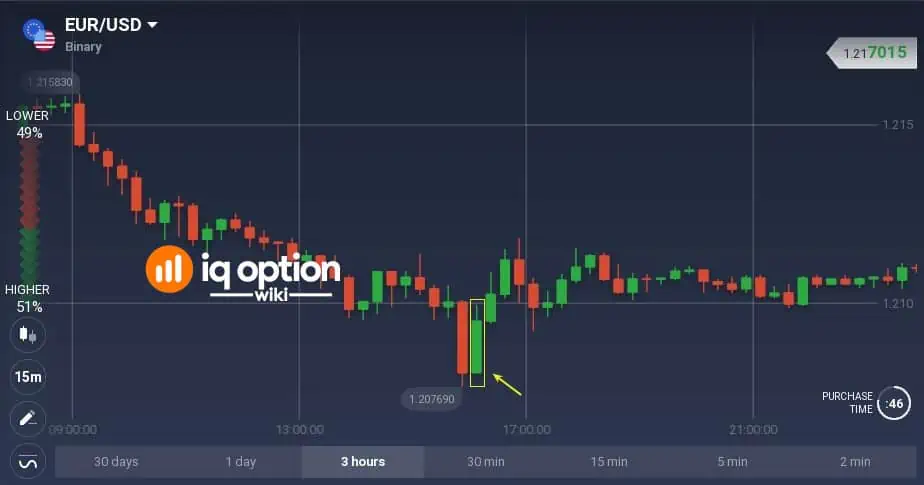
        The bullish belt hold candlestick pattern

        The bullish belt hold pattern forms when the price of the underlying asset is moving downwards. It suggests that the trend reversal may happen.
        It can be identified at any timeframe although it is more substantial on the daily or weekly charts.
        How can you find the bullish belt hold pattern?
        • There was a downtrend in the market and a bullish candle develops after some bearish candles;
        • the opening of this bullish candle lies lower than the closing of the previous bar (or they are similar on the intraday chart);
        • the green candle's body should be long with a small wick on top and no wick at the bottom (or with merely visible wick).

        Bullish belt hold candlestick on the EURUSD chartThe strength of the bullish belt hold pattern is bigger when it appears at the support level.
        It is better if belt hold appears on support-resistance levelIf you spot a local top which was a belt hold pattern, you can use it in the future as a resistance level. See the picture below. Of course, the same rule applies to local bottoms with belt patterns. They can be used as future support levels.
        An existing belt hold can be used in the future to search for price pivotsSummary

        The belt hold pattern is formed by a single Japanese candlestick. It appears during the upward movement and then it is called a bearish pattern and during the downtrend with the name of a bullish belt hold pattern.
        The belt hold is a reversal pattern which means you can expect the price will change direction after its appearance.
        This candlestick pattern occurs quite frequently thus reliability is not that high. It is good to use additional technical indicators or other price patterns.
        Practice in the IQ Option demo account. You can observe the development of the pattern and the movement of the price afterwards without risking your own money. Once you know how to use the belt hold candlestick pattern in trading, you can switch to the live account.
        • #5 Collapse

          Re: Bullish Belt-Hold Pattern

          Assalamualaikum dear friend umeed karta hun aap theek hon gyBullish Belt-Hold pattern two days candle par mushtamil hai aik bullish trend reversal pattern hai, jisbko aam tawar par single pattern bhi tasawar kia jata hai, q k pattern ki pehlee candle aik bearish trend ki strong real body wali long black ya bearish candle hotti hai. Pattern ki dosree candle aik strong bullish candle hotti hai, jo k open pehlee candle k below gap main hotti hai, lekin open bearish candle k real body main hotti hai. Bullish candle aik Marubozu ya Bozu candle hotti hai, q k is k down side par koi bhi shadow ya wock nahi hotti, jab k upward side par shafow acceptable hai.
          • #6 Collapse

            Re: Bullish Belt-Hold Pattern

            Bullish Belt-Hold Line Pattern


            Introduction


            Belt-Hold Line Pattern do candles par mushtamil aik bullish trend reversal pattern hai, jis me shamil dono candles bullish ya white color ki hoti hai. Ye pattern market k low price area ya bearish trend k baad banta hai, jis me qeematen apni semat bullish trend me badal deti hai. Pattern ki 1st candle aik bari real body wali black candle hoti hai. Bullish Belt-Hold Line Pattern ki 2nd candle aik real body wali bozu candle hoti hai, jo open to bearish trend k last candle k baad hoti hai, lekin close high price me black candle k real body k darmeyan se oper hoti hai.

            Click image for larger version

Name:	images.jpg
Views:	3
Size:	7.3 کلوبائٹ
ID:	12365622

            Pattern ki Pehchan k Rules

            1. Bullish Belt-Hold Line pattern ziada tar bearish ya low prices area me banta hai.
            2. Pattern ki 1st candle aik bari real body wali black candle hoti hai, jo k bearish trend ko zahir kar rahi hoti hai.
            3. Pattern ki 2nd candle aik bari real body wali candle hoti hai, jo k open bearish trend k last black candle k baad hoti hai, lekin close bearish trend k darmeyan k body se oper hoti hai.
            4. Pattern ki 2nd white candle ki lower side pe koi shadow nahi hota hai, jab k oper side pe shadow ho sakta hai.


            Click image for larger version

Name:	images(1).png
Views:	16
Size:	5.3 کلوبائٹ
ID:	12365623

            Pattern ki Tafseel


            Bullish Belt-Hold Line pattern aik trend reversal pattern hai, jis ko "White Opening Bozu
            Line" pattern bhi kaha jata hai. Pattern do mukhalif color k candles par mushtamil hai, jis me 1st candle aik bari real body wali black candle hoti hai, jo k market k down-trend ya low price ko zahir kar rahi hoti hai. Pattern me 2nd candle aik bari real body wali white candle banti hai, jo k qeematon k trend ko badal deta hai. Ye candle aik bozu candle hoti hai, jis k downside pe koi shadow ya wick nahi hoti. Bullish Belt-Hold Line Pattern "Counterattack line ya Bullish Meeting Line" pattern se thora sa mukhtalif hai, q k is pattern me white candle aik bozu candle banti hai.

            Click image for larger version

Name:	images(2).png
Views:	3
Size:	2.5 کلوبائٹ
ID:	12365624

            Pattern pe Trading


            Bullish Belt-Hold Line Pattern aik trend reversal pattern hai, is waja se agar ye pattern low price area ya bearish trend k baad banta hai, to ye market me buy entry ka signal de raha hota hai. Pattern ki confirmation k leye 3rd white candle ka intezar karna zarori hai, q k qeematen yahan se bearish trend continue bhi kara sakti hai. Pattern k 3rd white candle k baad buy ki entry hogi, jab k stop loss pattern k downward side 2nd white candle k open position pe hoga.

            Click image for larger version

Name:	images(3).png
Views:	1
Size:	5.9 کلوبائٹ
ID:	12365625
            • #7 Collapse

              Re: Bullish Belt-Hold Pattern

              WHAT IS A BULLISH BELT HOLD PATTERN :


              Bullish belt hold ak type hote ha candlestick pattern ke ya pattern market ka chart ma jab banta ah to ya pattern market ka downtrend ko end karta ha or market ko reversal karna ka kam karta ha. Ya pattern huma market ma downtrend ka bottom ma banta ha or market is ma downtrend sa uptrend ke traf reversal ho kar jate ha. Ya pattern strong new trend banata ha is ma market bearish sa bullish ke traf reversal ho kar ate ha. Ya pattern huma support level ka near ma dakhna ko milta ha jo market ka bullish reversal ma ak strong strength ko banata ha. Ya pattern jab banay ga to ya do he candle sa mil kar banay ga magar is pattern ka sath is ke previous candlesticks ko bhi dakhna parta ha tab he is pattern ke sai formation ka pata chal ta ha. Ya pattern market ka downtrend yani bearish ka do real body candles sa mil kar banay ga ak bearish or dosre bullish ke candle sa mil kar banay ge jo market ko ak strongly high ke traf reversal kara ge. Ya bullish belt hold candlestick pattern bearish belt hold pattern ka opposite hota ha is bearish belt pattern ma market bullish sa bearish ke traf reversal ho kar ate ha.


              HOW TO IDENTIFY A BULLISH BELT HOLD CANDLESTICK PATTERN :


              Bullish belt hold ko market ka chart ma find karna ka liya in points ko follow karna bahot he zaroori ha :


              1: Jab ya bullish belt hold pattern banay ga to is ma market downward ke traf move karte hoi ja rahe ho ge or market ma strong downtrend chal raha ho ga is downtrend ka lower ma is pattern ke formation ho ge or ya pattern downtrend ko end kara ga or market ko bullish ke traf reversal kara ga.

              2: Is pattern ke jo first candle banay ge wo apna previous trend ko follow karte hoi banay ge is ma market ke price high sa low ke traf jay ge q ka ya ak bearish ke candle ho ge ya candle ak long real body down candle ho ge ya candle red ya black colour ke ho ge jo ka market ko low ma la kar jay ge is candle ka top ma or lower ma koi long shadow ni ho ga.

              3: Is first candel ka close hona ka bad market ma ak gap ay ga ya ak small gap ho ga ya gap ak lower gap ho ga ya is pattern ke first candle ka lower ma ho ga is pattern ma is first candle ka bad gap ka ana bahot zarori ho ga.

              4: Second candle is pattern ke gap ka bad banay ge jab is pattern ke firts ka bad lower ma gap ay ga to is pattern ke second candle is gap ka low sa banay ge or ya ak bullish ke candle ho ge or ya ak long real body candle ho ge jo ka market ma first candle sa lower sa open ho ge is ma market ke price low sa high ke traf jay ge ya takreban first candle ka half yani middle tak reversal ho kar ay ge ya candle is ma market ko downtrend sa uptrend ke traf reversal karna ka kam kara ge.


              TRADING WITH BULLISH BELT HOLD CANDLESTICK PATTERN :


              Is pattern ma traders ko market ka bullish ke traf jana ka signal milta ha. Ya pattern jab banata ha to is market ma downtrend chal raha hota ha or is ma ya pattern jasa he banta ha to ya market ka high ke traf jana ka signal data ha. Is pattern ka strt ma market ma high bear ka pressure chal raha hota ha or market is ma strongly downward ke traf a rahe hote ha or jasa he ya pattern banta ha to is bear ka pressure sa market lower ke traf jate ha or market ma strong bear ka control hota ha. Is pattern ke first cabdle ka bad jo gap ay ga to is ma market ka jo bear ho ga wo lost ho jay ga or market ma bull ka control a jay ga jo market ko lower sa high ke traf reversal kar da ga is ma market bullish ke traf yani uptrend ke traf jay ge is bull ka pressure sa. Jab ya pattern market ma banata ha or is pattern ka banna sa ohalay market ma three ya is sa zada bearish ke candle hote ha to is pattern ka market ko bullish ke traf reversal karna ke jo strength ho ge wo increase kar jay ge or traders ko ak strong bullish ka signal mila ga. Traders is pattern ke second candle ka close hona ka bad is pattern ke nect candle sa is pattern ke conformation kara ga ka kiya market up ma ja rahe ha ya ni or traders is ma buy ke trade ko enter kara ga or stop loss ko is pattern ke second candle ka low ma rakha ga.
              • #8 Collapse

                Re: Bullish Belt-Hold Pattern

                BULLISH BELT HOLD PATTERN :


                Bullish belt hold ak type hote ha candlestick pattern ke ya pattern market ka chart ma jab banta ah to ya pattern market ka downtrend ko end karta ha or market ko reversal karna ka kam karta ha. Ya pattern huma market ma downtrend ka bottom ma banta ha or market is ma downtrend sa uptrend ke traf reversal ho kar jate ha. Ya pattern strong new trend banata ha is ma market bearish sa bullish ke traf reversal ho kar ate ha. Ya pattern huma support level ka near ma dakhna ko milta ha jo market ka bullish reversal ma ak strong strength ko banata ha. Ya pattern jab banay ga to ya do he candle sa mil kar banay ga magar is pattern ka sath is ke previous candlesticks ko bhi dakhna parta ha tab he is pattern ke sai formation ka pata chal ta ha. Ya pattern market ka downtrend yani bearish ka do real body candles sa mil kar banay ga ak bearish or dosre bullish ke candle sa mil kar banay ge jo market ko ak strongly high ke traf reversal kara ge. Ya bullish belt hold candlestick pattern bearish belt hold pattern ka opposite hota ha is bearish belt pattern ma market bullish sa bearish ke traf reversal ho kar ate ha.


                HOW TO IDENTIFY A BULLISH BELT HOLD CANDLESTICK PATTERN :


                Bullish belt hold ko market ka chart ma find karna ka liya in points ko follow karna bahot he zaroori ha :


                1: Jab ya bullish belt hold pattern banay ga to is ma market downward ke traf move karte hoi ja rahe ho ge or market ma strong downtrend chal raha ho ga is downtrend ka lower ma is pattern ke formation ho ge or ya pattern downtrend ko end kara ga or market ko bullish ke traf reversal kara ga.

                2: Is pattern ke jo first candle banay ge wo apna previous trend ko follow karte hoi banay ge is ma market ke price high sa low ke traf jay ge q ka ya ak bearish ke candle ho ge ya candle ak long real body down candle ho ge ya candle red ya black colour ke ho ge jo ka market ko low ma la kar jay ge is candle ka top ma or lower ma koi long shadow ni ho ga.

                3: Is first candel ka close hona ka bad market ma ak gap ay ga ya ak small gap ho ga ya gap ak lower gap ho ga ya is pattern ke first candle ka lower ma ho ga is pattern ma is first candle ka bad gap ka ana bahot zarori ho ga.

                4: Second candle is pattern ke gap ka bad banay ge jab is pattern ke firts ka bad lower ma gap ay ga to is pattern ke second candle is gap ka low sa banay ge or ya ak bullish ke candle ho ge or ya ak long real body candle ho ge jo ka market ma first candle sa lower sa open ho ge is ma market ke price low sa high ke traf jay ge ya takreban first candle ka half yani middle tak reversal ho kar ay ge ya candle is ma market ko downtrend sa uptrend ke traf reversal karna ka kam kara ge.
                Candles Formation


                Bullish Belt-Hold pattern ko kuch trader single pattern jab k ziadda tar trader double candles pattern tasawar kartte hen. Pattern ki pehlee candle aik strong bearish jab k fosree candle aik strong bullish candle hotti hai. Jis ki formation darjazzel tarah se hotti hai;


                1. First Candle: Bullish Belt-Hold pattern ki pehlee candle aik black ya red color main bearish candle hotti hai, jo k previous bearish trend ki taqqat dekhatti hai. Ye candle aik normal size main bantti hai.

                2. Second Candle: Bullish Belt-Hold pattern ki dosree candle aik strong bullish candle hotti hai, jo k pehlee candle se below gap main open hotti hai, aur close pehlee candle k midpoint se above hotti hai. Ye candle aik Bozu candle hotti hai, jis ki down side par koi wick nahi hotti hai.

                Explaination

                Bullish Belt-Hold pattern aik strong bullish trend reversal pattern hai, jo k prices k bottom main bantta hai. Ye pattern two day candles par mushtamil hota hai, jis main pehlee candle aik strong bearish candle hotti hai, jo k market main bearish trend ki mazbotti battati hai. Pattern ki dosree candle aik strong bozu candle hotti hai, jo k pehlee candle se below gap main open hotti hai. Dosree candle color main white/green ya bullish candle hotti hai, jo k pehlee candle k midpoint se above close hotti hai. Bozu candle ki up side par wick to ho saktti hai lekin down side par koi wick nahi honni chaheye.
                Bullish Belt-Hold pattern shape main "Bullish Piercing Line Pattern" aur "Bullish Meeting Line Pattern" se mushabehatt rakhtti hai. Lekin meeting line pattern main dosree bullish candle pehlee candle k closing price par in-line close hotti hai, jab k piercing line pattern main dosree bullish candle k down side par bhi wick ho saktti hai. Bullish Piercing line ki shape Bullish Belt-Hold pattern se ziadda meltti jultti hai. Ye pattern aksar market main waqfa jaise weekend ya hollyday honne ki wajja se bannta hai, jo k market main bulls power dekhatti hai.Dynamic Momentum list marker

                Dear part is marker ko agr mumble achi tra read krein tu mumble ise faida hasil kr sakte hein dynamic power record pointer overbought or oversold states ko sahi krta ha hume is mn buy ki exchange open krni.Hoti ha jab narket dwintrend mn move krein tu hume is mn sell ki substitute open krni hoti ha is tra mumble is business focus okay sign le sakte hein mumble is mn jitna acha value ur understanding le OK kam krein tu kameyab ho sakte hein tecnical appraisal ko be scrutinized krna huge ha is mn .
                Really information

                Dear jaisa k hume pta ha k mumble achi trading tab hey le sakte hein jab acha kam krte hein is mn hume sab se phaly business focus ki improvement ko dekhna hota ha chart pointer ko run down krna hota ba candelstick plan ko disregarded kr okay os OK shocking greeting kameyab exchanging kr sakte hein

                The best technique to Work Dynamic Momentum Index Indicator:

                Ye marker moderate timetime perio principal ziyada km krta hai or market major enthusiastic time period bht km hoty hain ais pointer okay power time 30 or insignificant stretch of time three hoty hain. Ais tahr ye pointer us time ziyada fiery or acha km krta hai jb costs guide or resistance stage py pounch OK bht tezi sy circle krti hai ais liye jb mumble ais ko dissect kr k km kren gyen to jb tb he ais ko catch kr skty hain ais liye right estimations hasil krna bht zaruri hai..
                • <a href="https://www.instaforex.org/ru/?x=ruforum">InstaForex</a>
                • #9 Collapse

                  Re: Bullish Belt-Hold Pattern

                  INTRODUCTIONS!!

                  Bullish Belt-Hold patterned two days candlestick par mushtamil hai.. aik bullish trend reversals patterns hai.. jis ko aam tawar par single pattern bhi tasawar kia jata hai, q k pattern ki pehlee candle aik bearish trend ki strong real body wali long black ya bearish candle hotti hai... Patterns ki dosree candle aik strong bullish candle hotti hai.. jo k open pehlee candle k below gap main hotti hai, lekin open bearish candle know real body main hotti hai... Bullish candle aik Marubozu ya Bozu candle hotti hai, q k is k down side par koi bhi shadow ya wock nahi hoti hai.. jab k upward side par shafow acceptable hai..

                  Bullish Belt Hold Pattern*"
                  Bullish Belt Hold patterned aik strong bullish trend reversals pattern hota hai.. jo k prices k bottom main banta hai.. Ye patterns two day candles par mushtamil hota hai.. jis main pehlee candle aik strong bearish candle hotti hai.. jo k market main bearish trend ki mazbotti battati hai. Patterned ki dosree candlestick aik strong bozu candle hotti hai.., jo k pehlee candle se below gap main open hotti hai... Dosree candlestick color main white/green ya bullish candle hoti hai.. jo k pehlee candle k midpoint se above close hotti hai. Bozu candle ki up side par wick to ho saktti hai lekin down side par koi wick nahi honni chaheye...

                  Candle Information:


                  Bullish Belt Hold patterns shape main "Bullish Piercing Line Pattern" aur "Bullish Meeting Line Pattern" se mushabehatt rakhtti hai... Lekin meeting line patterned main dosree bullish candle pehlee candle k closing price par in-line close hotti hai.. jab k piercing line patterned main dosree bullish candle k down side par bhi wick ho saktti hai... Bullish Piercing line ki shape Bullish Belt-Hold pattern se ziadda meltti jultti hai... Ye patterned aksar market main waqfa jaise weekend ya hollyday honne ki wajja se bannta hai, jo k market main bulls power dekhatti hai...

                  اب آن لائن

                  Working...
                  X