Dear friends forex trading mein candlestick chart pattern ko bahut hi aihmiat hasil hai candlestick chart pattern ki madad se Hamad trading karne mein main aur trading ko samajhne mein bahut hi madad milati hai in candlesticks mein different types ki candlesticks hoti hain Jo ke muktalif patterns ko create karti Hain agar aap candlesticks ki characteristics ko soch samajh Kar trading karenge to aapko bahut hi accha profit hasil ho sakta hai
-
AynSenior Member

- Aug 2020
- 3754
- 1727
- 700
- 2 635 USD
-
<a href="https://www.instaforex.org/ru/?x=ruforum">InstaForex</a> -
Tanimalik600Banned
- May 2021
- 110
- 1
- 298
- 19 USD
Re: Candlestick pattern kya hote Hain
Dear forex Memebers forex trading mein jo candle stick hoti hein un ky 2 color hum ko show ho rhy hoty hein ik white and second red white ka mtlb market upr move kr rhe hai aur red ka mtlb market down ja rhe hai. -
AbubakarbhattiMember
- Apr 2021
- 68
- 1
- 89
Re: Candlestick pattern kya hote Hain
Assalamu alekum.... tnks all members..... ummid Hai Sab forex members mehnat se kam kar rahi hun gay aur theek Honge ji han bilkul aapki baat theek hai hai mehnat mein hi azmate hai mehnat se hi kamyabi milati hai agar Ham mehnat Karenge To Ham Kamyab Honge Agar Hamen Nahin Karenge To Ham Kamyab Nahin ho sakte a kamyabi ka Daru Mein Dhaar mehnat per hai .........Hamen Har Hal Mein mehnat Karte Rahana chahie Ham jitni Jyada mehnat Karenge Hamen usmein Hath ka utna hi jyada fayda hoga Hamen chahie ki ham Din Raat kam Karen .....Forex per trading ke bare mein jyada Se Jyada learning Karen aur forex per dusron Ke knowledge se fayda uthaya aur apne a knowledge ko increase Karen Ham Ek dusre ki help karte hue fore pr Taraki kar sakte hain ...Thanks to all members... -
Pari-nSenior Member
- Aug 2019
- 869
- 317
- 156
- 190 USD
Re: Candlestick pattern kya hote Hain
Dear Forex me traders k liye zaroori ha k usy candle stick patten ana chahye aur trading start karny se pehly candals ka basic knowledge hona bahut zaroori ha kyun k candles ki diffrent shakal hoti hain aur har candal doosri se diffrent hoti ha aur har candal market ki next movement ka idea deti ha jis se hamyn trading mein help milti ha is liye japanies candle stick pattren seekhna bahut zaroori ha har trader k liye kyun k chart open karyn gy tu hamyn diffrent candles nazar ayn gi aur agar candels ka knowledge ni hoga tu ham analysis ni kar sakyn gy.is liye koi e book se ya seminor attend kar k candles k bary learning hasil kar leni chahye ta k trading mein asani ho.magar ais se phly ap ko ye lazmi pata hona chaye k jo candle ap k samny ban rahe hai ais ka open close kai hai aor ais ka high aor low kaisy check karty hai aus k baad ais market mai candle stick patter ko learn kary kun k jab ap ko market mai trade banani hoti hai to aus time ap simple candle dekh k trade ni bana sakty hai aus k liay ap ko sath koi aor cheaz zarort hoti hai jaisy ya ap koi indicator use karty hai ya ap ko candle stick pattern ka pata hona chaye aus mai ye hai k ap ko jo trade milti hai wo acha reslt deti hai agar ap ko candle stick pattern ki samjh ni aati to behatar hai -
Kamran746Senior Member
- Jun 2020
- 1057
- 130
- 411
- 214 USD
Re: Candlestick pattern kya hote Hain
Forex Chart pr jo candles bnti hn to un mn kuch candles aisi bi hoti hn k jo ek sath 3,4 lagtar bnti hn, esko pattern kehty hn. Pattern ka ye faida hota h k jb hum koi ek start wali candle identify mr lety hn to us time ye confirm hota h k next 2,3 candles bi same direction mn hun gi aur estrh hum correct trade lga kr acha profit earn kr dkty hn. Aisy trade mn risk mn less hota h q k mostly traders bi same direction ko follow kr rhy hoty hn. -
muazmahanifSenior Member
- Oct 2019
- 678
- 2005
- 4313
- 1 555 USD
Re: Candlestick pattern kya hote Hain
je han belkul hamen forex mein ache ce mehnaat say kam karna chihay ager hamen trade bhe ache ce lagani hey t hamen zyada ache mehnaat say kaam karna chihay hamen market ko analysis karna chihay r ache mehnaat say experience kay sath kaam karna chihay hamen trade bhe ache learning kay sath sath active mind kay sath karni chihay or ham log jetna acha kaam karen gay t he ham log forex say otni he ache earning hasel kar saken gayدیتے جائیںThanksحوصلہ افزائی کے لیے -
Ehtisham-AhmadSenior Member
- Aug 2020
- 3392
- 30
- 826
- 1 320 USD
Re: Candlestick pattern kya hote Hain
Forex trading me market ki moment Ke Sath Jo candles Banti Hain unhen Ham candlesticks Kahate Hain aur yah candlesticks aapko market ki movement ke bare mein batate hain Jab aap candlesticks ko different time per uske andar study karte hain to aapko bahut help milati hai aur aap ko market ka trend Ka Pata Chalta Hai aur jab aap us trend ko follow karte hue trade Karte Hain To aapki profit earning ratio increased Hoti Hai candlestick ka knowledge Forex trading Mein basic knowledge hai success Hasil karne ke liye candlestick ke knowledge ke bagair of Forex trading Mein Kabhi Bhi kamyab Nahin ho sakte -
Noormuhammad5Senior Member
- Apr 2021
- 759
- 5
- 413
- 24 USD
Re: Candlestick pattern kya hote Hain
Hamen agar achy tarah say trading karny hy ur hamen trading men acha profit hasil karna hy tu hamen as men kotahy kay sath trading nahin karny chahey kun aky agar hum candle ko dekh kar achy trading karty hian tu hum kamyab ho jaty hain ur agar hum candle koo dekh kar as men trading nahin karty hian tu hum nakam ho jaty hain ur hum kabhy bhe as men achy earning hasil nahin kar sakty hain -
M-ArishSenior Member
- Jan 2021
- 2924
- 10
- 213
- 625 USD
Re: Candlestick pattern kya hote Hain
Assalam Walekum ummid hai aap sab khariyat sy Honge aur mehnat Karke kamyabi Hasil kr rahe Hoon ge Jab Ham Karte Hain To candlestick pattern ko use Karke acche tarike se analyse kar sakte hainDemo count practice ke liye best account hai agar Ham demo account per Jyada Se Jyada practis Karte Hain To Hamara knowledge or experience increased hota hai aur Hamen kam karne mein kisi difficulty ka Samna nahin karna padta Jo log demo account per practice Nahin karte hain aur direct Forex trading ke real account per kam karna start kar dete Hain unko difficulties Ka Samna karna padta hai Ham demo account per Jitna Jyada time spent karte hain Itna jyada hi Hamara knowledge or experience increased hota hai aur Hamare kam karne ki speed Mein increase hoti hai isiliye Hamen demo account per Jyada Se Jyada practice karni chahie aur apne time ko West nahin karna chahie Ban Ke Hamen Apna time Forex trading per send karna chahie To Ham Apna future banaa sakte hain Ham main market analysis Karke hi trading Karni chahie -
pipcollectorsSenior Member
- Oct 2017
- 8235
- 1
- 1332
- 437 USD
Dear yeh bat samaj lain kay candlestick koi pattern nahi hai. ap candlestick laga kay us sy pattern find kar sakty hain. Candlestick ap ko simple har time frame jo ap nay set kiya hota hai us har candle kay bary main batati hai kay trade kitny time kay leye ap ki open howi hai or jo open ki hai us ki opening price, closing price, high or low kitna tha us sy yeh ap ko pata chalta hai baqi ap es ka sahi use pattern find kar kay achi earning kar sakty hain.اصل پيغام ارسال کردہ از: Noormuhammad5 پيغام ديکھيے -
Developer420Senior Member
- Nov 2023
- 163
- 102
- 31
- 138 USD
Candlestick patterns, technical analysis mein istemal hone wale graphical representations hain jo price action ko darust karne ke liye istemal hoti hain. Har candlestick ek specific time period (jese ke 1 minute, 1 hour, 1 day) ke price movement ko darust karti hai, aur inki shapes aur combinations se traders ko market ki future movement ka andaza lagane mein madad milti hai.

Candlestick patterns ka basic structure hota hai ek "candle" ka, jo ke do parts se milta hai:
Body (Badan): Yeh rectangle ya square-shaped area hoti hai jo opening aur closing prices ko darust karti hai. Agar closing price opening price se zyada hai, to candle ka body usually white (ya green) hota hai, aur agar opening price closing price se zyada hai, to candle ka body usually black (ya red) hota hai.
Wicks (Chotiyan): Yeh lines hoti hain jo body ke dono ends se extend hoti hain. Inko "upper wick" aur "lower wick" kehte hain. Upper wick high price ko represent karta hai aur lower wick low price ko.
Yahan kuch common candlestick patterns hain:
Doji: Doji ek pattern hai jismein opening aur closing prices aapas mein bohot qareeb hoti hain, aur iska body bohot chhota hota hai. Yeh indicate karta hai ke market mein indecision hai.
Hammer: Hammer pattern ek bullish reversal signal hota hai. Ismein ek chhota body hota hai aur bada lower wick, jo indicate karta hai ke market mein initial selling hui thi, lekin phir buyers ne control le liya.
Shooting Star: Shooting star pattern ek bearish reversal signal hota hai. Ismein ek chhota body hota hai aur bada upper wick, jo indicate karta hai ke market mein initial buying hui thi, lekin phir sellers ne control le liya.
Bullish Engulfing: Bullish engulfing ek bullish reversal pattern hota hai. Ismein ek small bearish candle ke baad aata hai ek bada bullish candle, jiska body puri tarah se pehle candle ko engulf kar leta hai.
Bearish Engulfing: Bearish engulfing ek bearish reversal pattern hota hai. Ismein ek small bullish candle ke baad aata hai ek bada bearish candle, jiska body puri tarah se pehle candle ko engulf kar leta hai.
Yeh sirf kuchh basic candlestick patterns hain aur market mein aur bhi patterns hote hain. Traders in patterns ka istemal karke price movements ka analysis karte hain aur apne trading decisions ko inform karte hain. Hamesha yaad rahe ke candlestick patterns ke interpretation mein experience aur thorough analysis ki zarurat hoti hai. -
Asim5Senior Member
- Aug 2023
- 830
- 33
- 173
- 325 USD
Candlestick pattern kya hote hain
Candlestick patterns technical analysis ka ek hissa hain aur ye financial markets, jaise ki stock market, forex market, aur commodities market mein price movements ko analyze karne ke liye istemal hote hain. Candlestick patterns visually market sentiment ko represent karte hain, aur traders ko price movement ke future possibilities ke bare mein anuman lagane mein madad karte hain.
Candlestick patterns do parts se milte hain: "candle" aur "pattern."- Candle (Candlestick): Ek candle ek specific time period ke price movement ko darust karta hai. Har candle ke paas 4 prices hoti hain - opening price, closing price, high price, aur low price. Candlestick ke body ka size opening aur closing price ke beech ka difference darust karta hai. Candle ke upper aur lower parts ko "wicks" ya "shadows" kaha jata hai, jo high aur low prices ko represent karte hain.
- Pattern: Candlestick patterns tab bante hain jab kai consecutive candles ek specific arrangement mein aate hain. In patterns ko dekhte hue traders market direction aur future price movements ka anuman lagate hain.
Kuch pramukh candlestick patterns hain:- Doji: Ek Doji pattern tab banta hai jab opening aur closing price ek dusre ke bohot kareeb hoti hain, aur iski body chhoti hoti hai. Ye indecision market sentiment ko darust karta hai.
- Engulfing Patterns: Bullish engulfing aur bearish engulfing patterns me ek candle doosre candle ko puri tarah se cover karta hai, indicating a potential reversal.
- Hammer aur Hanging Man: Ye patterns ek lambi wick ke sath aane wale candles hote hain aur market reversal ko darust karte hain.
- Head and Shoulders: Head and shoulders pattern ek trend reversal pattern hai, jisme ek peak (head) aur do smaller peaks (shoulders) hote hain.
- Double Top aur Double Bottom: Ye patterns ek market trend ke reversal ko darust karte hain, jab price ek level par do baar stop hoti hai.
In patterns ka istemal traders market analysis mein karte hain aur inka combination ek trading strategy bhi banate hain. Hamesha yaad rahe ke candlestick patterns bhi market analysis ka ek hissa hai, aur har pattern ko bina doosre factors ke dekhe, jaise ki trend, volume, aur economic indicators, par pura bharosa nahi karna chahiye.
-
Asim14Senior Member
- Sep 2023
- 794
- 25
- 185
- 326 USD
Candlestick pattern kya hote hain
Candlestick patterns, ya bas candle patterns, ek aise technical analysis ka tareeqa hain jo traders aur investors istemal karte hain taake woh price charts ko samajh sakein. Ye patterns individual bars ya candles se bante hain, jo ke price chart par hoti hain. Har candlestick ek khaas waqt ko darust karte hain, jaise ke ek din, aur ismein open, high, low, aur close prices ke baare mein malumat hoti hai.
Candlestick patterns market ki jazbat aur potential price movements ko samajhne ke liye ahem tools hote hain. Bohat se aise patterns hain, har ek apni alag ahmiyat ke sath.
Yahan kuch aam candlestick patterns hain:- Doji: Ye pattern tab banta hai jab open aur close prices lagbhag barabar hoti hain. Ye market mein uncertainty ko darust karti hai aur mumkin hai ke iska matlab ho ke market mein palat aanay ki sambhavna hai.
- Hammer aur Hanging Man: Ye single candlestick patterns hain jinke lambi lower shadows aur chhoti real bodies hoti hain. Hammer downtrend ke baad ata hai aur ek ummed hai ke market palat jaye. Hanging man uptrend ke baad hota hai aur yeh market mein palat jane ki sambhavna dikhata hai.
- Engulfing Patterns: Bullish engulfing pattern tab banta hai jab ek chhoti bearish candle ke baad ek badi bullish candle aati hai, jo puri tarah se pehli candle ko "engulf" kar leti hai. Bearish engulfing pattern ulta hota hai.
- Morning Star aur Evening Star: Ye teen-candle reversal patterns hote hain. Morning star mein pehle ek bada bearish candle hota hai, phir ek chhoti candle, aur phir ek badi bullish candle. Evening star mein ye ulta hota hai aur ye ek bearish reversal ko darust kar sakta hai.
- Head aur Shoulders: Ye ek single candlestick nahi hai, lekin head aur shoulders pattern mein teen chhoti choti choti choti chhoti peaks hoti hain—ek ziada uncha (head) do kam unche peaks (shoulders) ke darmiyan. Ye ek potential trend reversal ko darust kar sakta hai.
Candlestick patterns ka istemal kar ke traders aur investors market ki raushan mein roshni dalte hain aur potential price movements ko samajhte hain. Ye ek ahem tool hai jo market ke mizaj ko samajhne mein madad karta hai. -
<a href="https://www.instaforex.org/ru/?x=ruforum">InstaForex</a> -
KamalkamiSenior Member
- Oct 2022
- 148
- 1
- 15
- 79 USD
candle stuck patteren Nami maliyati takneeki tajzia ka tool rozana qeemat ki naqal o harkat ke data ko graphi tor par display karne ke liye candle stuck chart ka istemaal karta hai. aik maliyati chart jisay candle stuck chart ke naam se jana jata hai, krnsyon, sikyortiz aur moshtqat ki qeematon ki naqal o harkat ko patteren ke tor par dekhata hai .

chunkay candle stuck patteren aam tor par aik din ki qeemat ki harkat ko zahir karte hain, is liye aik mahinay mein taqreeban 20 tijarti din hotay hain jin mein 20 mukhtalif mom batii ke patteren hotay hain. woh kaar amad hain kyunkay woh maazi ki qeematon ke rujhanaat ki bunyaad par mustaqbil ki market ki qeematon ki naqal o harkat ko paish karne mein tajzia karon ki madad karte hain .
miqdaar ke lehaaz se, abhi tak 42 tasleem shuda mom batii ke namoonay hain. jo sab ko mazeed bunyadi aur paicheeda namonon mein taqseem kya gaya hai
Understanding Candlestick Patterns
maali takneeki tajzia mein mahaarat haasil karne ke liye kaafi miqdaar mein taleem aur tajarbay ki zaroorat hoti hai. cheezon ko saada rakhnay ke liye, hum candle stuck charts ki jaanch karte waqt dekhnay ke liye bunyadi namonon par baat karen ge aur yeh ke woh qeemat mein honay wali tabdeelion ki pishin goi kaisay kar satke hain .
har patteren ke mzmrat ko daryaft karne se pehlay mandi aur taizi ke patteren ke darmiyan farq ko pehchanana zaroori hai. bloomberg, misaal ke tor par, surkh rang mein bearish patteren aur sabz mein taizi ke patteren dekhata hai .
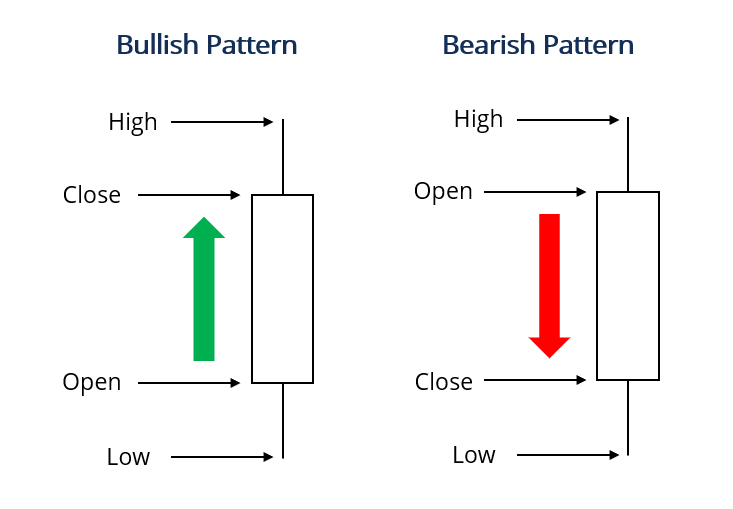
Bearish Patterns
candle stuck patteren ki aik qisam jisay" bearish patteren" kaha jata hai is waqt hota hai jab is muddat ke liye stock ki ikhtitami qeemat is ki ibtidayi qeemat se kam thi. qeemat mein kami ka mafrooza sarmaya car ko farokht karne ke liye fori dabao mehsoos karne ka sabab bantaa hai .
Bullish Patterns
candle stuck patteren ko taizi ke tor par darja bandi kya jata hai jab kisi muqarara muddat ke douran stock ki ikhtitami qeemat is ki ibtidayi qeemat se tajawaz kar jati hai. qeemat mein mazeed izafay ke imkaan ki wajah se sarmaya car ko kharidari ke dabao mein dala jata hai .
اب آن لائن
Working...
تبصرہ
Расширенный режим Обычный режим