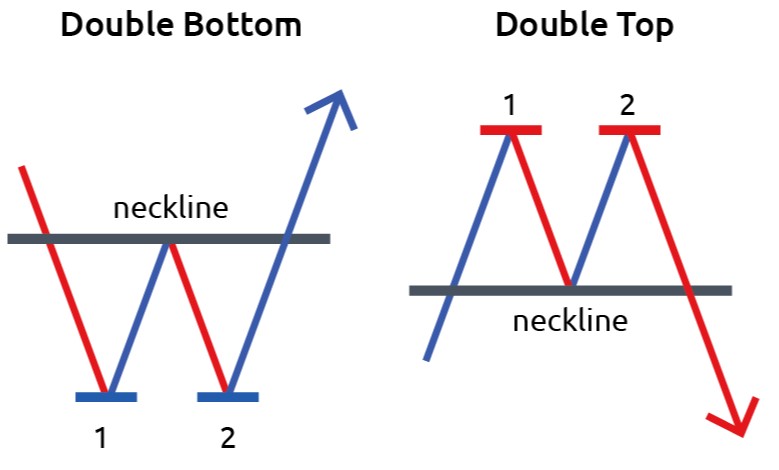
Market ki top aur bottom lines

No announcement yet.
`
X
  • وقت
  • دکھائیں
Clear All
new posts
  • #1 Collapse

    Market ki top aur bottom lines
    Technical analysis key base par hi traders market key top aur bottom lines ko identify kar sakty hey es key ley sab se best aur perfect trading indicators ka intekham karna bahot ehmeyat rakty hey, market key top aur bottom lines ko 2 hi indicators esy hey jo key behtar tareeqy se identify karny ki quality rakty hey, ye 2 indicators ye hey,

    1. Support and resistance level
    2. RSI indicator.
  • <a href="https://www.instaforex.org/ru/?x=ruforum">InstaForex</a>
  • #2 Collapse

    Re: Market ki top aur bottom lines

    اصل پيغام ارسال کردہ از: aamir370 پيغام ديکھيے
    Technical analysis key base par hi traders market key top aur bottom lines ko identify kar sakty hey es key ley sab se best aur perfect trading indicators ka intekham karna bahot ehmeyat rakty hey, market key top aur bottom lines ko 2 hi indicators esy hey jo key behtar tareeqy se identify karny ki quality rakty hey, ye 2 indicators ye hey,

    1. Support and resistance level

    2. RSI indicator.
    Aoa bhai bht achi post ki apnay or acha laga apnay apna experience shar kya thanku achi post ha apki market ki top aur bottom lines technical analysis key base par hi traders market key top aur bottom lines ko identify kar sakty hey es key ley sab se best aur perfect trading indicaters ka intekham karan bahot ehmeyad rakty hey market key top aur bottom lines ko 2 hi indicaters way hey behtar tareeqy se identify karny ki quality rakty hey ye 2 indicator ye heya nic post
     
    • #3 Collapse

      Re: Market ki top aur bottom lines

      Dear g hanaapane bahut hi acchi knowledge ko kya karne ka knowledge question karne ki koshish Kiya hai ismein humko chahie kya gram kamyab hona chahte Hain to ismein humko market ke vakya mein top or bottom mein quantity quality ko dekh kar ke hi aage ki Jana jaane ke bare mein kya karna hoga ismein humko kabhi bhi apne kam ko hurry up ke sath nahin karna hoga ismein humko chahie hoga Kya main isko acche se analysis karle ki agar market is tension mein aati hai tu kahan tak ja sakti hai aur agar instruction mein aati hai to kahan tak ja sakte sach mein aapka apna Kam ko kabhi please call karke School ganaur nahin karna hoga ismein humko itihaas ke sath apne kam ko acche se achcha karke hi aage kitna nav jaane ke bare mein kya karna hoga ISI mein hamari sabse badi kamyabi mumkin ho sakti aage ki janm 6 karke usko improve karne ki sahi si mein humko mehnat ke sath apne kam ko jaruragar Ham chahte Hain ki Ham aage ki janaja karke khud ko battery se battery bana sake to.
      • #4 Collapse

        Re: Market ki top aur bottom lines

        اصل پيغام ارسال کردہ از: aamir370 پيغام ديکھيے
        Technical analysis key base par hi traders market key top aur bottom lines ko identify kar sakty hey es key ley sab se best aur perfect trading indicators ka intekham karna bahot ehmeyat rakty hey, market key top aur bottom lines ko 2 hi indicators esy hey jo key behtar tareeqy se identify karny ki quality rakty hey, ye 2 indicators ye hey,

        1. Support and resistance level


        2. RSI indicator.
        Thanku nic post bhai apnay market ki top aur bottom lines ki shar kya apki waja sy hum logo ko bht zada experience milta ha or tarnig hasil huti ha achi post kea acha topic ha 111111 support and resistance
        22..RSl indicated God bhai
         
        • #5 Collapse

          Re: Market ki top aur bottom lines

          Asalam O Alikum. Bhai apki post boht informative thi top and bottoms line of forex k according jis k 2 indicators hein jo analysis k liye use kiye jaty hein doni indicator identify kr rhy hoty hein market k top and bottom indicator ko so in ko samjhna bht zruri h resistance jitni achi o gi lines utni kamal ki hun gi
          • #6 Collapse

            Re: Market ki top aur bottom lines

            Assalamu alaikum dear friend jab Ham market mein top aur bottom line check karna ho sabse pahle market ke analysis krna chain top aur bottom lines inductor se identify Kya jata hai jata hai Kahan per hamain top lines use krny hai aur Kahan per bottom lines use krna hai as kialy him indicator use krty hai phr him market ko samajh part hai
            • #7 Collapse

              Re: Market ki top aur bottom lines

              market jub bar bar aik ho point ko hit kerti ha tu in points per trading kerny ko bhtreen entry samjha jata ah humain soch samjh ker trading kerni chahiy humain tamam pairs k support aur resistence points ki pahchan honi chahiy is se humain faisda ho sakta ha ager hum kisi pair k mid main trade kerty ahn tu is se humain koi faida nhi bht bara loss ho jata ha.
              • #8 Collapse

                Re: Market ki top aur bottom lines

                hamy market ko achy sy samj kar he kam karna ho ga agar hum is main bagar experience ky kam kary gy to hamy loss ho ga hamy loss hony ke waja ko sahe kar ky he kamyabe hasil hote hain market ke movement up or down hote he rahte hain jab market ke movement up ho to hamy is man trade lagane chahey agar market ke movement down ho to hamy osmain trade nahe lagane chahey yai aik legal karobar han
                • #9 Collapse

                  MARKET KI BOTTOM AUR TOP LINES:-
                  Market ki "top line" aur "bottom line" finance terminology mein istemal hoti hai. Ye terms company ke financial performance ko describe karne ke liye istemal hoti hain.
                  MARKET KI TOP ki WAZAHAT:-
                  Top line, bhi sales ya revenue line ke roop mein jaani jaati hai. Iska mukhya uddeshya company ki overall revenue ya sales ko darust karne mein madad karna hota hai. Yadi ek company ke top line mein vriddhi hoti hai, toh iska matlab hai ki company ke sales ya revenue mein vriddhi hui hai. Yeh vriddhi naye customers ke prapti, existing customers se adhik business karne ya mool samagri ke moolya mein vriddhi ke karan ho sakti hai. Top line company ki gross income ya gross revenue ko darust karta hai, lekin yeh profit ya kamai ko nahi darust karta hai.
                  MARKET KI BOTTOM KI WAZAHAT:-
                  Bottom line, net income ya profit line ke roop mein jaani jaati hai. Iska mukhya uddeshya company ke sachaii net profit ko darust karne mein madad karna hota hai. Yadi ek company ke bottom line mein vriddhi hoti hai, toh iska matlab hai ki company ne apne operating expenses, interest, taxes, aur anya kharchon ko kam kiya aur net profit badhaya hai. Bottom line financial health ke prati ek mahatvapurna indicator hota hai, kyun ki yeh dikhata hai ki company ke baadshahat ke baad bhi kitni kamai bachti hai. In dono lines ke bina, ek company apne performance ko samjhna aur uske improvement areas ko pehchanna mushkil ho sakta hai. Top line aur bottom line ke saath-saath, financial analysts aur investors doosre financial metrics jaise ki operating profit margin, net profit margin, cash flow, aur return on investment (ROI) ko bhi dekhte hain company ki overall financial health ko evaluate karne ke liye.
                  • #10 Collapse


                    Market ki top aur bottom lines

                    Mukhtasar Tareekh

                    Market ki top aur bottom lines, jise bazaar ke logon ne mukhtalif tareeqon se istemal kiya hai, samajhne ki ek aham haisiyat rakhti hai. Yeh tajziya aur tajziyaati soch ke ek hisse ki tarah hai, jo ke bazaar ke hissedaaron ko unke faislon aur karobaaron mein madad faraham karta hai.


                    Click image for larger version

Name:	S67.jpg
Views:	35
Size:	12.4 کلوبائٹ
ID:	12856552


                    Top aur Bottom Lines ki Tafseelat

                    Top aur bottom lines, yaad rahe ke yeh mukhtalif asbaaq mein istemal hoti hain. Inke asal maqsad ko samajhne ke liye, hume dono ke tareeqon par ghoor karna chahiye:

                    Top Line: Top line, aksar ek business ya corporation ke ghareebi waafirai ki daleel hoti hai. Yeh gross revenue ya sales ke taqreeban hoti hai, jo ke kisi muddat ke doran ek business ya corporation ne kamaya hota hai. Top line, ek company ki takhleeqati mizaji ko nihayat saaf dhang se darust kar sakti hai.

                    Bottom Line: Bottom line, doosri taraf, ek company ya business ke net income ko darust karta hai. Yeh company ke karobaar aur kharid o farokht ke faidde aur nuqsanat ko shamil karta hai, sath hi kisi muddat ke doran munsalik kardar ko bhi nishana bana sakta hai. Bottom line, ek business ke karkardgi aur mali halat ko darust andaz mein samajhne mein madadgar hoti hai.

                    Top aur Bottom Lines ke Tareeqe

                    Top aur bottom lines ke tareeqe, mukhtalif industries aur corporations ke liye mukhtalif ho sakte hain. Kuch log sirf financial statements ko dekhte hain, jab ke doosre yeh jaanne ki koshish karte hain ke kya khaas mojudgiyan hain jo top ya bottom lines ko mutasir kar sakti hain.

                    Top Line Analysis: Top line analysis, sales trends, market share, aur pricing strategies ke dhuwaan daal sakti hai. Agar ek company ne apne sales ko barhaya hai, toh yeh uski bhaari top line growth ki taraf ishara karta hai. Iske ilawa, market competition aur customer preferences ko samajhne ka bhi yeh aham tareeqa hai.

                    Bottom Line Analysis: Bottom line analysis, operational efficiency, cost management, aur profit margins par zor deta hai. Ek company jo apne expenses ko kam karte hue apne net income ko barha rahi hai, woh bottom line mein improvement darust karti hai. Cost-cutting measures, operational improvements, aur revenue diversification, sab is tareeqe ke andar aate hain.

                    Top aur Bottom Lines ka Takhmeen

                    Top aur bottom lines ka takhmeen karna, kisi bhi business ke liye asaan nahi hota. Yeh ek mushkil aur maharat ki darkhwast karti hai. Aik waqt ke baad, kuch business analysts aur investors, ek company ki health ko evaluate karne ke liye top aur bottom lines ko ek saath dekhte hain. Yeh unhein ek mukhtasir tasveer faraham karta hai ke ek company ke karkardgi aur mali halat kaisi hai.

                    Top aur Bottom Lines ka asal Maqsad

                    Top aur bottom lines ka asal maqsad, ek business ya corporation ke performance aur mali halat ko samajhna hai. In dono parameters ki sahih samajh, investors, executives, aur managers ko future ke liye strategy banane mein madadgar sabit hoti hai.

                    Nateeja

                    Market ki top aur bottom lines, ek business ke mizaji tajziya aur samajhne ka aham hissa hain. Inka theek se samajhna, ek company ke taraqqi o izaafi ko darust tareeqe se darust karta hai. Is liye, top aur bottom lines ko samajhne aur samjhaane ki ahamiyat ko kabhi bhi na ghataiye.
                    • #11 Collapse


                      Market ki top aur bottom lines ko samajhna ek mazboot trading analysis ke liye zaroori hai. Yeh concepts traders ko market ke trend aur potential reversals ke bare mein insight dete hain, jo ki trading decisions ko improve karte hain.


                      Top Line


                      Top line market ke highest points ko represent karti hai, jo ke ek uptrend ke dauraan reach kiye gaye hote hain. Jab market top line ke paas pahunchta hai, yeh ek potential resistance level create karta hai, jahan se price phir se neeche ja sakta hai. Top line ko samajhne ke liye, traders ko price charts ko analyze karna chahiye, jaise ke line charts, bar charts, ya candlestick charts. Is tarah se, traders top line ko identify kar sakte hain aur trading strategies ko uske according adjust kar sakte hain.


                      Bottom Line


                      Bottom line market ke lowest points ko represent karti hai, jo ke ek downtrend ke dauraan reach kiye gaye hote hain. Jab market bottom line ke paas pahunchta hai, yeh ek potential support level create karta hai, jahan se price phir se upar ja sakta hai. Bottom line ko samajhne ke liye, traders ko price charts ko analyze karna chahiye aur downtrend ke points ko identify karna chahiye. Is tarah se, traders bottom line ko spot karke trading strategies ko implement kar sakte hain.


                      Trading Analysis Ko Mazboot Kaise Karein


                      Price Action Analysis: Market ki top aur bottom lines ko analyze karne ke liye, price action analysis ka istemal kiya ja sakta hai. Price action analysis mein, traders price charts ko dekhte hain aur price ke patterns, trends, aur key levels ko identify karte hain. Is tarah se, traders market ki top aur bottom lines ko spot kar sakte hain aur trading decisions ko mazboot kar sakte hain.


                      Technical Indicators Ka Istemal: Trading analysis ko mazboot karne ke liye, technical indicators ka bhi istemal kiya ja sakta hai. Indicators jaise ke moving averages, RSI (Relative Strength Index), aur MACD (Moving Average Convergence Divergence) market trends aur reversals ko identify karne mein madad karte hain. Traders in indicators ka istemal karke market ki top aur bottom lines ko confirm kar sakte hain aur trading strategies ko improve kar sakte hain.


                      Risk Management: Trading analysis ko mazboot karne ka ek aur tareeqa risk management hai. Traders ko apne trades ko manage karte waqt stop-loss orders aur position sizing ka istemal karna chahiye. Is tarah se, traders apne losses ko control kar sakte hain aur trading performance ko improve kar sakte hain.


                      Note


                      Market ki top aur bottom lines ko samajhna aur analyze karna ek mazboot trading analysis ke liye zaroori hai. Traders ko price action analysis, technical indicators, aur risk management ka istemal karke apne trading strategies ko mazboot karne chahiye. Is tarah se, traders market ke movements ko samajh sakte hain aur profitable trading decisions le sakte hain.


                      There is a time to go long, a time to go short and a time to go fishing.
                      ​​​​​​​

                      ​​​​​​​
                      • #12 Collapse

                        Market ki trading aur investing ki duniya mein, top line aur bottom line do important financial metrics hain jo kisi company ke financial health aur performance ko assess karne mein madad karti hain. Yeh terms zyadatar financial statements aur reports mein use hoti hain, aur investors aur traders inhein apni decision-making process mein consider karte hain.


                        Top Line
                        Top Line ka matlab hota hai kisi company ka total revenue ya gross sales. Yeh financial statement ke top mein mention hota hai, is liye isay top line kaha jata hai. Top line se humein yeh pata chalta hai ke ek specific period mein company ne kitni sales generate ki hain. Yeh metric company ki sales performance ko reflect karta hai aur directly indicate karta hai ke company ka business kaisa chal raha hai.

                        Top Line Calculation
                        Top line ko calculate karne ke liye, hum simply company ke total sales ko sum karte hain. Formula kuch is tarah hota hai:

                        Top Line=Gross Sales−Sales Returns−Discounts\text{Top Line} = \text{Gross Sales} - \text{Sales Returns} - \text{Discounts}Top Line=Gross Sales−Sales Returns−Discounts

                        Importance of Top Line
                        1. Growth Indicator: Top line se humein company ki growth ka pata chalta hai. Agar top line barh rahi hai, to iska matlab hai ke company ka business expand ho raha hai aur zyada sales ho rahi hain.
                        2. Market Share: Higher top line ka matlab hai ke company market mein apna share barha rahi hai. Yeh potential investors ke liye attractive hota hai.
                        3. Performance Measurement: Top line ek primary metric hai jo company ki overall performance ko measure karne ke liye use hoti hai. Yeh management ko batati hai ke unki marketing aur sales strategies kitni effective hain.
                        4. Benchmarking: Top line ko industry peers ke sath compare karne se humein company ki market position ka pata chalta hai.
                        Bottom Line
                        Bottom Line se muraad hai net profit ya net income. Yeh financial statement ke bottom mein mention hota hai, is liye isay bottom line kaha jata hai. Bottom line indicate karta hai ke company ne apni total revenues se saare expenses deduct karne ke baad kitna profit generate kiya hai. Yeh company ki profitability aur financial health ka sabse accurate indicator hai.

                        Bottom Line Calculation
                        Bottom line ko calculate karne ke liye, hum total revenue se saare expenses ko deduct karte hain. Formula kuch is tarah hota hai:

                        Bottom Line=Total Revenue−Total Expenses\text{Bottom Line} = \text{Total Revenue} - \text{Total Expenses}Bottom Line=Total Revenue−Total Expenses

                        Yahan total expenses mein operating expenses, interest, taxes, depreciation, aur amortization waghera shamil hote hain.

                        Importance of Bottom Line
                        1. Profitability Indicator: Bottom line se humein company ki profitability ka pata chalta hai. Yeh investors ko yeh batata hai ke company apne business operations se kitna actual profit generate kar rahi hai.
                        2. Financial Health: Bottom line company ki overall financial health ko reflect karta hai. Higher bottom line ka matlab hai ke company financially stable hai aur uski growth sustainable hai.
                        3. Investor Confidence: Investors zyadatar companies mein invest karte waqt bottom line ko consider karte hain. Higher net income investors ke confidence ko boost karti hai aur share prices mein bhi positive impact daal sakti hai.
                        4. Dividend Distribution: Bottom line ka relation directly dividend distribution se hota hai. Higher net income ka matlab hai ke company shareholders ko zyada dividends de sakti hai.
                        5. Operational Efficiency: Bottom line ko analyze karne se company ki operational efficiency ka bhi pata chalta hai. Agar bottom line improve ho rahi hai, to iska matlab hai ke company effectively apne costs ko manage kar rahi hai.
                        Top Line aur Bottom Line ka Comparison aur Analysis

                        Revenue Growth vs. Profit Growth
                        Ek successful business ke liye zaroori hai ke woh apni top line aur bottom line dono ko balance kare. Top line growth se indicate hota hai ke company apne market share ko barha rahi hai, lekin sirf top line growth alone enough nahi hoti. Agar expenses bhi proportionately barh rahe hain, to bottom line pe impact negative ho sakta hai. Is liye, revenue growth ke sath-sath cost management aur operational efficiency bhi zaroori hai taake bottom line improve ho sake.

                        Impact of Expenses on Bottom Line
                        Top line increase hone ke bawajood, agar company ke expenses bhi barh rahe hain, to bottom line negatively impact ho sakti hai. Is liye, company ko apne operational costs, marketing expenses, administrative expenses, aur other overheads ko effectively manage karna padta hai. Effective cost control aur expense management bottom line ko improve kar sakti hain.

                        Profit Margins
                        Profit margins ko analyze karna bhi important hai. Gross profit margin, operating profit margin, aur net profit margin alag-alag stages pe profitability ko measure karte hain. Yeh margins batate hain ke company apne sales se kitna profit generate kar rahi hai different expense categories ko consider karte hue. Higher profit margins ka matlab hota hai ke company efficient hai aur better control hai costs par.

                        External Factors
                        Top line aur bottom line dono par external factors ka bhi asar padta hai. Market conditions, economic factors, regulatory changes, aur competitive landscape sab factors influence karte hain. For example, economic downturns mein sales decline ho sakti hain, jo top line ko negatively impact karegi. Similarly, higher taxes ya interest rates bottom line ko affect kar sakti hain.

                        Case Study
                        Apple Inc. ek achi example hai jahan hum top line aur bottom line dono ko analyze kar sakte hain. Apple ki revenue growth consistently high rahi hai due to its innovative products aur strong brand loyalty. Apple ki top line indicate karti hai ke company ne substantial sales generate ki hain har financial period mein.

                        Dusri taraf, Apple ki bottom line bhi strong rahi hai kyunki company ne apne operational efficiency ko maintain rakha hai aur effective cost control measures implement kiye hain. Higher net profit indicate karta hai ke Apple ne not just sales, but profitability pe bhi focus kiya hai.


                        Top line aur bottom line trading aur investing ki duniya mein critical metrics hain jo kisi company ki financial health aur performance ko assess karne mein madad karte hain. Top line se humein company ki sales performance ka pata chalta hai, jabke bottom line profitability ko reflect karti hai. Dono metrics ko balance aur effectively manage karna zaroori hai taake company ki long-term growth aur sustainability ensure ho sake. Investors aur traders ko yeh samajhna chahiye ke top line growth zaroori hai, magar uske sath-sath cost management aur operational efficiency bhi equally important hain. Sirf higher sales sufficient nahi hain agar expenses bhi barh rahe hain, kyunki isse bottom line negative impact ho sakti hai. Ek successful aur financially healthy company woh hoti hai jo apni top line aur bottom line dono ko balance aur effectively manage kare.
                        Believe in yourself and your abilities. When you fight for your dreams, you can achieve anything.
                        • #13 Collapse

                          **Market Ki Top Aur Bottom Lines**

                          Market ki top aur bottom lines trading aur investing mein crucial concepts hain jo price levels ko identify karne aur market trends ko samajhne mein madad karte hain. Yeh lines market ki high aur low points ko represent karti hain aur trading strategies ko guide karti hain. Yahan market ki top aur bottom lines ke key aspects ko points mein samjha gaya hai:

                          1. **Top Line**:
                          - **Definition**: Market ki top line woh highest price level hoti hai jo market ne ek specific time period ke dauran achieve kiya hota hai. Yeh level resistance level ke roop mein bhi kaam kar sakta hai.
                          - **Characteristics**: Top line ko identify karne ke liye historical price data ka analysis kiya jata hai. Jab price is level tak pahunchti hai, to sellers ka interest barh jata hai, jo price ko is level se neeche le aata hai.
                          - **Resistance Level**: Top line market ka resistance level hota hai. Yeh level tab tak strong hota hai jab tak price baar-baar is level se bounce back karti hai. Strong resistance levels price ke upar jane ko rok sakte hain.

                          2. **Bottom Line**:
                          - **Definition**: Market ki bottom line woh lowest price level hoti hai jo market ne ek specific time period ke dauran achieve kiya hota hai. Yeh level support level ke roop mein bhi kaam kar sakta hai.
                          - **Characteristics**: Bottom line ko identify karne ke liye bhi historical price data ka analysis kiya jata hai. Jab price is level tak pahunchti hai, to buyers ka interest barh jata hai, jo price ko is level se upar le aata hai.
                          - **Support Level**: Bottom line market ka support level hota hai. Yeh level tab tak strong hota hai jab tak price baar-baar is level ko test karti hai aur isse bounce back karti hai. Strong support levels price ke neeche jane ko rok sakte hain.

                          3. **Trend Analysis**:
                          - **Trend Reversal**: Market ki top aur bottom lines trend reversal points ko identify karne mein madad karti hain. Agar price consistently top line ko break karti hai, to upward trend ko continue karne ka signal milta hai. Similarly, agar price consistently bottom line ko break karti hai, to downward trend ko continue karne ka signal milta hai.
                          - **Consolidation**: Jab market price top aur bottom lines ke beech mein trade karti hai, to yeh consolidation phase ko indicate karta hai. Is phase mein market sideways movement karti hai aur trend direction clear nahi hoti.

                          4. **Technical Tools**:
                          - **Trend Lines**: Trend lines ko draw karke market ki top aur bottom lines ko visualize kiya jata hai. Yeh lines historical highs aur lows ke basis par draw ki jati hain.
                          - **Support Aur Resistance Levels**: Technical charts par support aur resistance levels ko identify karna market ki top aur bottom lines ko understand karne mein madad karta hai. Yeh levels price action aur market sentiment ko samajhne ke liye use kiye jate hain.

                          5. **Practical Application**:
                          - **Trading Strategies**: Traders in levels ko apne trading strategies mein include karte hain. Buy orders ko support levels par aur sell orders ko resistance levels par place kiya jata hai.
                          - **Risk Management**: Market ki top aur bottom lines ko identify karke risk management plans banaye jate hain. Stop-loss orders ko support aur resistance levels ke around set kiya jata hai taake losses ko minimize kiya ja sake.

                          In summary, market ki top aur bottom lines trading aur investing mein key levels hain jo market trends aur price movements ko analyze karne mein madadgar hote hain. In lines ka proper analysis kar ke traders aur investors apne trading decisions ko enhance kar sakte hain aur market opportunities ka fayda utha sakte hain.
                          • #14 Collapse

                            Market Ki Top Aur Bottom Line

                            Market ki top aur bottom lines trading ke liye bohot important hoti hain. Yeh lines traders ko yeh samajhne mein madad deti hain ke market ke kis hisse mein buying ya selling pressure zyada hai. Top lines market ke us hise ko indicate karti hain jahan se market ne reverse kiya hai, aur bottom lines wo hise hain jahan se market ne support liya hai.

                            **Top Lines**

                            Market ki top lines ko resistance level bhi kaha jata hai. Yeh wo levels hain jahan price ne multiple times touch karke wapas niche aana shuru kiya. Resistance levels identify karna trading ke liye bohot crucial hota hai kyun ke yeh wo jagah hoti hain jahan selling pressure zyada hota hai. Jab market kisi resistance level tak pohanchti hai, to bohot se traders apni positions ko sell karna shuru kar dete hain, jiski wajah se price niche gir jati hai.

                            Resistance levels ko identify karne ke liye, traders chart par previous highs ko mark karte hain. Agar kisi specific level par price ne kai martaba stop hoke niche girna shuru kiya ho, to wo level resistance level ban jata hai. Moving averages aur trend lines bhi resistance levels ko identify karne mein madadgar sabit ho sakti hain.

                            **Bottom Lines**

                            Market ki bottom lines ko support levels kaha jata hai. Yeh wo levels hain jahan price ne multiple times touch karke wapas upar jana shuru kiya. Support levels identify karna trading ke liye equally important hota hai kyun ke yeh wo jagah hoti hain jahan buying pressure zyada hota hai. Jab market kisi support level tak pohanchti hai, to bohot se traders apni positions ko buy karna shuru kar dete hain, jiski wajah se price upar chali jati hai.

                            Support levels ko identify karne ke liye, traders chart par previous lows ko mark karte hain. Agar kisi specific level par price ne kai martaba stop hoke upar jana shuru kiya ho, to wo level support level ban jata hai. Moving averages aur trend lines bhi support levels ko identify karne mein madadgar sabit ho sakti hain.

                            **How to Use Top and Bottom Lines**

                            Top aur bottom lines ko use karne ka tareeqa kuch yun hai ke jab price kisi resistance level par pohanchti hai, to traders apni sell orders place karte hain. Isi tarah, jab price kisi support level par pohanchti hai, to traders apni buy orders place karte hain. Lekin, yeh zaroori hai ke resistance aur support levels ko sirf ek line samajh kar na dekha jaye, balki yeh zones hote hain jahan se price movement hone ke chances hote hain.

                            **Breakout and Breakdown**

                            Agar price resistance level ko break karke upar chali jati hai, to isse breakout kaha jata hai. Yeh usually is baat ki nishani hoti hai ke market me bullish trend shuru hone wala hai. Isi tarah, agar price support level ko break karke niche gir jati hai, to isse breakdown kaha jata hai. Yeh usually is baat ki nishani hoti hai ke market me bearish trend shuru hone wala hai.

                            **Conclusion**

                            Market ki top aur bottom lines ko samajhna aur unhe apni trading strategy mein incorporate karna bohot zaroori hai. Yeh levels traders ko market ke potential turning points ke bare mein bata sakti hain, jo unhe better trading decisions lene mein madadgar sabit ho sakti hain. Resistance aur support levels ko identify karna, unhe use karna, aur breakouts aur breakdowns ko samajhna ek successful trading strategy ka hissa hai.
                            • <a href="https://www.instaforex.org/ru/?x=ruforum">InstaForex</a>
                            • #15 Collapse

                              ### Market Ki Top Aur Bottom Lines

                              Jab hum trading ya investing ki baat karte hain, toh aksar hum "top" aur "bottom" lines ki terms sunte hain. Ye lines market ka ek visual representation hoti hain jo hume batati hain ke market ka trend kis direction mein ja raha hai. Ye lines samajhna na sirf trading decisions ke liye zaroori hai, balki ye aapko market ke baare mein gehra insight bhi deti hain.

                              #### Top Line

                              Market ki top line wo level hota hai jahan par price repeatedly rise hone ke baad ruk jata hai. Is level ko resistance level bhi kaha jata hai. Jab market is point ko touch karta hai aur wapas niche aata hai, toh ye indicate karta hai ke buyers ka pressure kam ho raha hai aur sellers market par kabza karne lage hain.

                              Example ke taur par, agar aap dekhein ke ek stock ya currency pair ki price 150 par ja kar ruk jaati hai aur phir neeche aati hai, toh 150 aapka resistance level hai. Traders is point ko identify karte hain aur yahan selling positions open karne ka sochte hain.

                              #### Bottom Line

                              Bottom line us level ko kahte hain jahan par price fall hone ke baad rukti hai aur phir se upar ki taraf move karti hai. Isay support level bhi kehte hain. Is point par buyers ka pressure sellers se zyada ho jata hai, jisse price mein increase aata hai.

                              Agar koi asset repeatedly 100 par aakar stabilize ho raha hai aur wahan se bounce back kar raha hai, toh 100 aapka support level hai. Yahan traders buying positions open karte hain kyunke yeh wo level hai jahan price stabilize hone ke bad upar jaane ke chances barh jaate hain.

                              #### Market Dynamics

                              Market dynamics samajhna zaroori hai taake aap trading decisions mein maahir ban sakein. Jab price top line ke paas hoti hai, toh ye market ki selling opportunity ho sakti hai, jab tak koi major breakout na ho. Wahi, bottom line par buying opportunity ho sakti hai jab tak price ke breakout karne ke strong signs na hoon.

                              ### Key Strategies

                              1. **Breakout Trading**: Jab price top ya bottom line ko break karti hai, toh yeh ek breakout situation hoti hai. Is point par high volume ke saath price move karti hai aur aapko potential profit mile sakta hai.

                              2. **Range Trading**: Agar market ek range mein move kar raha hai, toh top aur bottom lines ko identify karke aap buy low and sell high strategy adopt kar sakte hain.

                              3. **Trend Following**: Jab market ek trend mein ho, toh top aur bottom lines ko use karke aap trend continuation ya reversal strategies implement kar sakte hain.

                              ### Conclusion

                              Market ki top aur bottom lines ko samajhna trading aur investing ki duniya mein bohot zaroori hai. Ye aapko market trend aur price behavior ka insight deti hain jo aapki trading strategy ko improve karne mein madadgar ho sakti hain. Achi tarah se in levels ko identify karna aur inke hisaab se strategies banana aapko successful trader banne ke liye tayar kar sakta hai.

                              اب آن لائن

                              Working...
                              X