Countinoution Patterns on Trading Chart.

No announcement yet.
`
X
  • وقت
  • دکھائیں
Clear All
new posts
  • #1 Collapse

    Countinoution Patterns on Trading Chart.
    Brief Description.
    ​​​​​
    Dear traders abhi hum continuation trading patterns ko discuss Karen ge yea bahut hi important role play karte hain trading ko moasar aur profitable banane mein aur khas kar agar aik beginner trader hai to us ke liye bahut hi zaruri hai ki woh is ki important ko samjhen aur in patterns ke bare mein knowledge aur experience hasil kar ke trading ko continue karen kyun ki yah continuation pattern jab develop hote hain trading chart per to is ka matlab hota hai ki current trend jo hai vah continue rahe ga aur is mein koi bhi tabdili hone ke chance bahut hi kam hain aur kuch resistance ke baad ya phir Kuch consolidation ke baad trend wapas continue kray ga aur apni previous direction ko follow karte hue trend ko continue rakhay ga in patterns ko trend continuation patterns Kaha jata hai dear friends jab bhi aap continuation pattern dekhain toh volume ko zaroor analyze karein agar breakout ke waqt volume zyada ho, toh iska matlab trend mazboot hai. Doosra, risk management ko madde nazar rakhein aur stop-loss lagana na bhoolain, jab ek trend chal raha hota hai (upar ya neeche), toh yeh patterns is trend ki continuation ko dikhatay hain aur traders ko entry aur exit points identify karne mein madad detay hain.

    Bullish / Bearish Continuation Patterns.

    Dear traders ab ham yah jana ne ki koshish karte hain kay trend continuation pattern Kitni types ke hote hain aur Kis tarah say trading per in ka asar padta hai aur kis tarah say trader in ko apni judgement ke zarie judge kar ke acchi trading result shasan kar sakta hai Trend continuation patterns 2 tarha ke hotay hain bullish aur bearish.


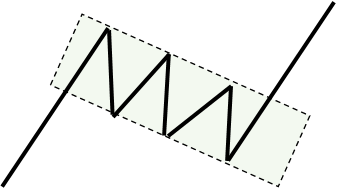
    Bullish continuation patterns tab hotay hain jab market ka trend upar ki taraf ho aur usi direction mein continue karay. Is mein common patterns symmetrical triangles, flags aur pennants hotay hain.

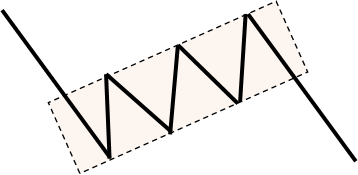
    Bearish continuation patterns tab banti hain jab market neeche ki taraf ja raha ho aur yeh neeche hi continue kare. Yeh patterns zyada tar descending triangles aur bearish flags ki shakal mein hotay hain. Inka samajhna zaroori hai kyun ke yeh patterns timing aur strategy banane mein kaam aatay hain.

    Some other Common Countinoution Patterns.

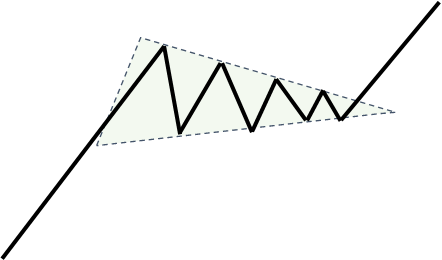
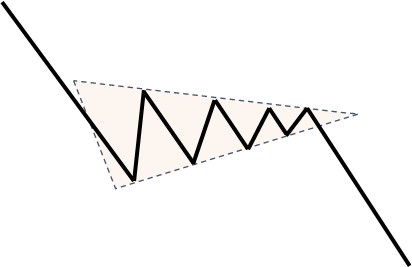
    Dear friends aap ko btata chaloon kay Jo oopar hum ne zikr kiya woh Bulish aur Bearish continuation pattern the abhi ham Kuchh common types of Countinoution pattern ko discuss karte hain dear traders kuch common trend continuation patterns mein flags, pennants, aur triangles shamil hain. Flag patterns seedhi ya diagonal lines ke zariye banti hain jo trend ke opposite hoti hain, magar baad mein trend ke saath hi continue karti hain. Pennant patterns chhoti triangles ki shakal mein hoti hain jo temporary consolidation ko dikhati hain. Symmetrical triangles dono sides se squeeze karti hain aur baad mein breakout hota hai jis direction mein trend hai. Inka sahi analysis karke aap profit aur loss ka andaza laga saktay hain aur apni strategy better bana saktay hain.
  • <a href="https://www.instaforex.org/ru/?x=ruforum">InstaForex</a>
  • #2 Collapse

    Continuation Pattern Kya Hai?

    Continuation pattern trading kay andar ek ahem concept hai jo market ke trend ka continuation yaani barqarar rehne ka signal deta hai. Iska matlab yeh hai ke agar market kisi direction mein move kar raha hai (uptrend ya downtrend), to yeh pattern is baat ki nishani hoti hai ke yeh trend kuch waqt tak aage bhi chal sakta hai. Traders aur investors in patterns ka istemal future price movement ka andaza lagane ke liye karte Hain.


    Continuation Patterns Ki Ahmiyat

    Continuation patterns ko samajhna trading ke liye bohot zaroori hai, kyunki yeh traders ko price movement ke baray mein signal dete hain. Agar market uptrend mein hai aur continuation pattern ban raha hai, to iska matlab hai ke market aage bhi upar ja sakta hai. Yeh patterns aksar market ki temporary consolidation (rukawat) ya pause ke waqt dikhai dete hain, jo baad mein trend ke dubara start hone ka signal dete hain.

    Types of Continuation Patterns

    Continuation patterns ke kuch common types hain, jaise: Flag, Pennant, Wedge aur Triangle Patterns. Flag aur pennant patterns aksar strong trends ke baad nazar aate hain. Flag ek chhoti si parallel channel jaisa hota hai, jab ke pennant ek chhoti si triangular shape ka hota hai. Triangle patterns, jo ascending, descending ya symmetrical ho sakte hain, market ki uncertainty ya consolidation ko dikhate hain. Jab market in patterns ko todta hai, tab trend ka continuation hota hai.

    Trading Strategies Mein Continuation Patterns Ka Istemaal

    Continuation patterns ka sahi istemal karne ke liye traders ko chart patterns aur volume analysis ka dhyan rakhna hota hai. Jab pattern todta hai (breakout hota hai), tab high volume hone par signal mazboot hota hai. Traders apne stop-loss aur take-profit levels ko in patterns ke basis par set karte hain. Yeh patterns beginners aur experienced traders ke liye ek valuable tool hain, jo unhein market trends ka andaza lagane aur risk manage karne mein madad karte hain.
    • #3 Collapse

      Continuation Patterns on Trading Chart?
      Trading chart patterns aik bohot important tool hain jo traders ko market ke trend ka andaza lagane mein madad dete hain. Continuation patterns un patterns mein shamil hain jo market ke existing trend ke barqarar rehne ka signal dete hain. Yeh patterns mostly is baat ki nishani hote hain ke market ka trend kuch der ke liye ruk gaya hai, lekin phir dobara wohi direction mein chalay ga. Neeche kuch common continuation patterns ka zikr hai jo trading charts par dekhnay ko milte hain:

      1. Flag Pattern
      Yeh pattern tab banta hai jab price ek steep trend (upar ya neeche) follow karta hai aur phir consolidation phase mein chala jata hai. Yeh consolidation ek chhoti si channel ki shakal mein hoti hai jo trend ke opposite hoti hai. Jab price is channel se breakout karta hai, toh trend dobara apni asli direction mein shuru hota hai.


      2. Pennant Pattern
      Pennant pattern bhi flag ki tarah hota hai lekin ismein price ka consolidation ek triangle ki shakal mein hota hai. Yeh pattern mostly strong price movements ke baad banta hai aur breakout ke baad market apne trend ko continue karta hai.

      3. Ascending Triangle (Bullish)
      Yeh pattern tab banta hai jab price higher lows banata hai aur ek horizontal resistance level touch karta hai. Jab price is resistance ko todta hai, toh market bullish trend continue karta hai.

      4. Descending Triangle (Bearish)
      Is pattern mein price lower highs banata hai aur horizontal support level ko touch karta hai. Jab price support todta hai, toh bearish trend continue hota hai.

      5. Cup and Handle
      Yeh ek bullish continuation pattern hai jo ek cup (semi-circle) aur uske baad ek chhoti handle (consolidation phase) banata hai. Jab price handle se breakout karta hai, toh bullish trend dobara shuru hota hai.


      Note
      Continuation patterns ka samajhna aur unhe timely identify karna trading mein bohot madadgar hota hai. In patterns ka sahi analysis kar ke aap profitable trades kar saktay hain. Hamesha breakout ka intezar karein aur risk management ka khayal rakhein.
      • #4 Collapse

        Continuation Patterns in Forex Trading

        Continuation patterns woh chart patterns hain jo yeh indicate karte hain ke price action apne existing trend ko continue karega consolidation phase ke baad. Ye patterns traders ke liye kaafi madadgar hote hain jab unhein yeh samajhna ho ke market kis taraf ja rahi hai. Niche kuch common continuation patterns ka zikr kiya gaya hai jo Forex trading mein aam tor par use hote hain.

        1. Flag Pattern

        Flag pattern ek chhota consolidation phase hota hai jo ek steep trend ke baad aata hai. Yeh do tarah ka hota hai:

        Two types of flag patterns

        Bulish flag .

        Jab price ek strong uptrend ke baad sideways ya thoda neeche chalta hai aur phir upar breakout karta hai


        Bearish Flag:

        Jab price ek strong downtrend ke baad sideways ya thoda upar chalta hai aur phir neeche breakout karta hai.


        2. Pennant Pattern

        Pennant pattern triangular shape ka hota hai jo chhoti consolidation ko dikhata hai.

        Price tight range mein contract karta hai aur phir existing trend ki taraf breakout hota hai.

        Volume usually breakout ke waqt barhta hai.

        Two types of pennant patterns

        Bullish Pennant


        2. Bearish Pennant


        3. Ascending Triangle

        Yeh ek bullish continuation pattern hota hai. Ismein:

        Price resistance level ko baar-baar test karta hai.

        Higher lows banti hain jo demand barhne ko show karti hain.

        Jab resistance break hota hai, price upar chala jata hai.

        4. Descending Triangle
        ​​​​​​
        Yeh bearish continuation pattern hota hai. Ismein:
        Price support level ko baar-baar test karta hai.
        Lower highs banti hain jo supply barhne ko show karti hain.
        Jab support break hota hai, price neeche chala jata hai.

        5. Symmetrical Triangle

        Yeh dono taraf breakout de sakta hai, lekin zyadatar trend ki direction mein hi hota hai.
        Price ek contracting triangle ke andar move karta hai.
        Jab breakout hota hai, price ussi direction mein jata hai jisme pehle trend tha.

        Key Points:

        Continuation patterns ka duration short to medium term hota hai.
        Volume breakout ke waqt barhta hai.
        Yeh patterns mostly trending markets mein zyada effective hote hain.

        Conclusion:

        Continuation patterns ko samajhne se traders ke liye price movement predict karna asaan ho jata hai. Ye patterns unhein zyada confident decisions lene mein madad karte hain. Har pattern ka apna unique structure hota hai, isliye inhein pehchanna aur sahi waqt par trade karna zaroori hai.

        Agar aap in patterns ke practical use ke baare mein aur detail chahte hain, toh zaroor poochhein!
        • #5 Collapse

          **Continuation Patterns On Trading Chart**
          Forex trading mein patterns ka analysis karna bohot important hota hai, kyun ke yeh patterns aapko market ki future direction ke baare mein insights dete hain. Aksar trading charts pe aise patterns bante hain jo kisi existing trend ko continue karne ka signal dete hain. Aise patterns ko **Continuation Patterns** kaha jata hai. Yeh patterns traders ko yeh batate hain ke market mein jo trend chal raha hai, woh continue ho sakta hai, aur traders is trend ko follow kar ke profit kama sakte hain. Aaj hum continuation patterns ke baare mein detail se baat karenge, unki types ko samjhenge aur yeh dekhenge ke kaise in patterns ko effectively trade kiya ja sakta hai.

          **Continuation Patterns Kya Hote Hain?**

          Continuation patterns un chart formations ko kaha jata hai jo ek existing trend ko pause karne ke baad wapis se continue karte hain. Matlab agar market ek upward trend mein ho, toh continuation pattern ke baad price upar ki taraf move karne ka chance hota hai. Agar market downtrend mein ho, toh continuation pattern ke baad price neeche ki taraf jaa sakti hai. Yeh patterns market mein ek temporary pause ya consolidation ko indicate karte hain, jiske baad price apne previous trend ki direction mein move karte hai.

          **Popular Continuation Patterns**

          1. **Triangles**: Triangular patterns market mein aksar consolidation ke baad bante hain. Yeh patterns upward, downward, ya sideways ho sakte hain. Triangle patterns do tarah ke hote hain:
          - **Symmetrical Triangle**: Yeh pattern tab banta hai jab market mein higher lows aur lower highs bante hain. Is pattern ke breakout ke baad market trend ko continue kar sakta hai.
          - **Ascending Triangle**: Isme ek horizontal resistance line hoti hai aur ek upward sloping support line hoti hai. Yeh bullish breakout ka signal hota hai.
          - **Descending Triangle**: Yeh pattern bearish market mein banta hai, jisme horizontal support line aur downward sloping resistance line hoti hai. Is pattern ke baad bearish breakout hota hai.

          2. **Flags and Pennants**: Flags aur pennants bhi continuation patterns hote hain jo market mein ek strong trend ke baad bante hain. Yeh patterns aksar consolidation ke baad short-term retracement ko show karte hain.
          - **Flag Pattern**: Flag pattern ek small rectangular-shaped consolidation hota hai jo ek sharp trend ke baad banta hai. Yeh pattern indicate karta hai ke market apne trend ko continue kar sakta hai.
          - **Pennant Pattern**: Pennant pattern ek small symmetrical triangle hota hai jo ek strong trend ke baad banata hai. Yeh pattern zyada time ke liye consolidate karta hai aur breakout ke baad market trend ko continue karta hai.

          3. **Rectangles**: Rectangular patterns wo formations hote hain jo price range ke andar consolidate kartay hain, jahan price na to upar jati hai na neeche. Is pattern ko range-bound market ke naam se bhi jaana jata hai. Jab price is rectangle ke support ya resistance level ko break karti hai, toh trend ko continue karne ka signal milta hai.

          4. **Wedges**: Wedge patterns bhi continuation patterns mein shumar hote hain. Yeh patterns ek narrowing range ke andar bante hain, aur jab price wedge ka breakout karti hai, toh market apne trend ko continue kar sakta hai. Wedge pattern do tarah ka ho sakta hai:
          - **Rising Wedge**: Yeh bearish signal deta hai, jab price downward breakout karte hue downtrend continue karti hai.
          - **Falling Wedge**: Yeh bullish signal deta hai, jab price upward breakout karti hai aur uptrend ko continue karti hai.

          **How to Trade Continuation Patterns?**

          1. **Identify the Trend**: Sabse pehle, aapko market ka trend identify karna zaroori hai. Agar market ek strong uptrend ya downtrend mein hai, toh aap continuation pattern ke breakout ke liye ready ho sakte hain.

          2. **Wait for the Breakout**: Continuation patterns ke trade karte waqt aapko breakout ka wait karna hota hai. Agar price triangle, flag, ya pennant pattern ke resistance ya support level ko break karti hai, toh aap trade open kar sakte hain.

          3. **Volume Confirmation**: Breakout ke waqt volume ka bhi important role hota hai. Agar breakout high volume ke saath hota hai, toh yeh zyada reliable hota hai aur indicate karta hai ke market trend continue karega.

          4. **Place Stop-Loss**: Risk management bhi zaroori hai. Aapko stop-loss place karna hoga, jo aap pattern ke opposite side pe rakh sakte hain. Jaise agar aap buy position open kar rahe hain, toh stop-loss ko pattern ke support level ke neeche rakh sakte hain.

          5. **Target Profit Level**: Aapko apna target profit level bhi define karna zaroori hai. Yeh target aap pattern ke height ke hisaab se calculate kar sakte hain. Agar aap flag pattern trade kar rahe hain, toh aap flagpole ke length ke barabar profit target set kar sakte hain.

          **Benefits of Trading Continuation Patterns**

          1. **Predictable Movements**: Continuation patterns kaafi predictable hote hain, kyun ke yeh existing trend ko continue karte hain. Jab aap in patterns ko samajh kar trade karte hain, toh aapko zyada profitable opportunities mil sakti hain.

          2. **Trend Confirmation**: Yeh patterns market ke trend ko confirm karte hain, jisse aapko market ki future direction ke baare mein clear idea milta hai. Aap market ke current trend ke hisaab se trade kar ke apni probability of success ko improve kar sakte hain.

          3. **Clear Entry and Exit Points**: Continuation patterns traders ko clear entry aur exit points provide karte hain. Aap easily identify kar sakte hain ke kab pattern complete ho gaya hai aur kab breakout hone wala hai.

          **Challenges of Trading Continuation Patterns**

          1. **False Breakouts**: Continuation patterns ke saath sabse bada challenge false breakouts ka hota hai. Kabhi kabhi price pattern ke boundaries ko break karti hai, lekin phir wapas uske andar aa jaati hai. Isliye, aapko confirmation ke liye volume aur other indicators ko bhi consider karna zaroori hota hai.

          2. **Requires Patience**: Continuation patterns ko trade karte waqt patience ki zaroorat hoti hai, kyunki aapko market ke breakout hone tak wait karna padta hai. Kabhi kabhi yeh patterns time-consuming ho sakte hain.

          **Conclusion**

          Continuation patterns Forex trading mein important tools hain jo aapko market ke trend ko samajhne mein madad karte hain. Yeh patterns price ke consolidation ya pause ke baad trend ko continue karte hain, jo traders ko profitable opportunities provide karte hain. Aap triangles, flags, pennants, rectangles, aur wedges jese continuation patterns ko identify kar ke apni trading strategy mein include kar sakte hain. Lekin, in patterns ko trade karte waqt aapko volume confirmation, breakout ke timing aur risk management ka khayal rakhna zaroori hota hai. Proper analysis aur patience se aap in patterns se fayda utha sakte hain.
          • #6 Collapse

            Continuation Patterns on Trading Chart
            Introduction to Continuation Patterns
            Continuation patterns are chart formations that suggest a trend in the market will continue after a brief period of consolidation. These patterns form when a market pauses during a trend but does not reverse. Instead, the pattern indicates that the prevailing trend is likely to resume after the consolidation. Traders rely on these patterns to predict future price movements, as they provide opportunities to enter trades in the direction of the dominant trend.

            There are various types of continuation patterns, including flags, pennants, triangles, and rectangles. These patterns are often seen in both bullish and bearish trends and can appear on different time frames. Understanding these patterns is essential for traders looking to enhance their technical analysis and improve their decision-making process.

            Traders use continuation patterns to assess the strength of an ongoing trend and find optimal entry points. When these patterns form, they create an environment where traders can position themselves to ride the trend in the same direction. This ability to predict future price movement with high probability is one of the key advantages of trading continuation patterns.

            Types of Continuation Patterns
            1. Flag Pattern
              A flag pattern is one of the most common continuation patterns, typically forming during a strong trend. It appears as a small rectangular-shaped consolidation that slopes against the prevailing trend. Flags usually form after a sharp price movement, known as the "flagpole," followed by a short consolidation phase. This consolidation usually takes the form of a narrow channel or parallel trendlines that run against the trend.

            The flag pattern signals that the market is temporarily resting, and after the consolidation, it is likely to resume the direction of the previous trend. For instance, in a bullish trend, the price might rise sharply, followed by a small downward-sloping flag pattern. Once the price breaks out of the flag's upper boundary, the bullish trend is expected to continue.

            Similarly, in a bearish trend, after a sharp price drop, the flag forms a small consolidation that slopes upward. Once the price breaks below the lower boundary of the flag, the bearish trend is expected to resume. Flags provide traders with clear levels of entry and stop-loss points, making them a reliable tool for technical traders.
            1. Pennant Pattern
              A pennant is a small symmetrical triangle that forms after a strong price movement, much like the flag pattern. The pennant is formed by converging trendlines, with both the upper and lower trendlines sloping toward each other. It indicates a period of consolidation after a sharp price move, followed by a breakout in the direction of the original trend.

            Pennants are characterized by a period of consolidation where the price forms lower highs and higher lows. As the price moves closer to the apex of the triangle, the volatility decreases, and the market prepares for the next big move. Traders watch for a breakout from the pattern, which usually signals a continuation of the prevailing trend.

            The pennant pattern is often found in both bullish and bearish trends. In a bullish trend, the price moves up sharply, and then a pennant pattern forms as the price consolidates. A breakout above the upper trendline signals the continuation of the bullish trend. In a bearish trend, the pennant forms after a downward price movement, and a breakdown below the lower trendline signals the continuation of the bearish trend.

            Triangles: Symmetrical, Ascending, and Descending
            3. Symmetrical Triangle
            A symmetrical triangle is a continuation pattern that forms when the price moves within converging trendlines, with the upper trendline sloping downward and the lower trendline sloping upward. This pattern represents a consolidation phase where the market is uncertain, with neither buyers nor sellers able to take control. The symmetrical triangle forms after a strong trend, signaling that the market is in a period of indecision before resuming the previous trend.

            Traders watch for a breakout from the triangle, as this is often a signal that the price will continue in the direction of the prior trend. A breakout above the upper trendline suggests a bullish continuation, while a breakdown below the lower trendline suggests a bearish continuation.

            Symmetrical triangles can form in both uptrends and downtrends, and they are often considered reliable indicators of continuation. However, traders need to be cautious of false breakouts, where the price breaks out of the triangle but quickly reverses. To reduce the risk of false signals, traders often wait for confirmation, such as a retest of the breakout level.
            1. Ascending Triangle
              The ascending triangle is a continuation pattern that typically forms during an uptrend. It is characterized by a horizontal upper trendline and an ascending lower trendline. The pattern represents a period of consolidation where buyers are becoming more aggressive, pushing the price higher with each pullback, while the sellers are unable to push the price lower.

            In an ascending triangle, the price forms a series of higher lows, but the resistance level remains horizontal. This pattern is a sign of bullish pressure as the price consolidates at the resistance level. Traders look for a breakout above the horizontal resistance line to signal the continuation of the uptrend.

            The ascending triangle is considered a bullish pattern because the buyers are gradually taking control of the market. When the price breaks above the resistance level, it is expected to continue its upward trajectory. The target price for the breakout is typically measured by the height of the triangle, projected from the breakout point.
            1. Descending Triangle
              The descending triangle is the opposite of the ascending triangle and is typically found during a downtrend. It is characterized by a horizontal lower trendline and a descending upper trendline. The pattern indicates a period of consolidation where sellers are becoming more aggressive, pushing the price lower with each rally, while buyers are unable to push the price higher.

            In a descending triangle, the price forms a series of lower highs, but the support level remains horizontal. This pattern is a sign of bearish pressure as the price consolidates at the support level. Traders look for a breakdown below the horizontal support line to signal the continuation of the downtrend.

            The descending triangle is considered a bearish pattern because the sellers are gradually taking control of the market. When the price breaks below the support level, it is expected to continue its downward movement. The target price for the breakout is typically measured by the height of the triangle, projected from the breakdown point.

            Rectangles and Their Role in Continuation Patterns
            6. Rectangle Pattern
            A rectangle pattern, also known as a trading range or box pattern, forms when the price moves within parallel support and resistance levels. The price fluctuates between these two horizontal lines, creating a consolidation phase where the market is in equilibrium. This pattern often occurs in the middle of a trend and signals that the trend is likely to continue once the price breaks out of the rectangle.

            The rectangle pattern is considered a neutral continuation pattern because it shows a period of indecision in the market. Traders wait for the price to break above the resistance or below the support level to confirm the direction of the next move. A breakout above the resistance level signals a continuation of the uptrend, while a breakdown below the support level signals a continuation of the downtrend.

            The rectangle pattern is useful for traders because it provides clear entry and exit points. Once the price breaks out of the rectangle, traders can enter the market with a stop-loss placed below the support or above the resistance level. The target price is typically measured by the height of the rectangle, projected from the breakout point.

            The Importance of Volume in Continuation Patterns
            7. Volume and Continuation Patterns
            Volume plays a crucial role in the formation and confirmation of continuation patterns. High volume during the formation of a continuation pattern indicates strong participation in the market, which increases the likelihood that the trend will continue once the pattern breaks out. Conversely, low volume during the consolidation phase suggests a lack of interest, and the pattern may not be as reliable.

            Traders often use volume as a confirming indicator when analyzing continuation patterns. For example, in a flag or pennant pattern, an increase in volume during the breakout is a sign that the trend is likely to continue. On the other hand, if the volume is low during the breakout, it may suggest a lack of conviction, and the breakout may be false.

            Volume also helps traders determine the strength of a trend. A strong trend accompanied by high volume is more likely to continue than a weak trend with low volume. Traders use volume to assess the potential of continuation patterns and to filter out false signals.

            Conclusion: Mastering Continuation Patterns
            In conclusion, continuation patterns are valuable tools for traders who seek to identify high-probability trading opportunities. These patterns indicate that a trend is likely to resume after a period of consolidation, providing traders with an edge in predicting future price movements. By learning to recognize flags, pennants, triangles, and rectangles, traders can position themselves to enter the market at optimal points and ride the trend to maximize profits.

            However, it is important to remember that no pattern is foolproof, and there is always the potential for false breakouts or reversals. Therefore, traders should always use risk management techniques, such as stop-loss orders, to protect their capital. Additionally, combining continuation patterns with other technical indicators can increase the reliability of trade setups.

            With practice and experience, traders can improve their ability to recognize and trade continuation patterns effectively, ultimately enhancing their chances of success in the forex market.
             
            • #7 Collapse

              Continuation Patterns on Trading Chart
              Introduction to Continuation Patterns
              Trading charts mein continuation patterns wo formations hote hain jo market mein ek existing trend ko continue karne ka signal dete hain. Ye patterns tab ban'te hain jab price ek temporary pause ya consolidation ke baad apni purani direction mein wapis chalna shuru karta hai. Continuation patterns traders ko market mein agle price movement ke baare mein anticipation karne mein madad dete hain. In patterns ko identify karna aur samajhna forex aur stock trading mein bohot zaroori hota hai, taake aap apne trades ko behtar tarike se manage kar sakein.

              Common Continuation Patterns
              Forex aur stock trading mein kai types ke continuation patterns paaye jate hain. In mein se kuch mashhoor patterns hain flags, pennants, triangles, aur rectangles. Har pattern ka apna ek unique structure hota hai, lekin sab ka purpose ek hi hota hai – trend ko continue karna. Flags aur pennants chhote price consolidations hote hain jo ek sharp movement ke baad bante hain. Triangles aur rectangles mein price kisi limited range mein trade karta hai, jo ke ek breakout ka indication hota hai.

              Flag Pattern
              Flag pattern ek bohot common continuation pattern hai jo aksar sharp uptrend ya downtrend ke baad banta hai. Is pattern mein price ek parallel channel ke andar consolidate karta hai, jo ke ek flag pole ke shape ka hota hai. Flag pole ek strong move ko represent karta hai, jab ke flag consolidation ko dikhata hai. Flag ka breakout us direction mein hota hai jisme pehle trend tha, aur yeh breakout ke baad price ko apni purani direction mein continue karte hue dekha jata hai.

              Pennant Pattern
              Pennant pattern bhi flag ki tarah kaam karta hai lekin iska structure thoda different hota hai. Pennant pattern chhote price consolidations ke dauran ban'ta hai jo ek triangular shape banate hain. Yeh pattern bohot strong price movements ke baad banta hai aur ismein bhi price breakout pe apni previous trend ko follow karta hai. Traders is pattern ko breakout ke point pe watch karte hain, jahan price apne trend ko resume karta hai.

              Triangle Patterns
              Triangle patterns teen types mein aate hain: ascending, descending, aur symmetrical. Ascending triangle ka matlab hai ke price higher lows bana raha hai, lekin resistance ek fixed level par rehta hai. Is pattern mein price resistance level ko break karne ke baad apni upward direction mein continue karta hai. Descending triangle mein opposite hota hai; price lower highs bana raha hota hai aur support level ke paas consolidate karta hai. Symmetrical triangle mein price dono taraf se converge karta hai, aur breakout ke baad price kisi bhi direction mein move kar sakta hai.

              Rectangle Pattern
              Rectangle pattern tab ban'ta hai jab price ek horizontal range mein trade karta hai, jahan support aur resistance levels clearly defined hote hain. Is pattern mein price dono taraf ek equal range mein move karta hai aur iske baad breakout hota hai. Rectangle pattern ko sideways market ke hisaab se identify kiya jata hai, aur breakout ke baad price apne previous trend ko continue karte hue move karta hai. Ye pattern market ki stability aur momentum ko samajhne mein madad karta hai.

              Breakout Strategy
              Breakout strategy continuation patterns ke analysis par base karti hai. Jab price kisi consolidation zone ko break karta hai, to woh breakout trade ka signal hota hai. Traders usually breakout ke point par apni positions enter karte hain, jab price apni previous trend ko continue karta hai. Ye strategy un traders ke liye hai jo trend-following approach ko follow karte hain. Breakout strategy mein risk management bohot zaroori hota hai, kyunki kabhi kabhi fake breakouts bhi ho sakte hain.

              Volume Analysis in Continuation Patterns
              Volume analysis continuation patterns ke sath kaafi important hoti hai. Jab price breakout karta hai to volume ka increase hona zaroori hota hai. High volume breakout se ye signal milta hai ke market mein real momentum hai aur trend continue karne ki possibility zyada hai. Agar volume low ho to yeh indicate karta hai ke breakout weak ho sakta hai aur trend reverse ho sakta hai. Isliye volume ko carefully monitor karna bohot zaroori hai.

              Risk Management in Continuation Patterns
              Continuation patterns mein risk management kaafi crucial hoti hai, especially jab aap breakout strategies use karte hain. Agar price breakout ke baad reverse hota hai, to aapko losses se bachne ke liye stop-loss orders ka use karna chahiye. Risk-reward ratio ko balance karte hue trade enter karna aur sahi levels pe stop loss set karna zaroori hota hai. Risk management aapko market ke unpredictable movements se bachata hai aur aapke capital ko protect karta hai.

              Conclusion
              Continuation patterns trading mein ek important role play karte hain aur market ki next move ke baare mein predictions karna asaan banate hain. In patterns ko samajhna aur correctly identify karna traders ko profitable opportunities tak le jaa sakta hai. Flags, pennants, triangles, aur rectangles jaise common patterns ko analyze karke aap apne trading decisions ko behtar bana sakte hain. Lekin, hamesha risk management ko apni trading strategy ka part bana kar trade karna chahiye, taake aap apne investments ko protect kar sakein.
               
              • <a href="https://www.instaforex.org/ru/?x=ruforum">InstaForex</a>
              • #8 Collapse

                Continuation patterns trading charts par bohot zaroori hote hain, khaas kar beginners ke liye, kyun ke yeh patterns trend ki continuation ka indication dete hain. Jab aap ek trend ko dekh rahe hote hain, to agar continuation pattern chart par develop ho, to iska matlab hota hai ke wo trend continue rahe ga aur us mein koi significant reversal ka chance kam hota hai. Yani agar price consolidation ya resistance zone ke baad wapis trend ko follow karta hai, totrend continue hoga.

                Brief Description: Jab trend thodi der ke liye pause karta hai, consolidation ya resistance zone mein, to uske baad agar continuation pattern ban jata hai, to iska matlab hai ke trend apni pehli direction ko follow karte hue continue karega. For example, agar market mein uptrend chal raha hai aur consolidation ya resistance ke baad ek continuation pattern ban raha hai, to yeh indicate karta hai ke price phir se upar jayega.

                Key points:
                1. Volume Analysis: Jab bhi aap
                2. continuation pattern dekhein, volume ko analyse karna zaroori hai. Agar breakout ke waqt volume zyada ho, to yeh trend ka strong continuation show karta hai.
                3. Risk Management: Risk management strategies, jaise stop-loss orders, ko zaroor implement karein, taake aap apne capital ko protect kar sakein agar trend unexpected change hota hai.
                4. Entry and Exit Points: Yeh patterns traders ko entry aur exit points identify karne mein madad karte
                5. hain, taake wo apni trades ko acchi tarah manage kar sakein.
                6. Bullish/Bearish Continuation Patterns: Continuation patterns do types ke hote hain: bullish aur bearish.
                7. Bullish Continuation Patterns:
                  • Yeh patterns uptrend ke dauran ban'te hain aur yeh indicate karte hain ke price consolidation ke baad upar jayega.
                  • Examples: Ascending Triangles, Flags, aur Pennants
                  • Bearish Continuation Patterns:
                    • Yeh patterns downtrend ke dauran develop hote hain aur yeh indicate karte hain ke price consolidation ke baad neeche jayega.
                    • Examples: Descending Triangles, Flags, aur Pennants.
                  • Traders in patterns ko identify karke apni trading strategy banate hain, taki wo apne trades ko successful bana sakein aur market ke trend ko follow karte hue profit kama sakein.

                اب آن لائن

                Working...
                X