What is Price Action Indicator
forex market mein price action indicator aik forex market ka technical tool hota hey jo keh fore market kay chart pattern mein repetitive ko he identify kar sakta hey yeh forex market ke pechle price action ke base par he movement hote rehte hey
forex market kay price action trader es bat ke importance par zoor dayta hey yeh indicator forex market kay price action par he zyada depend karta hey technical honay walay paish raft price action par he mobne hotay hein yeh forex market mein price action par mobne he indicator ko janum deya ja sakta hey yeh forex trader ko precious baserat frahm kar saktay hein or en ko ani strategy mein zam karnay say he faida hota hey
Understanding Price Action Trading
forex market mein market mein market ke movement ko dakhnay kay ley price action he aik jaisa he hota hey forex market bar bar keya karte hey es bat ko bhe farz karen keh ap forex chart par chand pips par he hotay hein chand bar aik khas shape or triangle ban jata hey price bad mein aik khas direction ko follow karte nazar atte hey
yeh triangle forex market mein aik khas direction ke taraf eshara kar rahay hotay hein price action forex market kay aglay step par nazar rakhtay hovay forex market ke movement ke taraf eshara kar rahay hotay hein aglay step par nazar rakhtay hovay market ke movement par he nazar rakh saktay hein yeh aik game mein pattern ko talash karnay or faiday kay ley estamal kar saktay hein
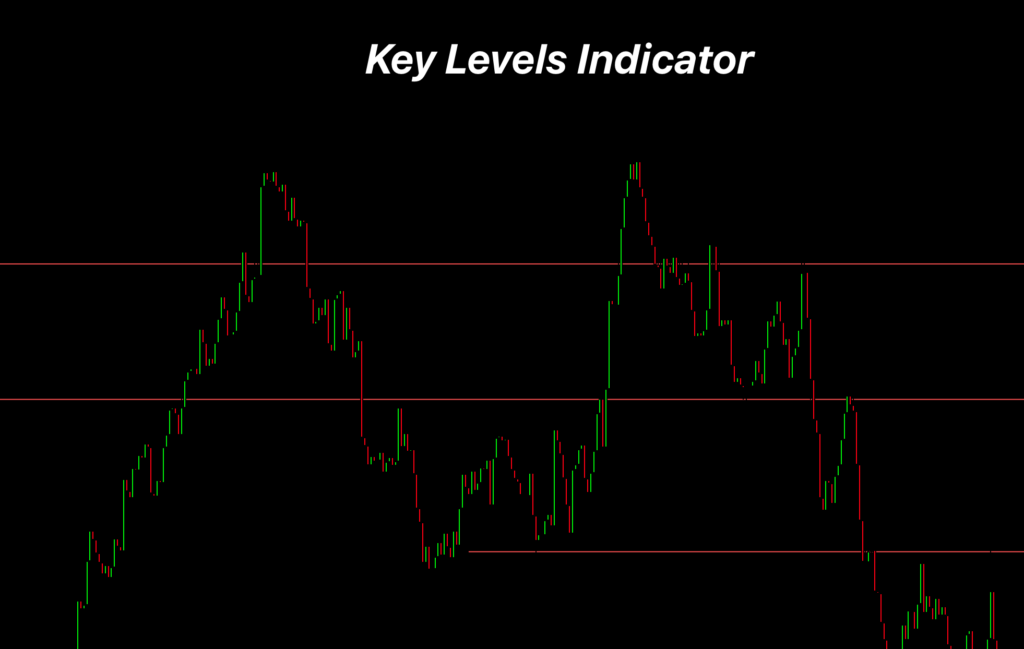
Forex market mein price action aik key level ka he indicator hota hey
forex market mein price action ko nechay dey gay chart mein ap daikh saktay hein keh yeh aik key level ka indicator he hota hey key level ka indicator forex market kay chart par overbought ya oversold ke level ko he identify kar sakta hey es kay baray mein yeh he sochna chihay keh woh jagah jahan par forex market overbought ya oversold ho jate hey hum yeh daikh saktay hein keh yahan par price action ketni bar tabdel ho jata hey or price zyada bar stop ho jate hey or kese khas jagah par ghoom jate hey to yeh forex market ke aik he level hote hey
jab ap forex market mein apna chart par key level indicator ko shamel kartay hein to yeh forexmarket kay mumkana reversal zone ko he indicate kar sakta hey
age forex market kay es lkey lvel mein aik bullish candlestick bante hey to es kay opposite key level mein bearish candlestick bhe ban sakte hey or price mein mumkana kame ko he tajweez kar sakte hey
forex market mein price action indicator aik forex market ka technical tool hota hey jo keh fore market kay chart pattern mein repetitive ko he identify kar sakta hey yeh forex market ke pechle price action ke base par he movement hote rehte hey
forex market kay price action trader es bat ke importance par zoor dayta hey yeh indicator forex market kay price action par he zyada depend karta hey technical honay walay paish raft price action par he mobne hotay hein yeh forex market mein price action par mobne he indicator ko janum deya ja sakta hey yeh forex trader ko precious baserat frahm kar saktay hein or en ko ani strategy mein zam karnay say he faida hota hey
Understanding Price Action Trading
forex market mein market mein market ke movement ko dakhnay kay ley price action he aik jaisa he hota hey forex market bar bar keya karte hey es bat ko bhe farz karen keh ap forex chart par chand pips par he hotay hein chand bar aik khas shape or triangle ban jata hey price bad mein aik khas direction ko follow karte nazar atte hey
yeh triangle forex market mein aik khas direction ke taraf eshara kar rahay hotay hein price action forex market kay aglay step par nazar rakhtay hovay forex market ke movement ke taraf eshara kar rahay hotay hein aglay step par nazar rakhtay hovay market ke movement par he nazar rakh saktay hein yeh aik game mein pattern ko talash karnay or faiday kay ley estamal kar saktay hein
Forex market mein price action aik key level ka he indicator hota hey
forex market mein price action ko nechay dey gay chart mein ap daikh saktay hein keh yeh aik key level ka indicator he hota hey key level ka indicator forex market kay chart par overbought ya oversold ke level ko he identify kar sakta hey es kay baray mein yeh he sochna chihay keh woh jagah jahan par forex market overbought ya oversold ho jate hey hum yeh daikh saktay hein keh yahan par price action ketni bar tabdel ho jata hey or price zyada bar stop ho jate hey or kese khas jagah par ghoom jate hey to yeh forex market ke aik he level hote hey
jab ap forex market mein apna chart par key level indicator ko shamel kartay hein to yeh forexmarket kay mumkana reversal zone ko he indicate kar sakta hey
age forex market kay es lkey lvel mein aik bullish candlestick bante hey to es kay opposite key level mein bearish candlestick bhe ban sakte hey or price mein mumkana kame ko he tajweez kar sakte hey


تبصرہ
Расширенный режим Обычный режим