Price action Indicator

No announcement yet.
`
X
  • وقت
  • دکھائیں
Clear All
new posts
  • #1 Collapse

    Price action Indicator
    What is Price Action Indicator

    forex market mein price action indicator aik forex market ka technical tool hota hey jo keh fore market kay chart pattern mein repetitive ko he identify kar sakta hey yeh forex market ke pechle price action ke base par he movement hote rehte hey
    forex market kay price action trader es bat ke importance par zoor dayta hey yeh indicator forex market kay price action par he zyada depend karta hey technical honay walay paish raft price action par he mobne hotay hein yeh forex market mein price action par mobne he indicator ko janum deya ja sakta hey yeh forex trader ko precious baserat frahm kar saktay hein or en ko ani strategy mein zam karnay say he faida hota hey

    Understanding Price Action Trading

    forex market mein market mein market ke movement ko dakhnay kay ley price action he aik jaisa he hota hey forex market bar bar keya karte hey es bat ko bhe farz karen keh ap forex chart par chand pips par he hotay hein chand bar aik khas shape or triangle ban jata hey price bad mein aik khas direction ko follow karte nazar atte hey
    yeh triangle forex market mein aik khas direction ke taraf eshara kar rahay hotay hein price action forex market kay aglay step par nazar rakhtay hovay forex market ke movement ke taraf eshara kar rahay hotay hein aglay step par nazar rakhtay hovay market ke movement par he nazar rakh saktay hein yeh aik game mein pattern ko talash karnay or faiday kay ley estamal kar saktay hein

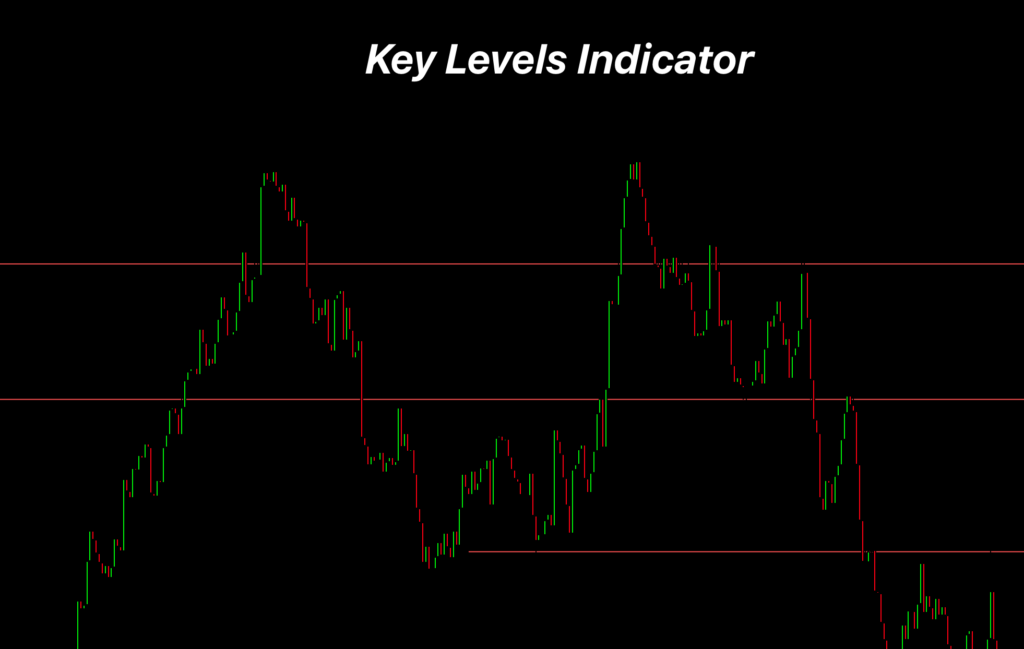
    Forex market mein price action aik key level ka he indicator hota hey

    forex market mein price action ko nechay dey gay chart mein ap daikh saktay hein keh yeh aik key level ka indicator he hota hey key level ka indicator forex market kay chart par overbought ya oversold ke level ko he identify kar sakta hey es kay baray mein yeh he sochna chihay keh woh jagah jahan par forex market overbought ya oversold ho jate hey hum yeh daikh saktay hein keh yahan par price action ketni bar tabdel ho jata hey or price zyada bar stop ho jate hey or kese khas jagah par ghoom jate hey to yeh forex market ke aik he level hote hey
    jab ap forex market mein apna chart par key level indicator ko shamel kartay hein to yeh forexmarket kay mumkana reversal zone ko he indicate kar sakta hey
    age forex market kay es lkey lvel mein aik bullish candlestick bante hey to es kay opposite key level mein bearish candlestick bhe ban sakte hey or price mein mumkana kame ko he tajweez kar sakte hey
    bhali kay badlay bhali
  • <a href="https://www.instaforex.org/ru/?x=ruforum">InstaForex</a>
  • #2 Collapse

    Price Action Indicator in Forex Trading

    Price Action trading ek method hai jisme traders historical prices ka analysis karke trading decisions lete hain, bina kisi traditional technical indicators jese ke Moving Averages, RSI, ya MACD ka use kiye. Is method mein price charts par patterns, trends, aur key levels jese ke support aur resistance ko identify karna shamil hota hai. Price Action trading ko ek "pure" form of trading maana jata hai kyunki isme sirf price data par focus hota hai, aur ye trader ko market ke real-time sentiment ka better understanding provide karta hai.

    Key Concepts of Price Action Trading
    1. Candlestick Patterns:
      • Price Action trading mein candlestick patterns ka analysis bahut important hota hai. Har candlestick market ke ek specific time period ka open, high, low, aur close price ko represent karti hai. Is analysis ke through traders market ke short-term aur long-term trends ko samajhte hain.
      • Common candlestick patterns include:
        • Engulfing Pattern (Bullish aur Bearish)
        • Doji Candlestick
        • Hammer aur Hanging Man
        • Pin Bar
        • Inside Bar
    2. Support and Resistance Levels:
      • Support Levels: Price ke wo levels jahan demand zyada hoti hai aur price neeche se upar ki taraf bounce karti hai. Ye levels buyers ke liye important buying opportunities indicate karte hain.
      • Resistance Levels: Price ke wo levels jahan supply zyada hoti hai aur price upar se neeche ki taraf reverse hoti hai. Ye levels sellers ke liye important selling opportunities indicate karte hain.
    3. Trendlines:
      • Trendlines ka use karke traders market ke overall trend direction ko identify karte hain. Trendlines ko chart par draw karke uptrend (higher highs aur higher lows) aur downtrend (lower highs aur lower lows) ko visualize kiya jata hai.
      • Uptrend: Ek line jo consecutive higher lows ko connect karti hai.
      • Downtrend: Ek line jo consecutive lower highs ko connect karti hai.
    4. Price Patterns:
      • Price action traders price patterns ko identify karte hain jo future price movements ka indication de sakte hain. Common price patterns mein include hote hain:
        • Head and Shoulders (aur Inverse Head and Shoulders)
        • Double Top aur Double Bottom
        • Triangles (Symmetrical, Ascending, Descending)
        • Flags aur Pennants
    5. Psychological Levels:
      • Psychological levels wo specific price points hote hain jahan traders ka sentiment strong hota hai. Commonly, ye levels round numbers par hote hain jese ke 1.2000, 1.3000 etc. Forex market mein, in levels par strong support ya resistance ka formation ho sakta hai.
    Click image for larger version

Name:	images (27).png
Views:	39
Size:	5.5 کلوبائٹ
ID:	13098445

    How to Trade Using Price Action
    1. Identify Market Structure:
      • Sabse pehle aapko market ka overall structure samajhna hoga. Kya market ek trend mein hai (uptrend ya downtrend), ya phir range-bound hai? Market structure ko samajhne ke liye price charts par highs, lows, support, aur resistance levels ko analyze karein.
    2. Look for Candlestick Patterns:
      • Price action trading mein candlestick patterns ko analyze karna bahut zaroori hota hai. Jaise hi aap ek strong candlestick pattern (jese ke Bullish Engulfing ya Pin Bar) identify karein, wo aapko ek potential trade setup provide kar sakta hai.
    3. Draw Support and Resistance Levels:
      • Price charts par significant support aur resistance levels ko draw karein. In levels ke aas paas price action ko closely observe karein. Agar price support level ke kareeb hai aur bullish candlestick pattern form hota hai, to ye buying opportunity ho sakti hai.
    4. Use Trendlines:
      • Trendlines ka use karke market ke trend ko confirm karein. Agar trendline intact hai aur price uske upar ya neeche move ho raha hai, to wo trend ki strength ko signify karta hai. Trendline break hona ek potential trend reversal ka signal ho sakta hai.
    5. Monitor Price Patterns:
      • Price patterns ko dekhna aur unke completion ka wait karna trading ke liye ek strong approach ho sakta hai. Jaise hi ek price pattern complete hota hai (jese ke Double Top ya Triangle Breakout), us point par trade enter kiya ja sakta hai.
    6. Psychological Levels ko Consider Karein:
      • Psychological levels par price action ko closely observe karein. Ye levels traders ke liye significant hote hain, aur in levels par strong market reactions ho sakte hain.
    Click image for larger version

Name:	images (12).jpeg
Views:	34
Size:	11.6 کلوبائٹ
ID:	13098446

    Advantages of Price Action Trading
    1. No Lag:
      • Price action indicators mein koi lag nahi hota kyunki ye historical price data ke bajaye real-time price movements par based hote hain.
    2. Market Sentiment:
      • Price action trading se aapko market ka real sentiment samajhne mein madad milti hai, jo ki indicator-based trading ke mukable mein zyada accurate ho sakta hai.
    3. Flexibility:
      • Price action trading ko kisi bhi market (forex, stocks, commodities) aur kisi bhi timeframe (5-minute chart, daily chart) par apply kiya ja sakta hai.
    Click image for larger version

Name:	images (26).png
Views:	34
Size:	7.5 کلوبائٹ
ID:	13098447

    Conclusion

    Price Action trading ek powerful approach hai jisme traders market ke historical price data aur chart patterns ka use karke trading decisions lete hain. Is method mein candlestick patterns, support aur resistance levels, trendlines, aur price patterns ka analysis karke profitable trading opportunities ko identify kiya jata hai. Price action trading market ke sentiment aur trend direction ka accurate understanding provide karti hai, lekin sahi trading strategies aur risk management ko follow karna zaroori hota hai taake market volatility ke risks ko minimize kiya ja sake.
    • #3 Collapse

      Price Action Indicator in Forex Trading

      1. Price Action Ki Bunyadi Samajh


      Price action trading forex market mein ek aise approach hai jahan traders price movements aur patterns ko analyze kar ke trading decisions lete hain. Is approach mein, kisi bhi technical indicator ki zaroorat nahi hoti, balke traders market ki real-time price movements par focus karte hain. Price action ki buniyad market ke price movements, highs aur lows par hoti hai. Traders market ke behavior ko samajhne ke liye price action patterns ka study karte hain jo market ke sentiment aur future price movements ka indication dete hain.

      Price action trading ka maqsad simple hai: market ke price movements ko dekh kar future price trends ko predict karna. Ye approach traders ko market ki asli condition ko samajhne mein madad karti hai aur unhe ek clear view provide karti hai. Jab traders price action ki buniyadi samajh rakhte hain, to wo market ke trends aur reversals ko accurately identify kar sakte hain. Isme price ke historical data aur patterns ka study karke market ki future movements ka andaza lagaya jata hai.

      Price action ki basic samajh se traders ko ye pata chal sakta hai ke market kis direction mein move kar rahi hai aur kis tarah se price ke movements market ke overall trend ko reflect karte hain. Traders ko yeh bhi dekhna padta hai ke price kis tarah se support aur resistance levels ko face karti hai aur kis tarah se price patterns bante hain. Price action ki buniyadi samajh market ke technical aspects ko simplify kar deti hai aur trading decisions ko easy banati hai.

      Price action analysis market ke volatility aur liquidity ko bhi consider karta hai. Market ki volatility price ke sudden movements ko reflect karti hai, jabke liquidity market mein available orders aur transactions ko show karti hai. Ye dono factors price action ko influence karte hain aur traders ko market ki asli condition ko samajhne mein madad dete hain. Is approach se traders ko market ke behavior ke baare mein accurate insights milti hain jo unke trading strategies ko guide karte hain.

      Price action ki samajh se traders ko market ke patterns aur trends ko identify karna aasan ho jata hai. Ye approach unhe market ke fluctuations ko dekh kar timely decisions lene ki ability deti hai. Price action trading ke zariye traders market ke real-time data ko analyze kar sakte hain aur apni trading strategies ko optimize kar sakte hain.
      2. Price Action Ka Maqsad


      Price action ka maqsad market ki asli behavior ko samajhna aur future price movements ko predict karna hota hai. Isme traders price ke historical data aur movements ko study karte hain aur is information ko future trading decisions ke liye use karte hain. Price action trading ka main focus price ke fluctuations aur patterns par hota hai, jo market ke sentiment aur trends ko reflect karte hain.

      Price action trading ka ek major advantage ye hai ke ye approach market ke real-time data ko consider karti hai. Jab traders price action analysis karte hain, to wo market ke current state aur sentiment ko samajh sakte hain. Is approach mein, price movements aur patterns ko dekh kar traders future price trends ka andaza lagate hain, jo unhe better trading decisions lene mein madad karta hai.

      Price action ka maqsad traders ko market ke behavior ko accurately samajhne aur timely decisions lene mein madad karna hai. Ye approach traders ko price movements ke basis par market ke trends aur reversals ko identify karne mein help karti hai. Jab traders price action ko samajh kar trading decisions lete hain, to wo market ki asli condition ko consider karte hain aur apne strategies ko accordingly adjust karte hain.

      Price action trading ka ek aur important aspect ye hai ke ye approach traders ko complex indicators aur signals ke bina market ko samajhne ki ability deti hai. Ye approach simple aur direct hai, jo traders ko market ke asli movements aur trends ko identify karne mein madad karti hai. Isme traders price ke historical data aur patterns ko study kar ke future price movements ko predict karte hain.

      Price action trading ka maqsad market ke fluctuations aur patterns ko samajhna hai, jo traders ko better trading decisions lene mein madad karti hai. Ye approach market ke sentiment aur trends ko accurately reflect karti hai aur traders ko timely aur informed decisions lene ki ability deti hai.
      3. Price Action Indicators Ka Introduction


      Price action indicators wo tools hain jo traders ko price movements aur patterns ko analyze karne mein madad dete hain. Ye indicators price ke historical data aur movements ko study kar ke market ke trends aur reversals ko identify karne mein useful hote hain. Price action indicators trading decisions ko support karte hain aur market ke overall trend ko identify karne mein help karte hain.

      Price action indicators ka main purpose ye hai ke ye traders ko market ke current state aur price movements ko accurately analyze karne mein madad karte hain. Ye indicators price ke fluctuations aur patterns ko reflect karte hain aur traders ko market ke trends aur reversals ko identify karne mein help karte hain. Price action indicators market ke sentiment aur behavior ko analyze karne mein useful hote hain.

      Price action indicators mein candlestick patterns, support aur resistance levels, aur trend lines shamil hain. Candlestick patterns jaise ke Doji, Hammer, aur Engulfing patterns market ke sentiment aur potential reversals ko indicate karte hain. Support aur resistance levels market ke price movements ko reflect karte hain aur market ke trends ko identify karne mein madad karte hain. Trend lines market ke overall direction ko identify karne mein help karte hain.

      Price action indicators trading strategies ko enhance karne ke liye use kiye jate hain. Ye indicators traders ko market ke trends aur reversals ko accurately identify karne mein madad karte hain. Iske zariye traders apni trading strategies ko optimize kar sakte hain aur market ke behavior ko better understand kar sakte hain.

      Price action indicators ki understanding se traders ko market ke price movements ko accurately analyze karne aur timely decisions lene mein madad milti hai. Ye indicators trading decisions ko support karte hain aur market ke trends aur reversals ko identify karne mein useful hote hain.
      4. Candlestick Patterns


      Candlestick patterns price action analysis mein ek important role play karte hain. In patterns ki madad se, traders market ke sentiment aur potential reversals ko identify kar sakte hain. Candlestick patterns price movements aur patterns ko reflect karte hain aur market ke behavior ko samajhne mein madad karte hain.

      Candlestick patterns ke kuch common examples mein Doji, Hammer, aur Engulfing patterns shamil hain. Doji pattern ek indecision ko indicate karta hai aur market ke potential reversals ko signal karta hai. Hammer pattern market ke bottom pe ek potential reversal ko indicate karta hai aur bullish trend ka signal hota hai. Engulfing pattern market ke sentiment aur potential trend reversal ko indicate karta hai.

      Candlestick patterns ko dekh kar traders market ke sentiment aur potential reversals ko accurately identify kar sakte hain. Ye patterns price ke fluctuations aur market ke behavior ko reflect karte hain aur traders ko trading decisions lene mein madad karte hain. Candlestick patterns trading strategies ko optimize karne ke liye bhi use kiye jate hain.

      Candlestick patterns ka analysis karne ke liye traders ko market ke price movements aur patterns ko closely observe karna padta hai. Ye patterns market ke behavior aur sentiment ko accurately reflect karte hain aur traders ko market ke trends aur reversals ko identify karne mein help karte hain. Candlestick patterns ki understanding se traders ko better trading decisions lene mein madad milti hai.

      Candlestick patterns trading mein ek important tool hain jo traders ko market ke sentiment aur potential reversals ko identify karne mein madad karte hain. In patterns ka study karke traders market ke behavior ko accurately samajh sakte hain aur apni trading strategies ko optimize kar sakte hain.
      5. Support Aur Resistance Levels


      Support aur resistance levels price action analysis ka ek core component hain. Ye levels price ke historical movements aur patterns ko reflect karte hain aur market ke trends ko identify karne mein madad karte hain. Support level wo point hai jahan price ne niche girne se pehle ek resistance face ki hoti hai, jabke resistance level wo point hai jahan price ne upar jaane se pehle ek support face ki hoti hai.

      Support level ek aise level ko indicate karta hai jahan price ne niche girne se pehle ek resistance face ki hoti hai. Ye level market ke sentiment aur price movements ko reflect karta hai aur traders ko market ke potential reversals ko identify karne mein madad karta hai. Support level ko identify karke traders market ke bottom pe buying opportunities ko recognize kar sakte hain.

      Resistance level ek aise level ko indicate karta hai jahan price ne upar jaane se pehle ek support face ki hoti hai. Ye level market ke sentiment aur price movements ko reflect karta hai aur traders ko market ke potential reversals ko identify karne mein madad karta hai. Resistance level ko identify karke traders market ke top pe selling opportunities ko recognize kar sakte hain.

      Support aur resistance levels ka analysis karne se traders ko market ke price movements aur trends ko accurately identify karne mein madad milti hai. Ye levels market ke behavior aur sentiment ko reflect karte hain aur traders ko trading decisions lene mein madad karte hain. Support aur resistance levels trading strategies ko optimize karne ke liye bhi use kiye jate hain.

      Support aur resistance levels ki understanding se traders ko market ke potential reversals aur trends ko accurately identify karne mein madad milti hai. Ye levels market ke behavior aur sentiment ko reflect karte hain aur traders ko better trading decisions lene mein help karte hain.
      6. Trend Lines


      Trend lines price action analysis mein trend ke direction ko identify karne ke liye use kiye jate hain. Trend lines ko draw karne ke liye, traders highs aur lows ko connect karte hain, jo market ki overall direction ko clear karta hai. Trend lines market ke trends aur reversals ko accurately identify karne mein madad karte hain aur traders ko market ke behavior ko samajhne mein help karte hain.

      Trend lines ko draw karne ke liye, traders market ke highs aur lows ko identify karte hain aur in points ko connect karte hain. Is process se ek trend line create hoti hai jo market ke overall direction ko indicate karti hai. Trend lines ko dekh kar traders market ke trends aur potential reversals ko identify kar sakte hain aur apni trading strategies ko optimize kar sakte hain.

      Trend lines ka analysis karne se traders ko market ke direction aur sentiment ko accurately identify karne mein madad milti hai. Ye lines market ke behavior aur price movements ko reflect karti hain aur traders ko timely decisions lene mein help karti hain. Trend lines trading strategies ko enhance karne ke liye bhi use kiye jate hain.

      Trend lines ki understanding se traders ko market ke trends aur reversals ko accurately identify karne mein madad milti hai. Ye lines market ke overall direction ko indicate karti hain aur traders ko better trading decisions lene mein help karti hain. Trend lines market ke fluctuations aur price movements ko reflect karte hain aur traders ko market ke behavior ko samajhne mein madad karte hain.

      Trend lines ka use karne se traders ko market ke trends aur reversals ko identify karne mein madad milti hai. Ye lines market ke overall direction ko indicate karti hain aur traders ko trading decisions lene mein help karti hain. Trend lines ka analysis market ke behavior aur sentiment ko accurately reflect karta hai aur traders ko better trading strategies develop karne mein madad karta hai.
      7. Chart Patterns


      Chart patterns price action analysis mein ek important role play karte hain. Ye patterns market ke potential reversals aur continuations ko indicate karte hain aur traders ko trading decisions lene mein madad karte hain. Chart patterns market ke behavior aur sentiment ko reflect karte hain aur traders ko market ke trends aur reversals ko accurately identify karne mein help karte hain.

      Chart patterns ke kuch common examples mein Head and Shoulders, Double Top, aur Double Bottom shamil hain. Head and Shoulders pattern market ke potential reversals ko indicate karta hai aur traders ko market ke sentiment ko accurately samajhne mein madad karta hai. Double Top aur Double Bottom patterns market ke trend reversals aur continuations ko identify karne mein help karte hain.

      Chart patterns ko analyze karne se traders ko market ke trends aur reversals ko accurately identify karne mein madad milti hai. Ye patterns market ke behavior aur sentiment ko reflect karte hain aur traders ko timely decisions lene mein help karte hain. Chart patterns ki understanding se traders ko better trading strategies develop karne mein madad milti hai.

      Chart patterns ka analysis market ke fluctuations aur price movements ko accurately reflect karta hai. Ye patterns market ke potential reversals aur continuations ko indicate karte hain aur traders ko trading decisions lene mein madad karte hain. Chart patterns ka use karne se traders ko market ke behavior aur sentiment ko accurately samajhne mein madad milti hai.

      Chart patterns ki understanding se traders ko market ke trends aur reversals ko accurately identify karne mein madad milti hai. Ye patterns market ke behavior aur sentiment ko reflect karte hain aur traders ko better trading decisions lene mein help karte hain. Chart patterns ka analysis market ke overall direction aur trends ko accurately indicate karta hai aur traders ko trading strategies ko optimize karne mein madad karta hai.
      8. Pin Bar


      Pin Bar ek important candlestick pattern hai jo potential reversals ko indicate karta hai. Is pattern mein ek long wick aur choti body hoti hai, jo market ke sentiment ko reflect karti hai aur potential trend reversal ko signal karti hai. Pin Bar pattern traders ko market ke potential reversals aur trends ko accurately identify karne mein madad karta hai.

      Pin Bar pattern ko dekh kar traders market ke sentiment aur potential reversals ko accurately identify kar sakte hain. Is pattern mein long wick aur choti body market ke sentiment ko reflect karti hai aur potential trend reversal ka signal deti hai. Pin Bar pattern ka analysis market ke behavior aur price movements ko accurately reflect karta hai.

      Pin Bar pattern ka use trading decisions ko guide karne ke liye kiya jata hai. Ye pattern market ke potential reversals aur trends ko accurately identify karne mein madad karta hai aur traders ko timely decisions lene mein help karti hai. Pin Bar pattern ki understanding se traders market ke behavior ko accurately samajh sakte hain.

      Pin Bar pattern ka analysis market ke sentiment aur potential reversals ko accurately reflect karta hai. Ye pattern market ke price movements aur fluctuations ko indicate karta hai aur traders ko better trading decisions lene mein madad karta hai. Pin Bar pattern ka use trading strategies ko optimize karne ke liye bhi kiya jata hai.

      Pin Bar pattern ki understanding se traders ko market ke trends aur reversals ko accurately identify karne mein madad milti hai. Ye pattern market ke sentiment aur potential reversals ko reflect karta hai aur traders ko timely aur informed decisions lene mein help karti hai.
      9. Inside Bar


      Inside Bar ek candlestick pattern hai jisme ek bar ke andar dusri bar hoti hai. Ye pattern market ke consolidation ya indecision ko indicate karta hai aur future price movement ka signal de sakta hai. Inside Bar pattern traders ko market ke potential reversals aur trends ko accurately identify karne mein madad karta hai.

      Inside Bar pattern ko dekh kar traders market ke consolidation aur indecision ko accurately identify kar sakte hain. Ye pattern market ke behavior aur sentiment ko reflect karta hai aur potential trend reversal ya continuation ka signal deti hai. Inside Bar pattern ka analysis trading decisions ko guide karne mein help karta hai.

      Inside Bar pattern ka use trading strategies ko optimize karne ke liye kiya jata hai. Ye pattern market ke potential reversals aur trends ko accurately identify karne mein madad karta hai aur traders ko timely decisions lene mein help karti hai. Inside Bar pattern ki understanding se traders market ke behavior ko accurately samajh sakte hain.

      Inside Bar pattern ka analysis market ke fluctuations aur price movements ko accurately reflect karta hai. Ye pattern market ke consolidation aur indecision ko indicate karta hai aur traders ko better trading decisions lene mein madad karta hai. Inside Bar pattern ka use trading decisions ko support karne ke liye bhi kiya jata hai.

      Inside Bar pattern ki understanding se traders ko market ke potential reversals aur trends ko accurately identify karne mein madad milti hai. Ye pattern market ke behavior aur sentiment ko reflect karta hai aur traders ko timely aur informed decisions lene mein help karti hai.
      10. Breakout Patterns


      Breakout patterns price action analysis mein important role play karte hain. Ye patterns tab bante hain jab price ek specific level ko break karti hai, jo ek new trend ka signal ho sakta hai. Common breakout patterns mein flags aur pennants shamil hain. Breakout patterns market ke behavior aur sentiment ko accurately reflect karte hain aur traders ko market ke trends aur reversals ko identify karne mein madad karte hain.

      Flags aur pennants breakout patterns ke common examples hain jo traders ko market ke potential trends aur reversals ko identify karne mein madad karte hain. Flags pattern ek strong trend ke baad market ke consolidation ko indicate karta hai aur potential continuation ka signal deta hai. Pennants pattern bhi consolidation ko indicate karta hai aur market ke potential continuation ka signal deta hai.

      Breakout patterns ka analysis market ke price movements aur trends ko accurately reflect karta hai. Ye patterns market ke potential trends aur reversals ko identify karne mein madad karte hain aur traders ko timely decisions lene mein help karti hain. Breakout patterns ki understanding se traders market ke behavior ko accurately samajh sakte hain.

      Breakout patterns ka use trading strategies ko optimize karne ke liye bhi kiya jata hai. Ye patterns market ke trends aur reversals ko accurately identify karne mein madad karte hain aur traders ko better trading decisions lene mein help karti hain. Breakout patterns ka analysis market ke fluctuations aur price movements ko reflect karta hai aur traders ko market ke behavior ko samajhne mein madad karta hai.

      Breakout patterns ki understanding se traders ko market ke potential trends aur reversals ko accurately identify karne mein madad milti hai. Ye patterns market ke behavior aur sentiment ko reflect karte hain aur traders ko timely aur informed decisions lene mein help karti hain.
      11. Trading with Price Action


      Price action trading mein, traders market ki movements ko observe karte hain aur trading decisions lete hain bina kisi lagging indicators ke. Ye approach unhe zyada flexibility aur real-time insights provide karti hai, jo unki trading strategies ko enhance karte hain. Price action trading ka main focus market ke real-time data aur price movements par hota hai, jo traders ko market ke trends aur reversals ko accurately identify karne mein madad karta hai.

      Price action trading mein traders market ke price movements aur patterns ko closely observe karte hain. Is approach ka main advantage ye hai ke traders ko market ke current state aur sentiment ko accurately analyze karne ki ability milti hai. Price action trading se traders ko market ke trends aur reversals ko identify karne mein madad milti hai aur wo timely decisions le sakte hain.

      Price action trading ki understanding se traders ko market ke behavior aur sentiment ko accurately samajhne mein madad milti hai. Ye approach traders ko complex indicators aur signals ke bina market ko samajhne ki ability deti hai. Price action trading ka use trading strategies ko optimize karne ke liye bhi kiya jata hai, jo traders ko better trading decisions lene mein help karti hai.

      Price action trading mein, traders market ke price movements aur patterns ko observe karte hain aur trading decisions lete hain bina kisi lagging indicators ke. Ye approach unhe zyada flexibility aur real-time insights provide karti hai, jo unki trading strategies ko enhance karte hain. Price action trading se traders ko market ke trends aur reversals ko accurately identify karne ki ability milti hai.

      Price action trading ki understanding se traders ko market ke behavior aur sentiment ko accurately samajhne mein madad milti hai. Ye approach traders ko complex indicators aur signals ke bina market ko samajhne ki ability deti hai. Price action trading ka use trading strategies ko optimize karne ke liye bhi kiya jata hai, jo traders ko better trading decisions lene mein help karti hai.
      12. Conclusion


      Price action analysis trading mein ek important tool hai jo traders ko market ke behavior aur trends ko accurately samajhne mein madad karta hai. Price action analysis ke various elements, jaise ke candlestick patterns, trend lines, aur chart patterns, traders ko market ke potential reversals aur trends ko identify karne mein help karte hain. Ye elements trading decisions ko guide karte hain aur traders ko better trading strategies develop karne mein madad karte hain.

      Price action analysis ki understanding se traders ko market ke behavior aur sentiment ko accurately reflect karne ki ability milti hai. Is approach se traders market ke trends aur reversals ko accurately identify kar sakte hain aur timely decisions le sakte hain. Price action analysis trading strategies ko enhance karne ke liye bhi use kiya jata hai, jo traders ko better trading decisions lene mein help karti hai.

      Price action analysis ka main advantage ye hai ke ye market ke real-time data aur price movements ko reflect karta hai. Is approach se traders ko complex indicators aur signals ke bina market ke trends aur reversals ko identify karne ki ability milti hai. Price action analysis trading decisions ko guide karne ke liye bhi use kiya jata hai, jo traders ko better trading strategies develop karne mein madad karti hai.

      Price action analysis ke elements market ke behavior aur sentiment ko accurately reflect karte hain aur traders ko timely decisions lene mein help karte hain. Is analysis se traders market ke trends aur reversals ko accurately identify kar sakte hain aur apni trading strategies ko optimize kar sakte hain. Price action analysis ki understanding se traders ko market ke behavior ko accurately samajhne ki ability milti hai, jo unki trading strategies ko enhance karti hai.

      Price action analysis trading mein ek valuable tool hai jo traders ko market ke trends aur reversals ko accurately identify karne mein madad karta hai. Ye analysis market ke behavior aur sentiment ko reflect karta hai aur traders ko better trading decisions lene mein help karti hai. Price action analysis ki understanding se traders ko market ke potential reversals aur trends ko accurately identify karne ki ability milti hai, jo unki trading strategies ko optimize karti hai.
       
      • #4 Collapse

        Price Action Indicator: Ek Mukammal Rehnuma


        1. Price Action Indicator Kya Hai?

        Price Action Indicator ek aisa trading tool hai jo sirf price ke movements ko analyze karta hai. Iska main focus price movements aur trends par hota hai aur isme kisi bhi additional technical indicators ki zaroorat nahi hoti. Ye indicator traders ko market ki real-time situation dikhata hai aur unhe potential trading opportunities identify karne mein madad karta hai.

        Price action analysis ka basic principle ye hai ke market ke past price movements ko dekh kar future price movements ka andaza lagaya jaye. Ismein candlestick patterns, price bars, aur chart patterns shamil hote hain. Traders jo technical indicators ke bajaye price action ka use karte hain, wo market ki actual conditions ko better samajhte hain aur apni trading strategies ko accordingly adjust kar sakte hain.

        Ek trader jo price action ko use karta hai, wo market ki price charts ko analyze karta hai aur price ke movements aur patterns ko dekh kar trading decisions leta hai. Price action trading ka main faida ye hai ke ye market ki volatility aur price movements ko directly reflect karta hai, jo ke traders ko zyada accurate aur timely information provide karta hai.

        Price action analysis ke zariye traders market ki sentiment aur trend ko samajhne ki koshish karte hain. Ye analysis traders ko help karta hai ke wo market ke behavior ko better understand kar sakein aur apni trading strategies ko accordingly develop kar sakein. Is tool ke through, traders market ke potential reversals aur continuations ko bhi identify kar sakte hain.

        Price Action Indicator ki sabse badi khasiyat ye hai ke ye traders ko indicators aur lagging tools ke bina market ke real-time data par analysis karne ki ability deta hai. Ye method traders ko market ki overall health aur price trends ke baare mein clear insight provide karta hai, jo ke trading decisions ko enhance karta hai.

        2. Price Action Indicator Ki Ahmiyat

        Price Action Indicator ki ahmiyat ko samajhna traders ke liye zaroori hai kyunki ye market analysis ka ek fundamental tool hai. Jab traders price action indicators ka use karte hain, to wo market ke trends aur price movements ko zyada behtar samajh sakte hain. Isse unhe entry aur exit points identify karne mein madad milti hai, jo ke successful trading ke liye crucial hai.

        Price action trading ka main advantage ye hai ke ye traders ko market ke real-time behavior ko directly dekhne ka mauka deta hai. Traditional indicators jaise moving averages ya RSI (Relative Strength Index) ke comparison mein, price action indicators direct price movements ko analyze karte hain, jo ke zyada accurate aur timely insights provide karta hai.

        Price Action Indicator ki madad se traders market ki momentum aur volatility ko analyze kar sakte hain. Jab price action indicators ka analysis kiya jata hai, to traders ko market ki strength aur weaknesses ka pata lagta hai, jo unhe profitable trading opportunities identify karne mein madad karta hai. Ye indicators traders ko market trends ke direction aur potential reversals ka bhi idea dete hain.

        Ek aur important aspect jo Price Action Indicator ki ahmiyat ko badhata hai, wo hai iski simplicity. Traditional indicators complex ho sakte hain aur unki interpretation bhi challenging hoti hai. Lekin Price Action Indicators straightforward hote hain aur traders ko market ke movements ko directly dekhne aur samajhne ka mauka dete hain.

        Price Action Indicator ko use karne se traders ko market ke underlying dynamics ko better samajhne ka mauka milta hai. Ye indicator traders ko market ke actual conditions ko reflect karta hai aur unki trading strategies ko enhance karta hai, jo ke long-term success ke liye zaroori hai.

        3. Basic Price Action Concepts

        Price Action Indicator ka core basic concepts price bars, candlestick patterns, aur chart patterns hain. Price bars market ke price movements ko show karte hain aur ye traders ko ek visual representation provide karte hain ke market ka trend kis direction mein move kar raha hai.

        Candlestick patterns trading ke liye ek important tool hain. In patterns ka use market ke potential reversals aur continuations ko identify karne ke liye hota hai. Candlestick patterns, jaise ki Doji, Engulfing, aur Hammer, market ki sentiment aur trend reversal signals ko denote karte hain. Har pattern ka apna ek specific meaning hota hai jo traders ko market ke future movements ke baare mein insight provide karta hai.

        Chart patterns bhi price action trading mein bohot important role play karte hain. Common chart patterns mein Head and Shoulders, Double Top/Bottom, aur Triangles shamil hain. Ye patterns traders ko market ke potential reversal points aur trend continuation points ko identify karne mein madad karte hain.

        Price action ke basic concepts ko samajhne se traders ko market ke behavior ko better understand karne ka mauka milta hai. Ye concepts traders ko entry aur exit points identify karne mein help karte hain aur unki trading decisions ko enhance karte hain.

        Price action trading ka basic principle ye hai ke market ke price movements ko analyze karne se future price movements ka prediction kiya jaye. Ismein various patterns aur trends ko identify karke traders market ke potential opportunities ko capitalize karte hain.

        4. Support Aur Resistance Levels

        Support aur resistance levels price action trading ke fundamental concepts hain. Support level wo point hai jahan price girti hai aur ruk jati hai, jabke resistance level wo point hai jahan price barh kar rukti hai. Ye levels market ke price movements ke key points ko denote karte hain aur traders ko market ke behavior ko samajhne mein madad karte hain.

        Support level ko identify karna traders ke liye zaroori hai kyunki ye unhe potential buying opportunities identify karne mein madad karta hai. Jab price support level tak pohnchti hai aur wahan se bounce back karti hai, to ye traders ke liye buying signal ho sakta hai.

        Resistance level bhi equally important hai kyunki ye traders ko potential selling opportunities identify karne mein help karta hai. Jab price resistance level tak pohnchti hai aur wahan se reverse hoti hai, to ye traders ke liye selling signal ho sakta hai.

        Support aur resistance levels ko identify karne se traders ko market ke trend ko better understand karne ka mauka milta hai. Ye levels traders ko market ke key points aur potential price reversals ke baare mein insight provide karte hain.

        Market ke price movements ko analyze karte waqt, support aur resistance levels ko consider karna trading decisions ko enhance karta hai. Ye levels traders ko market ke behavior aur price trends ke baare mein clear understanding provide karte hain, jo ke successful trading ke liye crucial hai.

        5. Trend Lines Aur Channels

        Trend lines aur channels price action trading mein key tools hain. Trend lines market ke trend ko represent karte hain aur traders ko market ke direction ko identify karne mein madad karte hain. Trend lines ko draw karne ke liye, traders market ke highs aur lows ko connect karte hain, jisse ek clear trend line form hoti hai.

        Trend lines ko use karke traders market ke trend ko analyze kar sakte hain aur potential trading opportunities ko identify kar sakte hain. Jab price trend line ke upar ya niche move karti hai, to ye traders ko trend reversal ya continuation signals provide karta hai.

        Channels price ke movement ko ek defined range mein represent karte hain. Channels ke do lines hoti hain: ek upper boundary aur ek lower boundary. Price ke in boundaries ke beech move karne se traders ko market ke range-bound behavior ka pata lagta hai.

        Channels ko use karke traders market ke range aur potential breakout points ko identify kar sakte hain. Jab price channel ke upper boundary ko break karti hai, to ye bullish signal ho sakta hai, aur jab price lower boundary ko break karti hai, to ye bearish signal ho sakta hai.

        Trend lines aur channels ko analyze karne se traders ko market ke direction aur potential reversals ke baare mein better understanding milti hai. Ye tools market ke price movements aur trends ko samajhne mein madad karte hain aur trading decisions ko enhance karte hain.

        6. Price Action Patterns

        Price Action Patterns market ke potential reversal aur continuation points ko identify karne ke liye use hote hain. Common price action patterns mein Head and Shoulders, Double Top/Bottom, aur Triangles shamil hain. Har pattern ka apna ek specific meaning hota hai jo traders ko market ke future movements ke baare mein insight provide karta hai.

        Head and Shoulders pattern ek trend reversal pattern hai jo ke market ke top ya bottom par form hota hai. Ye pattern ek peak (head) ke sath do smaller peaks (shoulders) ko show karta hai aur market ke potential reversal point ko indicate karta hai.

        Double Top aur Double Bottom patterns bhi trend reversal patterns hain. Double Top pattern market ke bullish trend ke end ko indicate karta hai jab price do bar same high ko touch karti hai aur phir reverse hoti hai. Double Bottom pattern market ke bearish trend ke end ko indicate karta hai jab price do bar same low ko touch karti hai aur phir upar ki taraf move karti hai.

        Triangles patterns market ke consolidation aur continuation points ko represent karte hain. Triangles patterns, jaise ke Symmetrical Triangle, Ascending Triangle, aur Descending Triangle, market ke price movements ko ek defined pattern mein show karte hain aur potential breakout points ko indicate karte hain.

        Price Action Patterns ko identify karne se traders ko market ke potential reversals aur continuations ka idea milta hai. Ye patterns traders ko market ke future movements ko predict karne mein madad karte hain aur unki trading strategies ko enhance karte hain.

        7. Breakouts Aur Fakeouts

        Breakouts aur fakeouts price action trading mein important concepts hain. Breakouts wo moments hote hain jab price ek key level, jaise support ya resistance level, ko cross karti hai. Jab price breakout hota hai, to ye market ke new trend ya momentum ko indicate karta hai.

        Breakouts traders ke liye potential trading opportunities ko identify karne ka mauka dete hain. Jab price ek breakout level ko cross karti hai, to traders ko buying ya selling signals milte hain, jo unhe profitable trades execute karne mein madad karte hain.

        Fakeouts wo moments hote hain jab price temporarily ek key level ko cross karti hai lekin phir wapas aa jati hai. Fakeouts market ke short-term movements ko show karte hain aur traders ko potential false signals provide karte hain. Traders ko fakeouts ko identify karne ki ability honi chahiye taake wo losses ko minimize kar sakein.

        Breakouts aur fakeouts ko analyze karne se traders ko market ke behavior aur potential trading opportunities ka better understanding milta hai. Ye concepts traders ko market ke real-time movements aur trends ko samajhne mein madad karte hain aur unki trading decisions ko enhance karte hain.

        Effective trading ke liye, traders ko breakouts aur fakeouts ko accurately identify karna aana chahiye. Isse wo market ke actual movements ko samajh sakte hain aur profitable trading decisions le sakte hain.

        8. Volume Aur Price Action

        Volume price action trading ke sath closely related hai. Volume market ke trading activity ko represent karta hai aur ye traders ko market ke strength aur weaknesses ka idea deta hai. High trading volume price movements ko zyada significant banata hai aur low trading volume se market ke movements kam significant ho sakte hain.

        Volume analysis se traders ko market ki strength aur momentum ka pata lagta hai. Jab trading volume high hota hai, to price movements zyada reliable aur significant hote hain. Volume analysis se traders market ke potential reversals aur continuations ko bhi identify kar sakte hain.

        Volume ka use karke traders price action ke sath corresponding volume patterns ko dekh kar trading decisions le sakte hain. Volume spikes aur trends market ke potential breakouts aur reversals ko indicate karte hain.

        Volume aur price action ko combine karke traders ko market ke behavior aur trends ka better understanding milta hai. Ye combination traders ko zyada accurate aur timely trading signals provide karta hai aur unki trading strategies ko enhance karta hai.

        Volume analysis se traders ko market ke underlying strength aur weaknesses ka pata lagta hai. Isse wo market ke potential trading opportunities ko identify kar sakte hain aur apni trading decisions ko accordingly adjust kar sakte hain.

        9. Risk Management Aur Price Action

        Risk management price action trading ka ek ahem part hai. Effective risk management se traders apne capital ko protect kar sakte hain aur unke trading losses ko minimize kar sakte hain. Risk management ke techniques, jaise stop-loss aur take-profit levels, trading strategies ko enhance karte hain aur traders ko market ke volatility se bachaate hain.

        Stop-loss level wo point hai jahan traders apne losses ko limit karte hain. Jab price stop-loss level tak pohnchti hai, to trade automatically close ho jati hai. Isse traders ko unnecessary losses se bachaaya ja sakta hai aur capital ko protect kiya ja sakta hai.

        Take-profit level wo point hai jahan traders apne profits ko secure karte hain. Jab price take-profit level tak pohnchti hai, to trade automatically close ho jati hai aur profit realize ho jata hai. Isse traders apne profits ko maximize kar sakte hain aur trading goals achieve kar sakte hain.

        Risk management ke strategies ko implement karke traders apne capital ko protect kar sakte hain aur unki trading performance ko improve kar sakte hain. Effective risk management se traders market ke potential risks ko manage kar sakte hain aur unki trading success ko enhance kar sakte hain.

        Risk management ka main goal ye hai ke traders apne trading capital ko protect kar sakein aur consistent profits achieve kar sakein. Isse traders ko market ke volatility aur uncertainty ko handle karne mein madad milti hai aur unki overall trading performance improve hoti hai.

        10. Price Action Aur Market Sentiment

        Price Action Indicator market sentiment ko reflect karta hai. Market sentiment traders ke collective emotions aur perceptions ko denote karta hai aur price action indicators market ke sentiment changes ko track karte hain. Agar market bullish hai, to price movements upar ki taraf honge aur agar bearish hai, to movements niche ki taraf honge.

        Market sentiment ko samajhna trading decisions mein madadgar hota hai. Jab market sentiment bullish hota hai, to traders ko buying opportunities identify karne ka mauka milta hai. Similarly, jab market sentiment bearish hota hai, to traders ko selling opportunities identify karne ka mauka milta hai.

        Price action trading ka main advantage ye hai ke ye market ke sentiment ko directly reflect karta hai. Traders jo market sentiment ko accurately analyze karte hain, wo apne trading decisions ko enhance kar sakte hain aur profitable trades execute kar sakte hain.

        Market sentiment analysis se traders ko market ke overall behavior aur trends ka pata lagta hai. Ye analysis traders ko market ke potential reversals aur continuations ka idea deta hai aur unki trading strategies ko accordingly adjust karne mein madad karta hai.

        Price Action Indicator ka use karke traders market ke sentiment changes ko track kar sakte hain aur apne trading decisions ko market ke behavior ke according adjust kar sakte hain. Isse traders ki trading performance aur success ko improve kiya ja sakta hai.

        11. Scalping Aur Price Action

        Scalping ek trading strategy hai jisme traders choti price movements ko capitalize karte hain. Scalping mein traders short-term price movements aur quick trades pe focus karte hain. Price Action Indicator scalping strategies mein help kar sakta hai kyunki ye short-term price movements aur trends ko identify karta hai.

        Scalping ke liye, traders ko price action ke quick patterns aur signals ko analyze karna aata hai. Price Action Indicator scalping traders ko market ke short-term trends aur price movements ka insight provide karta hai, jo unhe quick trading decisions lene mein madad karta hai.

        Scalping mein success ke liye, traders ko accurate aur timely signals ki zaroorat hoti hai. Price Action Indicator scalping strategies ko enhance karta hai by providing clear signals aur patterns jo traders ko profitable trades execute karne mein help karte hain.

        Scalping aur Price Action Indicator ka combination traders ko short-term market movements ko efficiently capture karne ka mauka deta hai. Is combination se traders quick profits achieve kar sakte hain aur market ke rapid changes ka faida utha sakte hain.

        Effective scalping ke liye, traders ko price action patterns aur signals ko accurately analyze karna aana chahiye. Isse wo market ke short-term opportunities ko capitalize kar sakte hain aur apne trading performance ko improve kar sakte hain.

        12. Swing Trading Aur Price Action

        Swing trading ek trading style hai jisme traders short to medium-term trends ko follow karte hain. Swing traders market ke price swings aur movements ko capitalize karte hain aur Price Action Indicator swing trading strategies ko support karta hai by helping traders identify entry aur exit points.

        Swing trading ke liye, traders ko price action ke intermediate patterns aur trends ko analyze karna hota hai. Price Action Indicator swing traders ko market ke price swings aur trend reversals ka insight provide karta hai, jo unhe trading decisions ko better plan karne mein madad karta hai.

        Swing trading aur Price Action Indicator ka combination traders ko market ke medium-term movements ko efficiently capture karne ka mauka deta hai. Ye combination traders ko market ke potential opportunities ko identify karne aur unhe capitalize karne mein madad karta hai.

        Effective swing trading ke liye, traders ko price action patterns aur trends ko accurately identify karna aana chahiye. Isse wo market ke swings aur potential reversals ko dekh kar profitable trades execute kar sakte hain aur apni trading performance ko enhance kar sakte hain.

        Swing trading aur Price Action Indicator ka use karke traders market ke medium-term opportunities ko capitalize kar sakte hain aur apne trading goals achieve kar sakte hain. Ye combination traders ko market ke overall trends aur movements ko samajhne mein madad karta hai.

        13. Long-Term Investing Aur Price Action

        Long-term investing mein traders price action ko use karke long-term trends ko identify karte hain. Long-term investors market ke overall trends aur movements ko analyze karte hain aur Price Action Indicator long-term investment strategies ko enhance karta hai by providing insights into market direction aur trends.

        Long-term investing ke liye, traders ko price action ke broader patterns aur trends ko analyze karna hota hai. Price Action Indicator long-term investors ko market ke overall direction aur potential investment opportunities ka idea deta hai, jo unhe successful long-term investments mein madad karta hai.

        Price Action Indicator ka use karke long-term investors market ke key levels aur trends ko identify kar sakte hain. Ye indicator investors ko market ke potential reversals aur continuations ka insight provide karta hai aur unki investment strategies ko enhance karta hai.

        Long-term investing aur Price Action Indicator ka combination investors ko market ke long-term movements ko better understand karne ka mauka deta hai. Isse investors market ke potential opportunities ko identify kar sakte hain aur apne investment decisions ko accordingly adjust kar sakte hain.

        Effective long-term investing ke liye, traders ko price action aur market trends ko accurately analyze karna aana chahiye. Isse wo market ke long-term opportunities ko capitalize kar sakte hain aur apne investment goals achieve kar sakte hain.

        14. Price Action Indicator Ka Future

        Price Action Indicator ka future advancements ke sath aur bhi promising ho sakta hai. Artificial Intelligence (AI) aur machine learning ke integration se Price Action Indicator ki capabilities aur bhi enhance ho sakti hain. AI aur machine learning algorithms market ke price movements aur patterns ko accurately analyze karne mein madad karte hain.

        Future mein, Price Action Indicators ki accuracy aur efficiency improve ho sakti hai with the help of advanced technologies. Ye advancements traders ko zyada accurate aur timely insights provide karenge aur unki trading strategies ko enhance karenge.

        AI aur machine learning ke integration se Price Action Indicators market ke complex patterns aur trends ko analyze kar sakte hain. Isse traders ko market ke potential opportunities aur risks ke baare mein better understanding milti hai aur unki trading performance improve hoti hai.

        Price Action Indicators ke future advancements traders ko market ke behavior aur trends ko accurately predict karne ka mauka denge. Ye advancements traders ko zyada effective aur profitable trading decisions lene mein madad karenge aur unki overall trading success ko enhance karenge.

        Overall, Price Action Indicator ka future bright hai aur advanced technologies ke sath iska potential aur bhi badh sakta hai. Traders ko is technology ke advancements ke sath up-to-date rehna zaroori hai taake wo market trends aur price movements ko behtar samajh sakein.
        • #5 Collapse

          Price Action Indicator: A Comprehensive Guide

          1. Introduction to Price Action Indicator

          Price Action Indicator trading ki duniya mein ek aham tool hai jo traders ko market ke price movements ko samajhne aur analyze karne mein madad karta hai. Is approach ko istemal karke, traders market ke price trends aur patterns ko dekh sakte hain bina kisi complex indicators ya lagging data ke. Price action ka focus pure market ki price movements par hota hai, jo ki trading decisions ko banate waqt ek clear aur direct view provide karta hai. Iski simplicity aur effectiveness ki wajah se yeh approach popular hai aur kai traders isse apni trading strategies mein include karte hain.

          Price action trading mein, traders historical price data aur chart patterns ko analyze karte hain. Yeh analysis price movement ke patterns aur trends ko identify karne mein help karta hai. Yeh method traditional technical indicators se mukhtalif hai, jo complex calculations aur lagging data pe depend karte hain. Price action indicators direct market data ko use karte hain, jo ki timely aur accurate decision-making ko facilitate karta hai.

          Ek key aspect of price action trading yeh hai ki yeh market ke current conditions ko reflect karta hai. Jab price action indicators ka use kiya jata hai, traders market ke real-time movements aur trends ko dekh sakte hain. Is approach ka use karke, traders market ke behavior ko samajh kar apne trading decisions ko optimize kar sakte hain. Yeh technique trading mein clarity aur precision ko enhance karti hai, jo ke long-term success ke liye zaroori hai.

          Price action trading mein ek aur important element yeh hai ki yeh traders ko market ke noise se door rakhta hai. Market mein kai aise factors hote hain jo price movements ko affect karte hain, lekin price action analysis in factors ko ignore karke direct price movements ko focus karta hai. Is approach ke zariye, traders market ke noise aur distractions se bach sakte hain aur clear trading signals ko identify kar sakte hain.

          Agar aap price action trading ko seriously pursue karna chahte hain, toh aapko iske fundamental concepts aur techniques ko samajhna zaroori hai. Yeh approach trading ki duniya mein ek valuable skill hai, jo ki market analysis aur decision-making ko improve kar sakti hai. Is guide mein, hum price action indicators ke different types aur unke practical applications ko detail mein cover karenge, taake aap is approach ko effectively use kar sakein.

          2. Price Action Ki Basic Definition

          Price action trading ki basic definition market ke price movements ko observe karne aur analyze karne par focus karti hai. Iska matlab hai ke aap trading decisions ko market ki price behavior ke base par banate hain, bina kisi additional indicators ke. Yeh approach traders ko market ke actual price movements aur trends ko dekhne ki suvidha deti hai, jo ki decision-making process ko simple aur effective banata hai.

          Price action trading ka core principle yeh hai ki market ki price movements hi sab kuch bata sakti hain. Agar aap market ke price movements ko accurately analyze kar sakte hain, toh aap market ke trends aur potential reversals ko predict kar sakte hain. Is approach mein, traders price charts aur candlestick patterns ko analyze karte hain taake market ke behavior ko samajh sakein aur apni trading strategies ko optimize kar sakein.

          Ek key aspect of price action trading yeh hai ki yeh real-time data ko use karta hai. Iska matlab hai ki aap market ke current conditions ko dekh kar apne trading decisions bana sakte hain, jo ki aapko timely aur accurate trades execute karne mein help karta hai. Yeh approach historical data ke basis par bhi kaam karti hai, lekin iska focus real-time price movements par hota hai.

          Price action trading ke concepts aur techniques ko samajhna aasan hai, lekin inhe effectively apply karna practice aur experience ki zarurat hoti hai. Aapko market ke price movements aur trends ko observe karne ki skill develop karni hoti hai, taake aap accurate trading decisions le sakte hain. Yeh approach trading ke different aspects ko cover karti hai, including entry aur exit points, support aur resistance levels, aur market trends.

          Overall, price action trading ek straightforward aur effective approach hai jo aapko market ke price behavior ko samajhne aur analyze karne mein help karti hai. Is approach ka use karke, aap market ke real-time movements ko dekh sakte hain aur apni trading strategies ko improve kar sakte hain.

          3. Historical Background

          Price action trading ka historical background ek interesting aur informative topic hai. Yeh approach trading ki duniya mein aik purani technique hai, jo traders ko market ke price movements ko observe karne aur analyze karne mein madad karti hai. Price action trading ka concept trading ke evolution ke sath develop hua hai, aur iski roots purane zamanay ke trading practices mein hain.

          Pehle ke traders bhi price movements ko analyze karte the bina kisi advanced tools aur indicators ke. Unka focus market ke price changes aur trends par hota tha, jo unhe trading decisions lene mein madad karta tha. Yeh traditional approach time-tested aur reliable thi, aur isne modern trading practices ko shape kiya hai. Aaj bhi, price action trading ke concepts aur techniques ko trading strategies mein include kiya jata hai, kyunki yeh effective aur simple approach hai.

          Jab technology ne trading mein enter kiya, tab naye tools aur indicators develop huye, lekin price action trading ki importance kam nahi hui. Yeh approach market ke actual price movements ko reflect karti hai aur trading decisions ko simplify karti hai. Modern traders bhi price action trading ko use karte hain, kyunki yeh real-time data aur direct observations ke basis par trading decisions ko facilitate karti hai.

          Historical perspective se, price action trading ne trading ki duniya mein ek important role play kiya hai. Yeh approach trading ke fundamental concepts ko samajhne aur trading decisions ko optimize karne mein madad karti hai. Aaj bhi, traders price action trading ko apni strategies mein include karte hain, aur is approach ka use trading ke different aspects ko analyze karne aur improve karne ke liye kiya jata hai.

          In conclusion, price action trading ka historical background ek rich aur valuable heritage hai. Yeh approach trading ki duniya mein aik important role play karti hai, aur iska use market ke price movements ko samajhne aur trading decisions ko improve karne ke liye kiya jata hai.

          4. Price Action Indicators Ki Types

          Price action indicators kayi types ke hote hain, jo traders ko market ke price movements ko analyze karne aur trading decisions ko enhance karne mein madad karte hain. In indicators mein sabse common types candlestick patterns, chart patterns, aur trend lines hain. Har type ka apna ek unique role aur importance hota hai trading strategies mein.

          Candlestick Patterns: Candlestick patterns price action trading ke essential components hain. Yeh patterns market ke sentiment aur potential reversals ko identify karne mein help karte hain. Kuch common candlestick patterns mein Doji, Engulfing, aur Hammer patterns shamil hain. Doji pattern market ke indecision ko show karta hai, jabki Engulfing pattern trend reversal ka signal deta hai. Hammer pattern bhi trend reversal ke signals ko show karta hai aur market ke sentiment ko samajhne mein madad karta hai.

          Chart Patterns: Chart patterns price action trading ke important aspects hain. In patterns ka analysis market ke trends aur potential reversals ko identify karne mein help karta hai. Kuch popular chart patterns mein Head and Shoulders, Double Top and Bottom, aur Triangles shamil hain. Head and Shoulders pattern market ke trend reversal ko signal karta hai, jabki Double Top aur Bottom patterns market ke trends ko predict karne mein madad karte hain. Triangles patterns market ke consolidation aur breakout points ko identify karne mein help karte hain.

          Trend Lines: Trend lines price action trading mein ek simple yet effective tool hain. Yeh lines market ke trend ko visualize karne aur potential support aur resistance levels ko identify karne mein madad karti hain. Trend lines ko draw karne ke liye, traders price charts par major highs aur lows ko connect karte hain. Yeh lines market ke direction aur potential reversals ko dekhne mein help karti hain aur trading decisions ko improve karti hain.

          Overall, price action indicators trading strategies ko enhance karne aur market trends ko accurately predict karne mein madadgar hote hain. In indicators ka use karke, traders market ke price movements ko dekh sakte hain aur apni trading decisions ko optimize kar sakte hain.

          5. Candlestick Patterns

          Candlestick patterns price action trading mein ek fundamental role play karte hain. In patterns ko analyze karke, traders market ke sentiment aur potential reversals ko identify kar sakte hain. Candlestick patterns ka use karke, traders market ke behavior ko samajhne aur apne trading decisions ko optimize karne mein madad lete hain.

          Doji Pattern: Doji pattern market ke indecision aur uncertainty ko show karta hai. Yeh pattern tab banta hai jab market ke open aur close prices ek dusre ke bahut kareeb hote hain. Doji pattern ka presence market ke trend reversal ya consolidation ka signal de sakta hai. Traders is pattern ko dekh kar market ke direction ko predict kar sakte hain aur apni trading strategies ko adjust kar sakte hain.

          Engulfing Pattern: Engulfing pattern market ke trend reversal ka strong signal hota hai. Yeh pattern tab banta hai jab ek large candlestick pichli small candlestick ko completely engulf kar leti hai. Bullish Engulfing pattern market ke uptrend ka signal deta hai, jabki Bearish Engulfing pattern downtrend ka signal deta hai. Traders is pattern ka analysis karke market ke future movements ko predict kar sakte hain aur apni trades ko accordingly adjust kar sakte hain.

          Hammer Pattern: Hammer pattern market ke trend reversal ka signal hota hai. Yeh pattern tab banta hai jab market ke close price open price ke kareeb hota hai aur ek long lower shadow hoti hai. Hammer pattern bullish reversal ka signal de sakta hai, jabki inverse hammer pattern bearish reversal ka signal de sakta hai. Traders is pattern ka use karke market ke sentiment ko samajhne aur apne trading decisions ko improve karne mein madad lete hain.

          Shooting Star Pattern: Shooting Star pattern bearish reversal ka signal hota hai. Yeh pattern tab banta hai jab market ke open aur close prices ek dusre ke bahut kareeb hote hain aur ek long upper shadow hoti hai. Traders is pattern ka use karke market ke downtrend ko predict kar sakte hain aur apni trades ko accordingly adjust kar sakte hain.

          Overall, candlestick patterns price action trading mein ek important tool hain jo market ke sentiment aur potential reversals ko identify karne mein madad karte hain. Traders ko in patterns ko accurately analyze karna aana chahiye taake wo effective trading decisions le sakein.

          6. Chart Patterns

          Chart patterns price action trading ke essential components hain. Yeh patterns market ke trends aur potential reversals ko identify karne mein help karte hain. Chart patterns ko analyze karna traders ko market ke behavior ko samajhne aur apni trading strategies ko optimize karne mein madad karta hai.

          Head and Shoulders Pattern: Head and Shoulders pattern ek trend reversal pattern hai jo market ke uptrend ke baad banta hai. Yeh pattern teen peaks ke combination se banta hai: ek higher peak (head) aur do lower peaks (shoulders). Head and Shoulders pattern ka appearance market ke downtrend ka signal hota hai. Traders is pattern ko dekh kar market ke trend reversal ko predict kar sakte hain aur apni trades ko accordingly adjust kar sakte hain.

          Double Top and Bottom Patterns: Double Top aur Double Bottom patterns market ke trend reversal ko signal karte hain. Double Top pattern market ke uptrend ke baad banta hai aur bearish reversal ka signal deta hai, jabki Double Bottom pattern market ke downtrend ke baad banta hai aur bullish reversal ka signal deta hai. Traders in patterns ka use karke market ke potential reversals ko identify kar sakte hain aur apni trading strategies ko improve kar sakte hain.

          Triangles Patterns: Triangles patterns market ke consolidation aur breakout points ko identify karne mein help karte hain. Triangles patterns ke three main types hain: ascending triangles, descending triangles, aur symmetrical triangles. Ascending triangles market ke bullish breakout ka signal dete hain, descending triangles bearish breakout ka signal dete hain, aur symmetrical triangles market ke indecision aur potential breakout points ko show karte hain.

          Flags and Pennants Patterns: Flags aur Pennants patterns market ke continuation aur trend continuation signals ko provide karte hain. Flags pattern short-term consolidation aur trend continuation ka signal deta hai, jabki Pennants pattern market ke short-term consolidation aur potential breakout points ko identify karta hai. Traders in patterns ko analyze karke market ke trends aur continuation points ko dekh sakte hain aur apne trading decisions ko optimize kar sakte hain.

          Overall, chart patterns price action trading ke key components hain jo market ke trends aur potential reversals ko identify karne mein madad karte hain. Traders ko in patterns ko accurately analyze karna aana chahiye taake wo market ke behavior ko samajh sakein aur effective trading decisions le sakein.

          7. Trend Lines

          Trend lines price action trading mein ek simple aur effective tool hain jo market ke trends ko visualize karne aur potential support aur resistance levels ko identify karne mein madad karti hain. Trend lines ko draw karna aur analyze karna traders ko market ke direction aur potential reversals ko samajhne mein help karta hai.

          Drawing Trend Lines: Trend lines draw karne ke liye, traders price charts par major highs aur lows ko connect karte hain. Uptrend line draw karne ke liye, traders successive higher lows ko connect karte hain, aur downtrend line draw karne ke liye successive lower highs ko connect karte hain. Yeh lines market ke direction aur potential support aur resistance levels ko show karti hain.

          Support Aur Resistance Levels: Trend lines ke zariye traders support aur resistance levels ko identify kar sakte hain. Support level wo point hai jahan price downtrend ke dauran girti nahi hai, aur resistance level wo point hai jahan price uptrend ke dauran aage nahi badh ti. Trend lines support aur resistance levels ko accurately identify karne mein madad karti hain aur market ke trends ko dekhne mein help karti hain.

          Trend Reversals: Trend lines ka use karke, traders market ke potential reversals ko identify kar sakte hain. Jab price trend line ko break karti hai, toh yeh signal hota hai ke market ka trend reverse ho sakta hai. Trend lines ko breakouts aur fakeouts ko analyze karne ke liye bhi use kiya jata hai, jo ki market ke potential reversals aur continuation points ko show karte hain.

          Dynamic Nature: Trend lines market ke dynamic nature ko reflect karti hain. Market ki volatility aur price movements trend lines ko continuously affect karte hain. Traders ko trend lines ko regularly update karna padta hai aur market ke changing conditions ko dekh kar apni trading strategies ko adjust karna padta hai.

          In conclusion, trend lines price action trading ke essential tools hain jo market ke trends aur potential reversals ko accurately identify karne mein madad karte hain. Traders ko trend lines ko effectively use karna aana chahiye taake wo market ke direction aur potential support aur resistance levels ko samajh sakein.

          8. Support Aur Resistance Levels

          Support aur resistance levels price action trading mein ek crucial role play karte hain. In levels ki identification market ke trends aur potential reversals ko accurately predict karne mein madad karti hai. Support aur resistance levels ko samajhne aur analyze karne se traders ko market ke behavior ko better understand karne mein madad milti hai.

          Support Level: Support level wo point hai jahan market ke price downtrend ke dauran girti nahi hai. Yeh level market ke downtrend ke dauran ek barrier ka kaam karta hai, jo price ko niche girne se rokta hai. Support level ko identify karne ke liye traders price charts par major lows ko dekhte hain aur un points ko connect karte hain. Jab price support level ko test karti hai, toh yeh signal hota hai ke market ke buyers strong hain aur price niche nahi girti.

          Resistance Level: Resistance level wo point hai jahan market ke price uptrend ke dauran aage nahi badh ti. Yeh level market ke uptrend ke dauran ek barrier ka kaam karta hai, jo price ko upar jane se rokta hai. Resistance level ko identify karne ke liye traders price charts par major highs ko dekhte hain aur un points ko connect karte hain. Jab price resistance level ko test karti hai, toh yeh signal hota hai ke market ke sellers strong hain aur price aage nahi badh ti.

          Support Aur Resistance Ki Importance: Support aur resistance levels ki identification trading decisions ko optimize karne mein madad karti hai. Yeh levels market ke potential reversals aur continuation points ko identify karne mein help karte hain. Traders in levels ko use karke entry aur exit points ko accurately determine kar sakte hain aur apni trading strategies ko adjust kar sakte hain.

          Dynamic Nature of Support Aur Resistance: Support aur resistance levels market ke dynamic nature ko reflect karti hain. Market ki volatility aur price movements support aur resistance levels ko continuously affect karti hain. Jab market ki conditions change hoti hain, tab support aur resistance levels bhi adjust hote hain. Traders ko in levels ko regularly update karna padta hai aur market ke changing conditions ko dekh kar apni strategies ko modify karna padta hai.

          In conclusion, support aur resistance levels price action trading ke essential aspects hain jo market ke trends aur potential reversals ko accurately identify karne mein madad karte hain. Traders ko in levels ko effectively use karna aana chahiye taake wo market ke behavior ko samajh sakein aur apni trading strategies ko optimize kar sakein.

          9. Breakouts Aur Fakeouts

          Breakouts aur fakeouts price action trading mein important concepts hain jo market ke potential movements aur reversals ko identify karne mein madad karte hain. Breakouts market ke trend continuation aur potential new trends ko signal karte hain, jabki fakeouts market ke temporary movements aur false signals ko show karte hain.

          Breakouts: Breakouts tab hoti hain jab price support ya resistance levels ko cross karti hai. Jab price breakout hota hai, toh yeh signal hota hai ke market ka trend continuation ya new trend develop ho sakta hai. Breakouts ko identify karne ke liye, traders price charts par support aur resistance levels ko dekhte hain aur un points ko analyze karte hain. Strong breakouts ke saath high volume aur momentum bhi dekha jata hai, jo ke trend continuation ko support karta hai.

          Fakeouts: Fakeouts tab hoti hain jab price temporary breakout dikhati hai lekin phir wapas support ya resistance levels ke paas aa jati hai. Fakeouts market ke temporary price movements ko show karte hain jo baad mein reverse ho sakte hain. Traders fakeouts ko identify karne ke liye, price movements aur volume ko analyze karte hain. Fakeouts ko avoid karne ke liye, traders ko confirmation signals aur additional indicators ka use karna chahiye.

          Identifying Breakouts Aur Fakeouts: Breakouts aur fakeouts ko accurately identify karne ke liye, traders ko price charts aur volume ko analyze karna aana chahiye. Strong breakouts ke saath high volume aur momentum ko dekhna chahiye, jabki fakeouts ko avoid karne ke liye, additional confirmation signals aur indicators ka use karna chahiye. Traders ko market ke behavior aur conditions ko samajh kar apni trading strategies ko adjust karna chahiye.

          Role of Volume: Volume breakout aur fakeouts ke identification mein ek crucial role play karta hai. High volume strong breakouts aur trend continuation ko support karta hai, jabki low volume fakeouts aur false signals ko indicate karta hai. Traders ko volume ko analyze karna aana chahiye taake wo breakout aur fakeouts ko accurately identify kar sakein aur apni trading decisions ko optimize kar sakein.

          In conclusion, breakouts aur fakeouts price action trading ke essential concepts hain jo market ke potential movements aur reversals ko accurately identify karne mein madad karte hain. Traders ko in concepts ko effectively analyze karna aana chahiye taake wo market ke behavior ko samajh sakein aur effective trading decisions le sakein.

          10. Volume Analysis

          Volume analysis price action trading mein ek important tool hai jo market ke trends aur potential reversals ko accurately identify karne mein madad karta hai. Volume analysis ko market ke momentum aur strength ko assess karne ke liye use kiya jata hai.

          Volume Ka Role: Volume market ke activity aur liquidity ko measure karta hai. High volume strong trends aur market ke strong movements ko indicate karta hai, jabki low volume weak trends aur market ke low activity ko indicate karta hai. Volume analysis market ke trends aur potential reversals ko accurately identify karne mein help karta hai aur traders ko market ke behavior ko samajhne mein madad karta hai.

          Volume aur Price Relationship: Volume aur price ke relationship ko analyze karna important hai. Agar price uptrend mein hai aur volume bhi high hai, toh yeh signal hota hai ke trend strong hai. Agar price uptrend mein hai lekin volume low hai, toh yeh signal hota hai ke trend weak ho sakta hai aur potential reversal ho sakta hai. Similarly, agar price downtrend mein hai aur volume high hai, toh yeh signal hota hai ke trend strong hai, aur agar price downtrend mein hai lekin volume low hai, toh yeh signal hota hai ke trend weak ho sakta hai.

          Volume Indicators: Volume analysis mein different indicators ka use kiya jata hai, jaise ki Volume Oscillator, On-Balance Volume (OBV), aur Accumulation/Distribution (A/D) line. Yeh indicators volume aur price ke relationship ko analyze karte hain aur market ke trends aur potential reversals ko identify karne mein madad karte hain. Traders ko in indicators ka use karke market ke momentum aur strength ko assess karna aana chahiye.

          Volume Analysis Ke Techniques: Volume analysis ke techniques mein volume spikes, volume trends, aur volume confirmation signals ko include kiya jata hai. Volume spikes tab hote hain jab volume unexpectedly high hota hai, jo ke market ke strong movements ko indicate karta hai. Volume trends market ke overall volume movements ko dekhte hain aur volume confirmation signals trend continuation aur reversal signals ko show karte hain. Traders ko in techniques ko accurately analyze karna aana chahiye taake wo market ke behavior ko samajh sakein aur apni trading strategies ko optimize kar sakein.

          In conclusion, volume analysis price action trading mein ek crucial tool hai jo market ke trends aur potential reversals ko accurately identify karne mein madad karta hai. Traders ko volume analysis ko effectively use karna aana chahiye taake wo market ke momentum aur strength ko assess kar sakein aur effective trading decisions le sakein.

          11. Risk Management

          Risk management price action trading mein ek vital aspect hai jo trading decisions ko optimize karne aur potential losses ko minimize karne mein madad karta hai. Risk management strategies ko use karke traders apne trading risks ko effectively manage kar sakte hain aur apne trading performance ko improve kar sakte hain.

          Risk Management Ke Principles: Risk management ke principles mein position sizing, stop-loss orders, aur risk-reward ratio ko include kiya jata hai. Position sizing traders ko determine karne mein madad karta hai ke kitna capital kisi trade mein invest karna chahiye. Stop-loss orders traders ko losses ko limit karne mein madad karte hain aur risk-reward ratio traders ko potential profits aur losses ko balance karne mein madad karta hai.

          Position Sizing: Position sizing risk management ka ek important component hai. Traders ko position sizing ke principles ko samajhna chahiye aur apne trading capital ko effectively allocate karna chahiye. Position sizing ke techniques mein percentage risk, fixed dollar risk, aur volatility-based risk ko include kiya jata hai. Traders ko apne capital ko diversify karna chahiye aur ek hi trade par zyada risk nahi lena chahiye.

          Stop-Loss Orders: Stop-loss orders risk management ke liye ek essential tool hain. Yeh orders traders ko predefined price levels par apni positions ko close karne mein madad karte hain, jab price unfavorable direction mein move karti hai. Stop-loss orders ko set karne ke liye traders ko market ke volatility aur potential price movements ko dekhna chahiye. Traders ko stop-loss orders ko adjust karna aana chahiye aur market ke changing conditions ke according apni strategies ko modify karna chahiye.

          Risk-Reward Ratio: Risk-reward ratio risk management ka ek important aspect hai jo traders ko potential profits aur losses ko balance karne mein madad karta hai. Risk-reward ratio ko calculate karne ke liye, traders potential profit aur potential loss ke beech ka ratio dekhte hain. Achhi trading strategies wo hain jo high risk-reward ratio offer karti hain aur potential losses ko minimize karti hain.

          Diversification: Diversification risk management ka ek effective strategy hai jo traders ko apne capital ko different assets aur trades mein allocate karne mein madad karti hai. Diversification se traders apne overall risk ko reduce kar sakte hain aur market ke potential fluctuations aur volatility ko handle kar sakte hain. Traders ko apne portfolio ko diversify karna chahiye aur ek hi asset ya trade par zyada risk nahi lena chahiye.

          In conclusion, risk management price action trading mein ek crucial aspect hai jo trading decisions ko optimize karne aur potential losses ko minimize karne mein madad karta hai. Traders ko risk management ke principles ko effectively use karna aana chahiye taake wo apne trading performance ko improve kar sakein aur market ke potential risks ko handle kar sakein.

          12. Trading Psychology

          Trading psychology trading success ke liye ek important factor hai. Traders ka mindset aur emotional state trading decisions ko influence karte hain aur trading performance ko impact karte hain. Trading psychology ko samajhna aur manage karna traders ko market ke challenges ko effectively handle karne mein madad karta hai.

          Emotional Discipline: Emotional discipline trading psychology ka ek important component hai. Traders ko apne emotions ko control karna chahiye aur impulsive trading decisions se bachna chahiye. Emotional discipline se traders market ke fluctuations aur volatility ko better handle kar sakte hain aur apni trading strategies ko effectively implement kar sakte hain.

          Patience Aur Persistence: Patience aur persistence trading psychology ke key aspects hain. Traders ko market ke movements aur trends ko patiently wait karna chahiye aur trading strategies ko consistently follow karna chahiye. Patience aur persistence se traders market ke long-term trends aur opportunities ko identify kar sakte hain aur apni trading performance ko improve kar sakte hain.

          Confidence Aur Self-Belief: Confidence aur self-belief trading psychology ke important aspects hain. Traders ko apne trading strategies aur decisions par confidence rakhna chahiye aur apne skills aur knowledge ko trust karna chahiye. Confidence aur self-belief se traders market ke challenges aur uncertainties ko effectively handle kar sakte hain aur apni trading goals ko achieve kar sakte hain.

          Avoiding Overtrading: Overtrading trading psychology ka ek common problem hai jo traders ki performance ko negatively impact kar sakta hai. Overtrading tab hota hai jab traders excessive trades karte hain aur apni trading strategies ko follow nahi karte. Traders ko overtrading se bachna chahiye aur apni trading decisions ko carefully evaluate karna chahiye. Overtrading ko avoid karne ke liye, traders ko apne trading plan aur strategies ko strictly follow karna chahiye.

          Developing a Trading Plan: Trading psychology ko manage karne ke liye, traders ko ek solid trading plan develop karna chahiye. Trading plan ko market ke trends, potential reversals, aur trading strategies ko include karna chahiye. Trading plan se traders ko market ke fluctuations ko handle karne mein madad milti hai aur apni trading performance ko consistently improve kar sakte hain.

          In conclusion, trading psychology trading success ke liye ek crucial factor hai. Traders ko apne emotions ko control karna chahiye aur trading decisions ko discipline aur patience ke saath handle karna chahiye. Effective trading psychology se traders market ke challenges ko better handle kar sakte hain aur apni trading performance ko improve kar sakte hain.

          • #6 Collapse

            Price Action Indicator: A Comprehensive Guide

            1. Price Action Indicator Ka Taaruf

            Price action indicator ek trading tool hai jo bazaar ki price movements ko analyse karne ke liye use kiya jata hai. Iska maqsad market ke price changes ko samajhna aur future price movements ka andaza lagana hota hai. Jab traders market ke price patterns aur trends ko samajhte hain, to wo trading decisions ko behtar tarike se le sakte hain. Ye indicators market ki strength aur weakness ko measure karne mein bhi madadgar hote hain.

            Price action indicators ko use karne ke liye traders ko market ki history aur price movements ka achi tarah se gyan hona chahiye. In indicators ka use karte hue traders support aur resistance levels ko identify kar sakte hain, jo trading decisions mein crucial role play karte hain. Ye indicators simple aur complex, dono types ke ho sakte hain aur unka selection trading strategy aur market conditions par depend karta hai.

            Iske alawa, price action indicators ko use karne se traders ko market ke overall trend ko identify karne mein bhi madad milti hai. Ye indicators market ke high aur low points ko track karte hain, jisse traders ko market ke future direction ka idea milta hai. Price action indicators ko use karte waqt traders ko market ke psychological aspects aur human behavior ko bhi samajhna zaroori hota hai, kyunki ye factors bhi price movements ko influence karte hain.

            Price action indicators ko analyze karna trading ke ek important aspect ko represent karta hai, jisme traders ko market ke price movements ko accurately predict karna hota hai. Is process ko samajhne ke liye traders ko price charts aur historical data ka bhi study karna padta hai. Isse unhe market ke patterns aur trends ko identify karne mein madad milti hai jo future trading decisions mein help karte hain.

            2. Price Action Indicators Ka Maqsad

            Price action indicators ka maqsad market ke actual price movements ko track karna hai. Inka use market ke trends aur reversals ko identify karne ke liye hota hai. Ye indicators traders ko market ki direction aur strength ko samajhne mein madad karte hain, jo trading decisions ko impact karte hain. Price action indicators ka maqsad sirf price data ko analyze karna nahi hai, balki market ke underlying trends ko bhi understand karna hai.

            Market ki trends ko identify karna price action indicators ka ek primary objective hai. Jab traders market ke trend ko accurately identify kar lete hain, to wo apne trading strategies ko us trend ke according adjust kar sakte hain. Is process se traders ko market ke bullish ya bearish phases ko identify karne mein madad milti hai, jisse unka profit potential increase hota hai.

            Price action indicators ka maqsad market ke price movements ko visualize karna bhi hota hai. Traders price charts par indicators ko apply karke market ke price movements ko easily observe kar sakte hain. Ye visualization traders ko market ke key points aur potential reversal areas ko identify karne mein help karta hai. Visualization se traders ko market ke behavior ko samajhne mein bhi madad milti hai, jo trading decisions ko improve karta hai.

            In indicators ka use trading strategies ko refine karne ke liye bhi hota hai. Jab traders market ke price action ko accurately analyze kar lete hain, to wo apni trading strategies ko optimize kar sakte hain. Isse unki trading performance improve hoti hai aur market ke fluctuations se better cope kiya ja sakta hai. Price action indicators ko sahi tarike se use karne se traders market se maximum benefit utha sakte hain.

            3. Key Price Action Indicators

            Price action indicators ko samajhne ke liye kuch key indicators hain jo market ke price movements ko analyze karne mein madadgar hote hain. Inme se kuch important indicators hain: support aur resistance levels, trend lines, aur price patterns. Har indicator ka apna ek unique role hota hai aur trading decisions ko enhance karne mein help karta hai.

            Support aur Resistance Levels market ke woh points hain jahan price aksar ruk jati hai ya reverse hoti hai. Support level wo price point hota hai jahan price girne ke baad ruk jati hai aur resistance level wo point hota hai jahan price badhne ke baad reverse hoti hai. Ye levels traders ko market ke key points identify karne mein madad karte hain, jo trading decisions mein important role play karte hain.

            Trend Lines market ke highs aur lows ko connect karte hain aur market ka trend highlight karte hain. Trend lines ko draw karke traders market ke overall direction ko visualize kar sakte hain. Ye lines market ke bullish ya bearish trends ko identify karne mein help karti hain, jisse traders ko accurate trading decisions lene mein madad milti hai.

            Price Patterns jese ke Head and Shoulders, Double Top, aur Double Bottom market ke future direction ko indicate karte hain. Ye patterns market ke potential reversals aur continuations ko predict karte hain. Jab traders in patterns ko identify kar lete hain, to wo apne trading strategies ko accordingly adjust kar sakte hain. Price patterns ki analysis se market ke potential movements ka idea milta hai, jo trading decisions ko better banata hai.

            4. Candlestick Patterns

            Candlestick patterns price action indicators ka ek aham hissa hain. Har candlestick ek specific price movement ko represent karta hai aur inke combinations trading decisions mein madadgar hotay hain. Candlestick patterns ko samajhna aur analyze karna market ke price action ko better understand karne mein help karta hai.

            Doji ek candlestick pattern hai jahan open aur close price same hoti hai. Ye pattern market ki uncertainty ko show karta hai aur potential reversals ko indicate kar sakta hai. Jab doji pattern market ke top ya bottom par banata hai, to ye traders ko market ke potential reversals ke bare mein alert karta hai.

            Hammer pattern market ke reversal signal ko indicate karta hai. Is pattern mein ek small body ke saath long lower shadow hoti hai, jo market ke selling pressure ko show karta hai. Jab hammer pattern market ke downtrend ke baad banata hai, to ye bullish reversal ka signal hota hai.

            Engulfing Pattern ek candlestick pattern hai jahan ek candlestick doosri candlestick ko completely cover karti hai. Ye pattern market ke potential bullish ya bearish reversals ko indicate karta hai. Jab engulfing pattern market ke trend ke opposite direction mein banata hai, to ye traders ko market ke potential reversals ke bare mein signal deta hai.

            5. Trend Reversal Indicators

            Trend reversal indicators market ke trend ke change ko identify karne mein madadgar hote hain. In indicators ka use karke traders market ke reversal points ko accurately identify kar sakte hain, jo trading decisions ko impact karte hain. Trend reversal indicators mein sabse aam indicators hain Moving Averages, MACD, aur RSI.

            Moving Averages trend ki direction ko smooth karte hain aur market ke overall trend ko highlight karte hain. Simple Moving Average (SMA) aur Exponential Moving Average (EMA) do popular types hain. SMA market ke average price ko ek specific period ke liye calculate karta hai, jabke EMA recent prices ko zyada weightage deta hai aur trend ko zyada accurately reflect karta hai.

            MACD (Moving Average Convergence Divergence) ek momentum indicator hai jo two moving averages ke differences ko measure karta hai. Ye indicator bullish aur bearish trends ko identify karne mein madad karta hai aur market ke momentum ke changes ko track karta hai. MACD ke signals traders ko market ke potential reversals aur trend changes ke bare mein alert karte hain.

            RSI (Relative Strength Index) ek momentum oscillator hai jo market ke overbought ya oversold conditions ko measure karta hai. Ye indicator 0 se 100 ke range mein hota hai aur market ke potential reversals aur trend strength ko identify karne mein madad karta hai. Jab RSI extreme levels ko reach karta hai, to ye market ke potential reversals ka signal hota hai.

            6. Price Action aur Volume

            Volume trading ka ek important aspect hai jo price action indicators ke sath analyze kiya jata hai. Volume market ke trading activity ko measure karta hai aur price movements ke strength ko indicate karta hai. Price action indicators ko volume ke sath analyze karne se traders ko market ke strength aur weakness ko better understand karne mein madad milti hai.

            Jab market mein high volume hota hai, to price movements ke strength bhi high hoti hai. High volume ke sath price movements ko observe karna market ke trend ki confirmation ke liye zaroori hota hai. Agar volume increase ho raha hai aur price movement bhi strong hai, to ye bullish ya bearish trend ko confirm karta hai.

            Volume analysis se traders ko market ke potential reversals aur trend changes ke signals milte hain. Agar volume decrease ho raha hai aur price movement strong nahi hai, to ye market ke weak trend ko indicate karta hai. Volume analysis se traders ko market ke trends aur reversals ko accurately identify karne mein madad milti hai, jo trading decisions ko impact karta hai.

            Volume ke sath price action ko analyze karna trading strategies ko enhance karta hai. Traders volume aur price movements ko combine karke market ke key points aur potential reversals ko identify kar sakte hain. Ye combination market ke overall behavior ko samajhne mein madad karta hai aur trading decisions ko behtar banata hai.

            7. Psychological Levels

            Psychological levels wo price points hain jo traders ke liye important hoti hain, jaise round numbers. Ye levels market ke behavior ko influence karte hain aur trading decisions mein impact dalte hain. Psychological levels ko identify karna market ke price movements ko samajhne mein madad karta hai.

            Round numbers jaise 100, 500, 1000 market ke psychological levels ko represent karte hain. Traders in levels ko important points ke roop mein dekhte hain aur market ke behavior ko analyze karte hain. Jab price round number ke paas hoti hai, to traders ka behavior aur market ka reaction change ho sakta hai.

            Psychological levels traders ke trading decisions ko bhi impact karte hain. Jab price psychological level ke pass hoti hai, to traders market ke potential reversals aur breakouts ko analyze karte hain. In levels ke sath trading karna traders ko market ke key points ko identify karne mein madad karta hai aur trading strategies ko refine karta hai.

            Market ke psychological levels ko analyze karne se traders ko market ke behavior aur price movements ko samajhne mein madad milti hai. Ye levels market ke sentiment aur trader behavior ko reflect karte hain, jo trading decisions ko influence karte hain. Psychological levels ko trading strategies mein include karna market ke fluctuations se cope karne mein help karta hai.

            8. Risk Management aur Price Action

            Price action indicators ko effective risk management ke sath use karna zaroori hai. Risk management strategies, jaise stop-loss aur position sizing, trading losses ko minimize karne mein madadgar hoti hain. Risk management ka goal traders ko market ke unpredictable movements se protect karna hai.

            Stop-Loss Orders ek risk management tool hai jo traders ko losses ko limit karne mein madad karta hai. Jab price ek specific level tak reach karti hai, to stop-loss order automatically trigger ho jata hai aur position ko close kar deta hai. Isse traders ko market ke sudden movements se protection milta hai.

            Position Sizing bhi ek important risk management strategy hai. Traders ko apni position size ko market ke volatility aur risk ke according adjust karna chahiye. Position sizing se traders apne overall risk ko manage kar sakte hain aur large losses se bach sakte hain.

            Effective risk management se traders ko market ke uncertainties aur fluctuations ko better handle karne mein madad milti hai. Risk management strategies ko price action indicators ke sath use karne se trading performance improve hoti hai aur market ke risks ko minimize kiya ja sakta hai.

            9. Price Action Indicators Ki Practice

            Price action indicators ki practice aur unki understanding market analysis ko enhance karti hai. Regular practice aur backtesting se traders market trends ko accurately identify kar sakte hain aur profitable trades execute kar sakte hain. Practice se traders ko indicators ki accuracy aur reliability ko samajhne mein madad milti hai.

            Backtesting ek process hai jahan traders apni trading strategies ko historical data par test karte hain. Isse traders ko strategies ke effectiveness aur potential weaknesses ka pata chalta hai. Backtesting se traders apne strategies ko refine kar sakte hain aur market ke different conditions ko test kar sakte hain.

            Paper Trading bhi practice ka ek important part hai. Paper trading se traders real money invest kiye bina market ke trends aur indicators ko test kar sakte hain. Ye process traders ko market ke behavior aur indicators ke effectiveness ko understand karne mein help karta hai.

            Price action indicators ki practice se traders ko market ke nuances aur price movements ko samajhne mein madad milti hai. Regular practice aur analysis se traders apne trading skills ko improve kar sakte hain aur market se maximum benefit utha sakte hain. Practice se trading strategies ko refine karna aur market ke trends ko accurately predict karna possible hota hai.

            10. Price Action Indicators Ki Analysis

            Price action indicators ki analysis market ke trends aur price movements ko accurately samajhne mein madad karti hai. Is analysis ke zariye traders market ke key levels aur potential reversals ko identify kar sakte hain. Indicators ko analyze karne ke liye traders ko inke patterns aur signals ko observe karna hota hai jo market ke future direction ko predict karte hain.

            Support aur Resistance Levels ko analyze karna market ke critical points ko identify karne mein madad karta hai. Jab price support level ko touch karti hai aur reverse hoti hai, to ye ek strong support signal hota hai. Similarly, jab price resistance level ko touch karti hai aur reverse hoti hai, to ye resistance signal hota hai. In levels ko track karke traders market ke key points ko samajh sakte hain.

            Trend Lines ki analysis se traders ko market ke overall trend aur direction ka idea milta hai. Trend lines ko accurately draw karna zaroori hota hai, jisse market ke highs aur lows ko connect karke trend ko visualize kiya ja sake. Trend lines ke breakouts aur bounces market ke potential trend changes ko signal karte hain.

            Price Patterns jese ke Head and Shoulders aur Double Top ko analyze karna market ke future movements ko predict karne mein madad karta hai. Head and Shoulders pattern bullish trend ke end aur bearish trend ke beginning ko indicate karta hai. Double Top aur Double Bottom patterns market ke reversals ko signal karte hain aur trading decisions ko guide karte hain.

            11. Technical Indicators aur Price Action

            Price action indicators ko technical indicators ke sath combine karke market ki analysis ko enhance kiya ja sakta hai. Technical indicators price movements ko support karte hain aur market ke trends ko confirm karte hain. In indicators ka combination traders ko accurate trading signals aur better decision-making tools provide karta hai.

            Moving Averages aur MACD jaise technical indicators price action indicators ki analysis ko complement karte hain. Moving Averages market ke trend ko smooth karte hain aur trend ki strength ko indicate karte hain. MACD momentum aur trend changes ko measure karta hai, jo price action indicators ko confirm karta hai.

            Relative Strength Index (RSI) aur Bollinger Bands bhi price action indicators ke sath use kiye ja sakte hain. RSI market ke overbought aur oversold conditions ko measure karta hai, jabke Bollinger Bands market ke volatility aur price levels ko visualize karte hain. Ye indicators market ke potential reversals aur trends ko accurately identify karne mein madad karte hain.

            Technical indicators aur price action indicators ka combination trading strategies ko refine karta hai aur market ke trends ko better understand karne mein madad karta hai. In indicators ko integrate karke traders market ke signals ko better analyze kar sakte hain aur trading decisions ko improve kar sakte hain.

            12. Trading Strategies Based on Price Action

            Price action indicators ke basis par kai trading strategies develop ki ja sakti hain jo market ke different conditions ko handle kar sakti hain. In strategies ko develop karte waqt traders ko market ke trends, support/resistance levels, aur price patterns ko dhyan mein rakhna padta hai.

            Trend Following Strategy market ke prevailing trend ko follow karti hai aur trend ke direction mein trades ko execute karti hai. Is strategy mein traders trend lines aur moving averages ko use karke market ke strong trends ko identify karte hain aur unke sath trades execute karte hain.

            Reversal Trading Strategy market ke reversal points ko identify karne par focus karti hai. Is strategy mein traders candlestick patterns aur price patterns ko analyze karte hain jisse market ke potential reversals ko detect kiya ja sake. Reversal trading strategy market ke key reversal points ko target karti hai.

            Breakout Trading Strategy market ke key levels, jaise support aur resistance levels, ko break hone par trades ko execute karti hai. Jab price in levels ko break karti hai, to ye strong trading signals ko indicate karta hai. Breakout trading strategy market ke strong moves ko capitalize karne ke liye use ki jati hai.

            13. Advanced Price Action Techniques

            Advanced price action techniques market ke price movements ko aur bhi detail mein analyze karne ke liye use ki jati hain. In techniques ko use karke traders market ke complex patterns aur signals ko identify kar sakte hain jo trading decisions ko refine karte hain.

            Market Profile ek advanced technique hai jo market ke price distribution aur volume ko analyze karti hai. Is technique se traders ko market ke key price levels aur trading activity ka detailed view milta hai. Market Profile se market ke structure aur price distribution ko better understand kiya ja sakta hai.

            Wyckoff Method ek aur advanced technique hai jo market ke supply aur demand dynamics ko analyze karti hai. Is method se traders market ke accumulation aur distribution phases ko identify karte hain aur unke basis par trading decisions lete hain. Wyckoff Method market ke detailed behavior ko analyze karne mein madad karti hai.

            Volume Profile bhi ek advanced technique hai jo market ke volume aur price levels ke relationship ko analyze karti hai. Volume Profile se traders ko market ke key volume levels aur price points ko identify karne mein madad milti hai. Ye technique market ke behavior aur price movements ko better understand karne mein help karti hai.

            Conclusion

            Price action indicators trading ka ek essential part hain jo market ke trends aur price movements ko accurately analyze karne mein madad karte hain. In indicators ka sahi use traders ko market ke behavior ko better understand karne aur effective trading decisions lene mein madad karta hai. Price action indicators ko technical indicators aur advanced techniques ke sath combine karke trading strategies ko refine karna aur market se maximum benefit uthane ki strategies develop ki ja sakti hain. Regular practice aur analysis se traders apne trading skills ko enhance kar sakte hain aur market ke fluctuations se effectively cope kar sakte hain.
            • #7 Collapse

              What is Price Action Indicator

              forex market mein price action indicator aik forex market ka technical tool hota hey jo keh fore market kay chart pattern mein repetitive ko he identify kar sakta hey yeh forex market ke pechle price action ke base par he movement hote rehte hey
              forex market kay price action trader es bat ke importance par zoor dayta hey yeh indicator forex market kay price action par he zyada depend karta hey technical honay walay paish raft price action par he mobne hotay hein yeh forex market mein price action par mobne he indicator ko janum deya ja sakta hey yeh forex trader ko precious baserat frahm kar saktay hein or en ko ani strategy mein zam karnay say he faida hota hey

              Understanding Price Action Trading

              forex market mein market mein market ke movement ko dakhnay kay ley price action he aik jaisa he hota hey forex market bar bar keya karte hey es bat ko bhe farz karen keh ap forex chart par chand pips par he hotay hein chand bar aik khas shape or triangle ban jata hey price bad mein aik khas direction ko follow karte nazar atte hey
              yeh triangle forex market mein aik khas direction ke taraf eshara kar rahay hotay hein price action forex market kay aglay step par nazar rakhtay hovay forex market ke movement ke taraf eshara kar rahay hotay hein aglay step par nazar rakhtay hovay market ke movement par he nazar rakh saktay hein yeh aik game mein pattern ko talash karnay or faiday kay ley estamal kar saktay heinClick image for larger version  Name:	images (12).jpeg Views:	0 Size:	11.6 KB ID:	13098446
              Forex market mein price action aik key level ka he indicator hota hey

              forex market mein price action ko nechay dey gay chart mein ap daikh saktay hein keh yeh aik key level ka indicator he hota hey key level ka indicator forex market kay chart par overbought ya oversold ke level ko he identify kar sakta hey es kay baray mein yeh he sochna chihay keh woh jagah jahan par forex market overbought ya oversold ho jate hey hum yeh daikh saktay hein keh yahan par price action ketni bar tabdel ho jata hey or price zyada bar stop ho jate hey or kese khas jagah par ghoom jate hey to yeh forex market ke aik he level hote hey
              jab ap forex market mein apna chart par key level indicator ko shamel kartay hein to yeh forexmarket kay mumkana reversal zone ko he indicate kar sakta hey
              age forex market kay es lkey lvel mein aik bullish candlestick bante hey to es kay opposite key level mein bearish candlestick bhe ban sakte hey or price mein mumkana kame ko he tajweez kar sakte hey
              • #8 Collapse


                decisions lete hain, bina kisi traditional technical indicators jese ke Moving Averages, RSI, ya MACD ka use kiye. Is method mein price charts par patterns, trends, aur key levels jese ke support aur resistance ko identify karna shamil hota hai. Price Action trading ko ek "pure" form of trading maana jata hai kyunki isme sirf price data par focus hota hai, aur ye trader ko market ke real-time sentiment ka better understanding provide karta hai.different conditions ko handle kar sakti hain. In strategies ko develop karte waqt traders ko market ke trends, support/resistance levels, aur price patterns ko dhyan mein rakhna padta hai.

                Trend Following Strategy market ke prevailing trend ko follow karti hai aur trend ke direction mein trades ko execute karti hai. Is strategy mein traders trend lines aur moving averages ko use karke market ke strong trends ko identify karte hain aur unke sath trades execute karte hain.

                Reversal Trading Strategy market ke reversal points ko identify karne par focus karti hai. Is strategy mein traders candlestick patterns aur price patterns ko analyze karte hain jisse market ke potential reversals ko detect kiya ja sake. Reversal trading strategy market ke key reversal points ko target karti hai.

                Breakout Trading Strategy market ke key levels, jaise support aur resistance levels, ko break hone par trades ko execute karti hai. Jab price in levels ko break karti hai, to ye strong trading signals ko indicate karta hai. Breakout trading strategy market ke strong moves ko capitalize karne ke liye use ki jati hai.

                13. Advanced Price Action Techniques

                Advanced price action techniques market ke price movements ko aur bhi detail mein analyze karne ke liye use ki jati hain. In techniques ko use karke traders market ke complex patterns aur signals ko identify kar sakte hain jo trading decisions ko refine karte hain.

                Market Profile ek advanced technique hai jo market ke price distribution aur volume ko analyze karti hai. Is technique se traders ko market ke key price levels aur trading activity ka detailed view milta hai. Market Profile se market ke structure aur price distribution ko better understand kiya ja sakta hai.

                Wyckoff Method ek aur advanced technique hai jo market ke supply aur demand dynamics ko analyze karti hai. Is method se traders market ke accumulation aur distribution phases ko identify karte hain aur unke basis par trading decisions lete hain. Wyckoff Method market ke detailed behavior ko analyze karne mein madad karti hai.

                Volume Profile bhi ek advanced technique hai jo market ke volume aur price levels ke relationship ko analyze karti hai. Volume Profile se traders ko market ke key volume levels aur price points ko identify karne mein madad milti hai. Ye technique market ke behavior aur price movements ko better understand karne mein help karti hai.

                Conclusion

                Price action indicators trading ka ek essential part hain jo market ke trends aur price movements ko accurately analyze karne mein madad karte hain. In indicators ka sahi use traders ko market ke behavior ko better understand karne aur effective trading decisions lene mein madad karta hai. Price action indicators ko technical indicators aur advanced techniques ke sath combine karke trading strategies ko refine karna aur market se maximum benefit uthane ki strategies develop ki ja sakti hain. Regular practice aur analysis se traders apne trading skills ko enhance kar sakte hain aur market ke fluctuations se effectively cope kar sakte hain.
                market ke trends aur reversals ko identify karne ke liye hota hai. Ye indicators traders ko market ki direction aur strength ko samajhne mein madad karte hain, jo trading decisions ko impact karte hain. Price action indicators ka maqsad sirf price data ko analyze karna nahi hai, balki market ke underlying trends ko bhi understand karna hai.

                Market ki trends ko identify karna price action indicators ka ek primary objective hai. Jab traders market ke trend ko accurately identify kar lete hain, to wo apne trading strategies ko us trend ke according adjust kar sakte hain. Is process se traders ko market ke bullish ya bearish phases ko identify karne mein madad milti hai, jisse unka profit potential increase hota hai.

                Price action indicators ka maqsad market ke price movements ko visualize karna bhi hota hai. Traders price charts par indicators ko apply karke market ke price movements ko easily observe kar sakte hain. Ye visualization traders ko market ke key points aur potential reversal areas ko identify karne mein help karta hai. Visualization se traders ko market ke behavior ko samajhne mein bhi madad milti hai, jo trading decisions ko improve karta hai.

                In indicators ka use trading strategies ko refine karne ke liye bhi hota hai. Jab traders market ke price action ko accurately analyze kar lete hain, to wo apni trading strategies ko optimize kar sakte hain. Isse unki trading performance improve hoti hai aur market ke fluctuations se better cope kiya ja sakta hai. Price action indicators ko sahi tarike se use karne se traders market se maximum benefit utha sakte hain.

                3. Key Price Action Indicators

                Price action indicators ko samajhne ke liye kuch key indicators hain jo market ke price movements ko analyze karne mein madadgar hote hain. Inme se kuch important indicators hain: support aur resistance levels, trend lines, aur price patterns. Har indicator ka apna ek unique role hota hai aur trading decisions ko enhance karne mein help karta hai.

                Support aur Resistance Levels market ke woh points hain jahan price aksar ruk jati hai ya reverse hoti hai. Support level wo price point hota hai jahan price girne ke baad ruk jati hai aur resistance level wo point hota hai jahan price badhne ke baad reverse hoti hai. Ye levels traders ko market ke key points identify karne mein madad karte hain, jo trading decisions mein important role play karte hain.

                Trend Lines market ke highs aur lows ko connect karte hain aur market ka trend highlight karte hain. Trend lines ko draw karke traders market ke overall direction ko visualize kar sakte hain. Ye lines market ke bullish ya bearish trends ko identify karne mein help karti hain, jisse traders ko accurate trading decisions lene mein madad milti hai.

                Price Patterns jese ke Head and Shoulders, Double Top, aur Double Bottom market ke future direction ko indicate karte hain. Ye patterns market ke potential reversals aur continuations ko predict karte hain. Jab traders in patterns ko identify kar lete hain, to wo apne trading strategies ko accordingly adjust kar sakte hain. Price patterns ki analysis se market ke potential movements ka idea milta hai, jo trading decisions ko better banata hai.

                4. Candlestick Patterns

                Candlestick patterns price action indicators ka ek aham hissa hain. Har candlestick ek specific price movement ko represent karta hai aur inke combinations trading decisions mein madadgar hotay hain. Candlestick patterns ko samajhna aur analyze karna market ke price action ko better understand karne mein help karta hai.

                Doji ek candlestick pattern hai jahan open aur close price same hoti hai. Ye pattern market ki uncertainty ko show karta hai aur potential reversals ko indicate kar sakta hai. Jab doji pattern market ke top ya bottom par banata hai, to ye traders ko market ke potential reversals ke bare mein alert karta hai.

                Hammer pattern market ke reversal signal ko indicate karta hai. Is pattern mein ek small body ke saath long lower shadow hoti hai, jo market ke selling pressure ko show karta hai. Jab hammer pattern market ke downtrend ke baad banata hai, to ye bullish reversal ka signal hota hai.

                Engulfing Pattern ek candlestick pattern hai jahan ek candlestick doosri candlestick ko completely cover karti hai. Ye pattern market ke potential bullish ya bearish reversals ko indicate karta hai. Jab engulfing pattern market ke trend ke opposite direction mein banata hai, to ye traders ko market ke potential reversals ke bare mein signal deta hai.

                5. Trend Reversal Indicators

                Trend reversal indicators market ke trend ke change ko identify karne mein madadgar hote hain. In indicators ka use karke traders market ke reversal points ko accurately identify kar sakte hain, jo trading decisions ko impact karte hain. Trend reversal indicators mein sabse aam indicators hain Moving Averages, MACD, aur RSI.

                Moving Averages trend ki direction ko smooth karte hain aur market ke overall trend ko highlight karte hain. Simple Moving Average (SMA) aur Exponential Moving Average (EMA) do popular types hain. SMA market ke average price ko ek specific period ke liye calculate karta hai, jabke EMA recent prices ko zyada weightage deta hai aur trend ko zyada accurately reflect karta hai.

                MACD (Moving Average Convergence Divergence) ek momentum indicator hai jo two moving averages ke differences ko measure karta hai. Ye indicator bullish aur bearish trends ko identify karne mein madad karta hai aur market ke momentum ke changes ko track karta hai. MACD ke signals traders ko market ke potential reversals aur trend changes ke bare mein alert karte hain.

                RSI (Relative Strength Index) ek momentum oscillator hai jo market ke overbought ya oversold conditions ko measure karta hai. Ye indicator 0 se 100 ke range mein hota hai aur market ke potential reversals aur trend strength ko identify karne mein madad karta hai. Jab RSI extreme levels ko reach karta hai, to ye market ke potential reversals ka signal hota hai.

                6. Price Action aur Volume

                Volume trading ka ek important aspect hai jo price action indicators ke sath analyze kiya jata hai. Volume market ke trading activity ko measure karta hai aur price movements ke strength ko indicate karta hai. Price action indicators ko volume ke sath analyze karne se traders ko market ke strength aur weakness ko better understand karne mein madad
                Key Concepts of Price Action Trading
                1. Candlestick Patterns:
                  • Price Action trading mein candlestick patterns ka analysis bahut important hota hai. Har candlestick market ke ek specific time period ka open, high, low, aur close price ko represent karti hai. Is analysis ke through traders market ke short-term aur long-term trends ko samajhte hain.
                  • Common candlestick patterns include:
                    • Engulfing Pattern (Bullish aur Bearish)
                    • Doji Candlestick
                    • Hammer aur Hanging Man
                    • Pin Bar
                    • Inside Bar
                2. Support and Resistance Levels:
                  • Support Levels: Price ke wo levels jahan demand zyada hoti hai aur price neeche se upar ki taraf bounce karti hai. Ye levels buyers ke liye important buying opportunities indicate karte hain.
                  • Resistance Levels: Price ke wo levels jahan supply zyada hoti hai aur price upar se neeche ki taraf reverse hoti hai. Ye levels sellers ke liye important selling opportunities indicate karte hain.
                3. Trendlines:
                  • Trendlines ka use karke traders market ke overall trend direction ko identify karte hain. Trendlines ko chart par draw karke uptrend (higher highs aur higher lows) aur downtrend (lower highs aur lower lows) ko visualize kiya jata hai.
                  • Uptrend: Ek line jo consecutive higher lows ko connect karti hai.
                  • Downtrend: Ek line jo consecutive lower highs ko connect karti hai.
                4. Price Patterns:
                  • Price action traders price patterns ko identify karte hain jo future price movements ka indication de sakte hain. Common price patterns mein include hote hain:
                    • Head and Shoulders (aur Inverse Head and Shoulders)
                    • Double Top aur Double Bottom
                    • Triangles (Symmetrical, Ascending, Descending)
                    • Flags aur Pennants

                      forex market mein market mein market ke movement ko dakhnay kay ley price action he aik jaisa he hota hey forex market bar bar keya karte hey es bat ko bhe farz karen keh ap forex chart par chand pips par he hotay hein chand bar aik khas shape or triangle ban jata hey price bad mein aik khas direction ko follow karte nazar atte hey
                      yeh triangle forex market mein aik khas direction ke taraf eshara kar rahay hotay hein price action forex market kay aglay step par nazar rakhtay hovay forex market ke movement ke taraf eshara kar rahay hotay hein aglay step par nazar rakhtay hovay market ke movement par he nazar rakh saktay hein yeh aik game mein pattern ko talash karnay or faiday kay ley
                • #9 Collapse


                  A Price Action Indicator is a tool used by traders to analyze and interpret price movements in financial markets, such as stocks, forex, or commodities. Unlike traditional technical indicators that rely on mathematical calculations and historical data, price action indicators focus on the movement of price itself. These indicators help traders identify trends, reversals, and potential trading opportunities by analyzing candlestick patterns, support and resistance levels, and other market behavior.

                  Some common types of price action indicators or tools include:
                  1. Candlestick Patterns: These are formations of one or more candlesticks on a price chart that indicate a potential market movement. Examples include Doji, Hammer, Engulfing Patterns, and Pin Bars.
                  2. Support and Resistance Levels: These are horizontal lines on a price chart that indicate where the price has historically struggled to move above (resistance) or below (support).
                  3. Trend Lines: These are diagonal lines drawn on a chart to connect a series of highs or lows, helping to identify the direction of the market trend.
                  4. Price Channels: These are formed by drawing two parallel lines on a price chart that contain the price action within them, indicating potential areas of support and resistance.
                  5. Volume Analysis: Although not purely price action, volume analysis can complement price action by showing the strength of a price move.
                  6. Moving Averages: While they are often seen as traditional indicators, moving averages can be used in price action analysis to identify trends and dynamic support and resistance levels.

                  Price action trading often involves minimal use of indicators, with traders focusing on the raw price data, but these tools can help provide additional context to make informed decisions.

                  Price action trading is a method that relies on the analysis of raw price movements rather than using lagging indicators derived from historical price data. Traders who use price action believe that all the information they need to make trading decisions is contained within the price itself. They focus on the actual price behavior, such as how prices react to certain levels, the speed of price movement, and patterns that emerge over time.
                  Key Concepts in Price Action Trading
                  1. Candlestick Patterns:
                    • Doji: Indicates market indecision, where the opening and closing prices are nearly the same. It can signal a potential reversal.
                    • Hammer: A bullish reversal pattern that forms after a downtrend. It has a small body and a long lower wick, indicating that sellers pushed the price down but buyers stepped in to push it back up.
                    • Shooting Star: A bearish reversal pattern that forms after an uptrend. It has a small body and a long upper wick, showing that buyers tried to push the price higher but failed, and sellers took control.
                  2. Support and Resistance:
                    • Support Levels: These are price levels where the market has previously found buying interest, preventing the price from falling further. When the price approaches a support level, traders watch for signs of buying strength.
                    • Resistance Levels: These are price levels where the market has previously found selling interest, preventing the price from rising further. When the price nears a resistance level, traders look for signs of selling strength.
                    • Role Reversal: Once a support level is broken, it can become resistance, and vice versa. This concept is essential in price action trading.
                  3. Trend Identification:
                    • Higher Highs and Higher Lows: A series of higher highs and higher lows indicates an uptrend. Price action traders look to buy during pullbacks in an uptrend.
                    • Lower Highs and Lower Lows: A series of lower highs and lower lows indicates a downtrend. Price action traders look to sell during pullbacks in a downtrend.
                    • Trend Lines: These are drawn to connect swing highs or swing lows, helping traders visualize the trend. A break of a trend line can signal a potential trend reversal.
                  4. Price Patterns:
                    • Double Top/Bottom: A double top is a bearish reversal pattern that forms after an uptrend, while a double bottom is a bullish reversal pattern that forms after a downtrend. They indicate that the price failed to break through a certain level twice.
                    • Head and Shoulders: This is a bearish reversal pattern that typically forms at the end of an uptrend. It consists of three peaks, with the middle peak (the head) being higher than the other two (the shoulders). The opposite pattern, called the Inverse Head and Shoulders, signals a bullish reversal.
                    • Flags and Pennants: These are continuation patterns that indicate a brief consolidation before the trend resumes. Flags are rectangular-shaped, while pennants are triangular-shaped.
                  5. Psychological Levels:
                    • Round Numbers: Price levels like 1.0000 in forex or $100 in stocks are psychologically significant because traders often place orders around these levels. These levels often act as support or resistance.
                    • Fibonacci Retracement Levels: Although technically an indicator, many price action traders use Fibonacci retracement levels to identify potential support and resistance zones.
                  6. Volume Analysis:
                    • Volume Spikes: High volume during price moves can indicate strong interest and confirm the validity of a breakout or breakdown.
                    • Divergence: Price moving in one direction while volume moves in the opposite direction can indicate a weakening trend, often leading to a reversal.
                  7. Breakouts and False Breakouts:
                    • Breakouts: When the price moves beyond a support or resistance level with significant momentum, it’s considered a breakout. Traders often enter trades in the direction of the breakout.
                    • False Breakouts: Sometimes, the price briefly moves beyond a level but quickly reverses back. This can trap traders and lead to a rapid move in the opposite direction, providing trading opportunities for those who anticipate it.
                  8. Risk Management:
                    • Stop Loss Placement: Price action traders often place stop-loss orders just beyond support or resistance levels, trend lines, or recent swing highs/lows to limit potential losses.
                    • Position Sizing: Based on the distance between the entry and the stop-loss level, traders determine the size of their position to ensure they do not risk too much capital on a single trade.
                  Advantages of Price Action Trading
                  • Simplicity: Since price action trading involves minimal use of indicators, it simplifies the trading process. Traders focus on price charts, making it easier to identify trends and potential reversals.
                  • Adaptability: Price action strategies can be applied to any market and on any time frame, making them versatile tools for traders.
                  • Real-Time Feedback: Price action provides immediate information about market conditions, allowing traders to react quickly to changes.
                  Disadvantages of Price Action Trading
                  • Subjectivity: Price action trading can be subjective. Different traders may interpret the same price movements differently, leading to varied conclusions.
                  • Requires Practice: Successfully reading and interpreting price action requires experience and practice. New traders might find it challenging to rely solely on price action without additional indicators.
                  • Market Conditions: Price action trading may be less effective in highly volatile or low-liquidity markets where price movements are erratic and less predictable.
                  Conclusion

                  Price action trading is a powerful approach that emphasizes reading the market's natural movements. It can be a highly effective strategy for traders who dedicate time to learning and understanding the nuances of price behavior. While it can be used on its own, many traders combine price action analysis with other forms of technical analysis to enhance their trading decisions.

                  Price action trading delves deep into the psychology of market participants, focusing on how buyers and sellers react at key levels, the patterns that develop over time, and how these movements can be interpreted to forecast future price behavior. This trading methodology is rooted in the belief that all fundamental factors and market sentiment are reflected in the price itself. Therefore, by closely observing price movement, a trader can gain insights into market psychology and make informed decisions without relying heavily on lagging indicators.
                  Advanced Concepts in Price Action Trading
                  1. Order Flow and Market Structure:
                    • Order Flow: This refers to the actual buying and selling activity in the market. Price action traders pay attention to the flow of orders, especially in areas of liquidity, where large volumes of orders are executed. Understanding order flow helps traders anticipate potential reversals or continuations.
                    • Market Structure: The overall framework of price action is governed by market structure. It includes phases such as accumulation, where buying interest builds up; markup, where prices start to rise; distribution, where selling interest takes over; and markdown, where prices decline. Recognizing these phases helps traders identify potential entry and exit points.
                  2. Multiple Time Frame Analysis:
                    • Top-Down Approach: This involves analyzing multiple time frames to gain a comprehensive view of the market. For example, a trader might start by analyzing the daily chart to identify the broader trend, then move to the 4-hour chart for more detailed analysis, and finally to the 1-hour or 15-minute chart for precise entry points.
                    • Confluence Across Time Frames: When the price action signals on different time frames align, it increases the probability of a successful trade. For example, if a support level on the daily chart aligns with a bullish candlestick pattern on the 4-hour chart, it can be a strong signal to buy.
                  3. Price Action Context:
                    • Contextual Analysis: Price action does not occur in isolation; it is influenced by broader market conditions, news events, and economic data. Traders must consider the context in which a price movement occurs. For instance, a strong uptrend during a period of positive economic data might be more sustainable than an uptrend in the face of negative news.
                    • Market Sentiment: Understanding the overall market sentiment is crucial in price action trading. Sentiment indicators, such as the CBOE Volatility Index (VIX) or the Commitment of Traders (COT) report, can provide additional context to price movements, helping traders gauge whether the market is risk-on (optimistic) or risk-off (pessimistic).
                  4. Advanced Price Patterns:
                    • Three-Bar Reversal: This pattern occurs when a series of three candles signals a reversal in the current trend. For example, in an uptrend, a three-bar reversal might consist of a strong bullish candle, followed by a smaller candle with a small body (indicating indecision), and then a bearish candle that closes below the low of the first candle.
                    • Inside Bar: An inside bar occurs when the entire range of a candle is within the range of the previous candle. It indicates a period of consolidation and low volatility, often followed by a strong breakout in either direction.
                    • Outside Bar: An outside bar is the opposite of an inside bar. It occurs when a candle’s range completely engulfs the range of the previous candle. This pattern often signals a potential reversal or a strong continuation of the trend.
                  5. Institutional Order Flow and Smart Money Concepts:
                    • Liquidity Zones: Price action traders often look for liquidity zones, where large institutional orders are likely to be placed. These zones are typically around significant support and resistance levels or round numbers. When the price enters these zones, it may trigger large orders that move the market.
                    • Wyckoff Method: This method involves analyzing price and volume to determine the intentions of "smart money" (large institutional traders). The Wyckoff Method identifies accumulation (buying) and distribution (selling) phases and anticipates where these big players might enter or exit the market.
                    • Stop Hunts: Sometimes, institutional players push the price to key levels where retail traders have placed their stop-loss orders. This triggers the stops, creating liquidity for large orders to be filled at favorable prices. Price action traders often look for these stop hunts as potential trading opportunities.
                  6. Volatility and Range Expansion:
                    • Volatility Breakouts: Volatility often precedes price movement. When a market is in a period of low volatility, it is often followed by a significant breakout. Price action traders monitor volatility indicators, such as Bollinger Bands or the Average True Range (ATR), to anticipate potential breakouts.
                    • Range Expansion and Contraction: Markets move through phases of range expansion (trending) and contraction (consolidation). Price action traders look for signs that a contraction phase is ending and a new trend is beginning. Range expansion can be identified by increasing volatility, while range contraction is marked by decreasing volatility.
                  7. Risk-Reward and Trade Management:
                    • Risk-Reward Ratio: This is the ratio of potential profit to potential loss on a trade. Price action traders aim for a favorable risk-reward ratio, often targeting trades with at least a 2:1 or 3:1 ratio. This means that for every dollar risked, the potential reward is two or three dollars.
                    • Trailing Stops: To maximize profits and protect against reversals, traders often use trailing stops. These are stop-loss orders that move in the direction of the trade, locking in profits as the price moves favorably.
                    • Scaling In and Out: Instead of entering or exiting a trade all at once, some traders scale in or out. This means they gradually add to their position as the trade moves in their favor or exit in parts as the price approaches their target.
                  8. Price Action in Different Market Environments:
                    • Trending Markets: In a trending market, price action traders focus on identifying the trend direction and trading in that direction. They use tools like trend lines, moving averages, and higher highs/lows to stay with the trend.
                    • Range-Bound Markets: In a market that is moving sideways, traders look to buy at support and sell at resistance. They may also use range-bound patterns like double tops and bottoms, or trade breakouts when the price exits the range.
                    • Choppy Markets: In choppy markets with no clear direction, price action traders need to be cautious. They might avoid trading altogether or look for very short-term opportunities with tight stop-losses.
                  Combining Price Action with Other Trading Strategies

                  While many price action traders prefer to trade purely based on price, combining price action with other strategies can enhance decision-making:
                  • Fundamental Analysis: Combining price action with an understanding of economic indicators, earnings reports, and geopolitical events can provide a more holistic view. For instance, a price action signal in a stock might be more convincing if it aligns with strong earnings growth.
                  • Sentiment Indicators: Sentiment tools, like the Put/Call ratio or the Fear & Greed Index, can help traders understand the broader market mood. If sentiment is extremely bullish or bearish, it might influence how a price action signal is interpreted.
                  • Quantitative Tools: Some traders blend price action with quantitative analysis, such as statistical models or machine learning, to identify patterns or anomalies in price data. This can provide an additional layer of confirmation or signal generation.
                  Developing a Price Action Trading Plan

                  A well-structured trading plan is crucial for success in price action trading. Key components include:
                  • Market Selection: Decide which markets (forex, stocks, commodities, etc.) you will focus on. Price action can be applied to any market, but some traders specialize in specific assets or sectors.
                  • Time Frame Selection: Determine which time frames you will analyze. Day traders might focus on 5-minute or 15-minute charts, while swing traders might look at daily or weekly charts.
                  • Setup Identification: Clearly define the price action setups you will trade, such as pin bars, inside bars, or trend line breaks. Make sure these setups are well-documented in your trading plan.
                  • Entry and Exit Rules: Establish clear criteria for entering and exiting trades. This includes stop-loss placement, profit targets, and conditions under which you might exit a trade early.
                  • Risk Management: Define your risk management strategy, including how much of your capital you will risk per trade, your overall exposure, and your approach to position sizing.
                  • Trade Review and Improvement: Regularly review your trades, looking for patterns in your performance. Continuous improvement is key; identify what worked, what didn’t, and refine your approach.
                  Psychological Aspects of Price Action Trading

                  Trading psychology plays a critical role in price action trading, as it demands patience, discipline, and the ability to act decisively based on real-time information.
                  • Patience: Price action trading often requires waiting for the perfect setup. Impatience can lead to entering trades prematurely, resulting in losses.
                  • Discipline: Sticking to your trading plan, even in the face of emotional challenges, is crucial. This means adhering to your risk management rules and not chasing trades.
                  • Adaptability: Markets are dynamic, and price action traders need to be flexible. This might involve adapting to changing market conditions or revising strategies when they are no longer effective.
                  • Emotional Control: Managing emotions like fear, greed, and overconfidence is essential. These emotions can cloud judgment and lead to poor decision-making.
                  • #10 Collapse

                    Introduction.

                    Price action indicator aik aisa tool hai jo stock market ya kisi bhi financial market mein price ki movement ka andaza lagane ke liye istimal hota hai. Is mein kisi bhi stock, currency, ya commodity ke chart pe direct price ki movement ko dekh kar trade decisions liye jate hain. Is indicator ka khas tor pe istemal technical analysis mein hota hai jahan traders price ke raw data ko dekhte hain aur unhein alag-alag charts par analyze karte hain.

                    Kya Hai Price Action Indicator?

                    Price action indicator aik simple magar powerful tool hai jo market ke trend aur price movements ko samajhne mein madad karta hai. Yeh indicator kisi bhi stock ya asset ke price ki history ko dekh kar future ke price movements ka andaza lagata hai. Is mein koi bhi complex mathematical formula ya algorithm nahi hota, balki yeh direct price movements aur historical data par depend karta hai. Iska matlab hai ke aapko zyada technical indicators ya complicated charts ki zaroorat nahi hoti, balki aap price ke trend ko dekh kar apne trading decisions le sakte hain.

                    Price Action Indicator ke Benefits.

                    Price action indicator ke kai benefits hain. Sabse pehla benefit yeh hai ke yeh aapko market ke asli aur genuine trend ko dekhne mein madad karta hai. Is mein kisi bhi external factor ka asar nahi hota, jese ke news, reports, ya macroeconomic data. Yeh sirf aur sirf price ke movement ko track karta hai. Doosra benefit yeh hai ke yeh tool simple hai aur isse use karna asan hai. Agar aap ek naye trader hain, to aap asaani se price action indicator ko samajh sakte hain aur use kar sakte hain. Teesra, yeh indicator aapko jaldi se jaldi aur waqt par trading decisions lene mein madad karta hai, jisse aap market ke sudden changes ka faida utha sakte hain.

                    Kaise Istemaal Karein Price Action Indicator?

                    Price action indicator ko istamal karne ke liye sabse pehle aapko kisi bhi financial instrument ka chart kholna hoga. Phir aapko price ke trends, highs, lows, aur patterns ko dekhna hoga. Price action ke indicators mein candlestick patterns, support aur resistance levels, aur trendlines zyada important hote hain. Aap price ke movement ko dekh kar samajh sakte hain ke market mein abhi kis direction mein trade karna theek hoga. Misal ke taur par agar aap dekhte hain ke price ek support level par hai aur bounce back kar raha hai, to aap buy karne ka decision le sakte hain.
                    • #11 Collapse

                      Price Action Indicator: Ek Jaiza
                      1. Introduction Price action indicator trading ka ek ahem tool hai jo traders ko market ki halat samajhne mein madad karta hai. Iske zariye, traders bina kisi complex indicator ke price movements ko analyze kar sakte hain. Price action trading ka mool mantra yeh hai ke market ke historical price data ko dekh kar future price movements ko predict kiya jaye. Yeh approach simplicity aur clarity ke liye mashhoor hai, kyunki isme complex mathematical models aur indicators ki zaroorat nahi hoti.

                      Trading duniya mein, price action ko ek straightforward aur effective method ke taur par dekha jata hai. Is technique ka main focus price ke charts par hota hai, jahan traders price movements aur patterns ko observe karte hain. Jab traders price action indicators ka use karte hain, to wo market ki actual situation ko dekh kar decisions lete hain, jo unko better trading opportunities aur risks ko manage karne mein madad karta hai.

                      Price action trading ka ek fayda yeh hai ke yeh market ke natural movements ko samajhne mein madad karta hai. Traditional indicators ke comparison mein, jo past data ko mathematical formulas ke zariye analyze karte hain, price action trading market ke real-time data ko observe karta hai. Yeh approach traders ko market ki current state ko samajhne aur apni trading strategies ko accordingly adjust karne mein madad deti hai.

                      Traders ke liye price action indicators ko samajhna aur use karna ek skill hai jo practice aur experience se develop hoti hai. Price action ki technique ko mastering karna asaan nahi hai, lekin agar traders isme proficient ho jayein to wo market ki trends aur reversals ko accurately identify kar sakte hain. Is technique ki training aur practice zaroori hoti hai, taake traders market ke fluctuations ko better manage kar sakein.

                      Overall, price action indicators trading ki duniya mein ek powerful tool hain. Ye traders ko market ki fluctuations ko samajhne aur apne trading decisions ko data ke basis par banane mein madad karte hain. Is technique ko samajhna aur effectively use karna trading career ko successful banane mein key role play kar sakta hai.
                      1. Price Action Kya Hai? Price action ek technique hai jisme trading decisions ke liye market ki price movements ka study kiya jata hai. Ye technique historical price data ko dekh kar future price movements ko predict karne ki koshish karti hai. Price action trading ka mool concept yeh hai ke market ke price movements aur patterns hi trading decisions ko guide karte hain, bina kisi additional indicator ke.

                      Price action ko samajhne ke liye, traders ko market ki price charts ko analyze karna hota hai. Yeh charts price ki movement ko time ke sath visualize karte hain, aur traders in movements ko patterns aur trends ke zariye analyze karte hain. Price action trading ke under, traders typically price ke support aur resistance levels, trendlines, aur chart patterns ko observe karte hain.

                      Price action ka analysis karne ke liye, traders ko market ke behavior aur price movements ke patterns ko samajhna zaroori hota hai. Yeh technique market ke natural price movements ko observe karte hue trading decisions banane mein help karti hai. Traders price action ke patterns ko identify karke market ki direction aur potential reversals ko predict kar sakte hain.

                      Ek important aspect jo price action ko distinguish karta hai, wo yeh hai ke isme complex indicators aur mathematical calculations ka use nahi hota. Traders price movements ko directly observe karte hain aur unhe analyze karte hain. Yeh approach simplicity aur effectiveness ke liye jaana jata hai, aur kai traders is technique ko prefer karte hain.

                      Price action trading ek disciplined aur focused approach demand karti hai. Traders ko market ke dynamics ko samajhne ke liye patience aur practice ki zaroorat hoti hai. Is technique ko master karne ke liye continuous learning aur observation zaroori hai, jisse traders market ke changes aur fluctuations ko better manage kar sakte hain.
                      1. Indicators Ka Role Traditional technical indicators, jaise moving averages aur RSI, price action ka analysis karne ke liye use kiye jate hain. Lekin, price action trading indicators se alag hai, kyunki ye sirf price data ka istemal karti hai. Traditional indicators price movements ko smooth karne aur trends ko identify karne ke liye mathematical formulas ka use karte hain, jabke price action trading mein yeh indicators ke bina kaam hota hai.

                      Price action trading ke andar, indicators ka role limited hota hai. Traders price movements aur patterns ko directly observe karte hain aur unhe analyze karte hain, bina kisi additional calculation ke. Yeh approach traders ko market ke real-time data ko samajhne aur trading decisions ko accurate aur timely banane mein madad karti hai.

                      Moving averages aur RSI jaise indicators market ke trends aur momentum ko measure karne mein help karte hain, lekin price action trading in indicators ke bina bhi effective hoti hai. Price action trading mein traders market ke support aur resistance levels, trendlines, aur chart patterns ko observe karte hain, jo indicators ke comparison mein more direct approach hoti hai.

                      Indicators ke bina trading ka ek fayda yeh hai ke traders market ke natural price movements ko observe kar sakte hain. Yeh approach trading decisions ko zyada intuitive aur less formulaic banati hai. Isme traders market ke actual price movements ko samajhkar decisions lete hain, jo unko market ke fluctuations ko better manage karne mein madad karta hai.

                      Indicators aur price action trading dono ka apna-apna role hota hai. Indicators ka use traders ko market ke trends aur momentum ko measure karne mein help karta hai, jabke price action trading market ke real-time data ko directly analyze karti hai. Dono approaches ko understand karna aur use karna traders ko market ke different aspects ko samajhne aur effective trading decisions banane mein madad karta hai.
                      1. Price Action Indicators Ki Types Price action indicators kai types ke hote hain, jaise support and resistance levels, trendlines, aur chart patterns. Har ek indicator ki apni significance hoti hai aur ye market trends ko identify karne mein madad karte hain. Support aur resistance levels market ke critical points hote hain, jahan price often reverse ya stall hoti hai. Yeh levels price action ke analysis mein fundamental role play karte hain.

                      Trendlines market ke trends ko visualize karne ke liye use kiye jate hain. Trendlines ko draw karke traders market ke upward ya downward trend ko identify kar sakte hain. Trendlines ke zariye traders ko market ke direction aur potential reversals ko predict karne mein madad milti hai. Yeh tool price action trading ke basic elements mein se ek hai.

                      Chart patterns, jaise head and shoulders, double tops, aur triangles, price action indicators ke important components hain. Ye patterns market ke future movements aur reversals ko predict karne mein madad karte hain. Traders chart patterns ko identify karke trading decisions ko better align kar sakte hain market ke potential movements ke saath.

                      Price action indicators ke types ka understanding traders ko market ke different aspects ko analyze karne mein madad karta hai. Har indicator ki apni utility hoti hai aur trading decisions banane mein help karti hai. Traders ko in indicators ko effectively use karna aana chahiye taake wo market trends ko accurately identify kar sakein.

                      Price action indicators ko samajhna aur use karna trading ke success ke liye crucial hai. Traders ko har indicator ki functionality aur significance ko samajhna zaroori hai. Is knowledge ke zariye, traders market ke different scenarios ko handle kar sakte hain aur apni trading strategies ko optimize kar sakte hain.
                      1. Support Aur Resistance Levels Support aur resistance levels price action indicators ka ek fundamental part hain. Support level wo point hai jahan price girti hai aur wapas upar aati hai, jabke resistance level wo point hai jahan price barhti hai aur phir girti hai. Support aur resistance levels market ke crucial points hote hain jahan price ko significant movements milti hain.

                      Support level wo price point hai jahan market ke sellers aur buyers ki balance hoti hai. Jab price support level ke paas aati hai, to buyers market mein enter karte hain aur price ko support karte hain. Yeh level traders ko potential buying opportunities dikhata hai, kyunki price ke wahan se upar jane ke chances hote hain.

                      Resistance level wo point hai jahan price ko upward movement ke dauran rok diya jata hai. Yeh level traders ko potential selling opportunities provide karta hai, kyunki yahan price ka reversal ya consolidation ho sakta hai. Resistance level ko identify karne ke liye, traders historical price data aur chart patterns ka analysis karte hain.

                      Support aur resistance levels ko analyze karne se traders ko market ke critical points samajhne mein madad milti hai. In levels ke zariye traders market ke potential reversals aur breakouts ko predict kar sakte hain. Yeh levels trading decisions ko guide karne mein crucial role play karte hain.

                      Traders ko support aur resistance levels ko accurately identify karna zaroori hai, kyunki yeh levels market ke key points hain. Price action ke analysis ke zariye traders ko in levels ko monitor karna hota hai taake wo market ke movements ko effectively manage kar sakein. Support aur resistance levels ko samajhna aur use karna price action trading ke fundamental aspects mein se ek hai.
                      1. Trendlines Aur Channels Trendlines aur channels price action indicators ke basic tools hain jo market ke trends ko identify karne mein madad karte hain. Trendlines ko draw karke traders market ke trend ko visually analyze kar sakte hain. Trendlines market ke upward ya downward direction ko indicate karte hain aur potential reversals ko predict karne mein help karte hain.

                      Trendlines ko draw karne ke liye, traders do ya zyada significant price points ko connect karte hain. Ek upward trendline un points ko connect karti hai jahan price higher highs aur higher lows banati hai. Ek downward trendline un points ko connect karti hai jahan price lower highs aur lower lows banati hai. Trendlines traders ko market ke trend ko visualize karne aur trading decisions ko align karne mein madad karte hain.

                      Channels trendlines ke sath use kiye jate hain aur price movements ko analyze karne ke liye use hote hain. Channels do parallel trendlines ko connect karte hain jo price ke fluctuations ko visualize karte hain. Ek upward channel price ke higher highs aur higher lows ko connect karta hai, jabke ek downward channel price ke lower highs aur lower lows ko connect karta hai.

                      Trendlines aur channels price action trading ke effective tools hain. Ye tools traders ko market ke trends aur price movements ko analyze karne mein help karte hain. Trendlines aur channels ke analysis se traders market ke potential movements aur reversals ko predict kar sakte hain, jo trading decisions ko better guide karte hain.

                      Traders ko trendlines aur channels ko accurately draw karna aur analyze karna aana chahiye. Yeh skills price action trading ke success ke liye essential hain. Practice aur observation ke zariye traders in tools ko effectively use kar sakte hain aur market ke trends ko accurately identify kar sakte hain.
                      1. Chart Patterns Ka Analysis Chart patterns, jaise head and shoulders aur double tops, price action ke important indicators hain. Ye patterns market ki direction ko predict karne mein madad karte hain aur trading strategies develop karne mein bhi useful hote hain. Chart patterns ko identify karne ke liye, traders price charts ko analyze karte hain aur unme recurring patterns ko dekhte hain.

                      Head and shoulders pattern ek reversal pattern hai jo market ke direction ko change karne ki indication deta hai. Yeh pattern ek peak ke sath do smaller peaks banata hai, jo market ke potential reversal ko signal karta hai. Head and shoulders pattern ko identify karne ke baad, traders market ke potential reversal ke according trading decisions lete hain.

                      Double tops aur double bottoms bhi chart patterns hain jo market ke reversal signals provide karte hain. Double top pattern do peaks ko indicate karta hai jo market ke bearish reversal ko signal karte hain, jabke double bottom pattern do troughs ko indicate karta hai jo market ke bullish reversal ko signal karte hain. Ye patterns market ke price movements ko predict karne mein madadgar hote hain.

                      Chart patterns ka analysis trading decisions ko guide karne mein crucial role play karta hai. Traders ko patterns ko accurately identify karna aur analyze karna aana chahiye taake wo market ke movements ko effectively samajh sakein. Patterns ke analysis ke zariye traders market ke potential trends aur reversals ko predict kar sakte hain.

                      Effective chart pattern analysis traders ko market ke different scenarios ko handle karne mein madad karta hai. Traders ko practice aur experience ke zariye in patterns ko accurately identify karna zaroori hota hai. Chart patterns ke analysis se trading strategies ko optimize kiya ja sakta hai aur market ke fluctuations ko better manage kiya ja sakta hai.
                      1. Candlestick Patterns Candlestick patterns price action trading ka ek integral part hain. Patterns, jaise doji aur engulfing patterns, price movements aur market sentiment ko reflect karte hain. Ye patterns traders ko buy ya sell signals provide karte hain, jo trading decisions ko guide karte hain.

                      Doji pattern ek candlestick pattern hai jo market ke indecisiveness ko indicate karta hai. Doji pattern ka body chhota hota hai aur wicks barhi hoti hain, jo market ke confusion aur uncertainty ko show karta hai. Ye pattern traders ko market ke potential reversal ya consolidation ke signals provide karta hai.

                      Engulfing pattern bhi ek important candlestick pattern hai jo market ke bullish ya bearish reversal ko indicate karta hai. Bullish engulfing pattern ek bearish candle ke baad aati hai jo ek large bullish candle se engulf hoti hai, jabke bearish engulfing pattern ek bullish candle ke baad aati hai jo ek large bearish candle se engulf hoti hai. Ye patterns market ke potential reversals ko signal karte hain.

                      Candlestick patterns ko analyze karne se traders ko market ke sentiment aur price movements ko better understand karne mein madad milti hai. Ye patterns trading signals ko generate karte hain aur traders ko buy ya sell decisions lene mein help karte hain. Effective candlestick pattern analysis traders ko market ke fluctuations ko better manage karne mein madad karti hai.

                      Candlestick patterns ki accurate identification aur analysis trading success ke liye crucial hai. Traders ko in patterns ko dekhne aur samajhne ke liye practice aur experience ki zaroorat hoti hai. Candlestick patterns ke zariye traders market ke potential movements aur reversals ko accurately predict kar sakte hain.
                      1. Price Action Indicators Aur Risk Management Price action indicators risk management ko improve karne mein madad karte hain. Traders price action analysis ke zariye risk-reward ratios ko calculate kar sakte hain aur apne trades ko effectively manage kar sakte hain. Risk management price action trading ka ek important aspect hai jo trading success ko determine karta hai.

                      Price action indicators, jaise support aur resistance levels, risk management ke liye useful tools hain. Support aur resistance levels ko identify karke traders risk aur reward ko evaluate kar sakte hain. Yeh levels traders ko potential stop-loss aur take-profit points ko set karne mein help karte hain.

                      Trendlines aur chart patterns bhi risk management ke liye important hote hain. Trendlines traders ko market ke trends aur potential reversals ko identify karne mein madad karti hain, jabke chart patterns market ke future movements ko predict karte hain. In tools ke zariye traders risk aur reward ke ratios ko effectively manage kar sakte hain.

                      Price action indicators ke analysis ke zariye traders ko market ke fluctuations ko better handle karne mein madad milti hai. Risk management strategies ko effectively implement karne se traders market ke risks ko minimize kar sakte hain aur apni trading performance ko improve kar sakte hain.

                      Effective risk management price action trading ke success ke liye essential hai. Traders ko apne trades ko manage karna aur market ke risks ko evaluate karna aana chahiye. Price action indicators ke use se traders ko risk management strategies ko optimize karne mein madad milti hai.
                      1. Advantages Of Using Price Action Indicators Price action indicators ke kuch major advantages hain, jaise simplicity, clarity, aur real-time analysis. Inka use karke traders complex trading systems se bach sakte hain aur market trends ko asaani se samajh sakte hain. Price action trading ka main advantage yeh hai ke isme complex mathematical models aur indicators ki zaroorat nahi hoti.

                      Simplicity price action trading ka ek major advantage hai. Traders ko price movements ko directly observe karna hota hai, bina kisi additional calculations ke. Yeh approach trading decisions ko straightforward aur intuitive banati hai, jo trading performance ko improve karne mein madad karta hai.

                      Clarity bhi price action indicators ka ek significant advantage hai. Price action trading market ke real-time data ko analyze karti hai, jo traders ko market ke current conditions ko clear aur accurate tareeke se samajhne mein madad karta hai. Yeh clarity trading decisions ko better guide karti hai.

                      Real-time analysis price action trading ka ek important benefit hai. Traders market ke current price movements ko observe karte hain aur unke basis par decisions lete hain. Yeh approach trading decisions ko timely aur relevant banati hai, jo market ke fluctuations ko effectively manage karne mein help karti hai.

                      Price action indicators ke use se traders complex trading systems aur indicators se bach sakte hain. Yeh approach simplicity aur clarity provide karti hai, jo trading decisions ko better banati hai. Price action trading ko samajhna aur effectively use karna trading success ke liye crucial hai.
                      1. Price Action Trading Strategies Price action trading strategies market ki current conditions ke hisaab se design ki jati hain. Ye strategies price patterns aur trends ko analyze karke trading decisions banane mein help karti hain. Price action trading strategies market ke real-time data aur patterns ko observe karne par focus karti hain.

                      Ek popular price action trading strategy support aur resistance levels ke analysis par based hoti hai. Traders support aur resistance levels ko identify karte hain aur unke basis par trading decisions lete hain. Yeh strategy market ke key levels ko dekh kar buying aur selling opportunities ko identify karne mein madad karti hai.

                      Trend-following strategy bhi price action trading ka ek important aspect hai. Isme traders market ke trends ko follow karte hain aur apne trades ko trend ke direction ke hisaab se align karte hain. Trend-following strategy market ke momentum ko capture karne mein help karti hai aur traders ko profitable trades execute karne mein madad karti hai.

                      Chart patterns aur candlestick patterns bhi price action trading strategies ka part hote hain. Traders in patterns ko identify karke market ke potential movements aur reversals ko predict karte hain. Yeh patterns trading strategies ko optimize karne aur market ke fluctuations ko manage karne mein help karte hain.

                      Price action trading strategies ko develop karne aur implement karne ke liye traders ko continuous practice aur observation ki zaroorat hoti hai. Effective strategies market ke different scenarios ko handle karne mein madad karti hain aur trading performance ko improve karti hain.
                      1. Common Mistakes In Price Action Trading Price action trading mein kuch common mistakes bhi hoti hain, jaise over-analysis aur misinterpretation of patterns. Traders ko ye mistakes avoid karne ke liye practice aur experience zaroori hota hai. Over-analysis se traders market ke movements ko complex aur confusing bana dete hain, jo trading decisions ko negatively impact kar sakta hai.

                      Ek common mistake jo traders karte hain wo hai patterns ko incorrectly identify karna. Chart patterns aur candlestick patterns ko accurate tareeke se identify karna zaroori hota hai. Agar traders patterns ko galat identify karte hain to wo market ke potential movements ko accurately predict nahi kar sakte.

                      Another mistake jo traders often karte hain wo hai market ke noise ko ignore karna. Market ke fluctuations aur short-term movements ko dekh kar traders apne decisions ko impact kar dete hain. Yeh noise traders ko market ke real trends aur patterns ko accurately analyze karne se rok sakta hai.

                      Traders ko patience aur discipline ki zaroorat hoti hai price action trading mein mistakes ko avoid karne ke liye. Practice aur experience se traders apne skills ko improve kar sakte hain aur common mistakes ko avoid kar sakte hain. Trading decisions ko market ke real-time data aur patterns ke basis par lena zaroori hota hai.

                      Common mistakes ko identify karna aur unhe avoid karna trading performance ko improve karne mein madad karta hai. Traders ko market ke fluctuations aur patterns ko samajhne ke liye continuous learning aur observation zaroori hoti hai. Effective practice aur discipline se traders apne trading decisions ko better bana sakte hain.
                      1. Price Action Trading Tools Kuch tools, jaise trading platforms aur charting software, price action trading ko asaan aur effective banate hain. Ye tools traders ko accurate analysis aur timely decisions lene mein madad karte hain. Trading platforms price action trading ke liye essential tools hain jo market ke real-time data ko provide karte hain.

                      Charting software bhi price action trading ke liye important tools hain. Yeh software traders ko price charts ko customize karne aur analyze karne mein madad karte hain. Charting software ke zariye traders market ke trends aur patterns ko visualize kar sakte hain aur apne trading decisions ko guide kar sakte hain.

                      Trading tools ke use se traders ko market ke fluctuations aur price movements ko accurately analyze karne mein madad milti hai. Yeh tools traders ko trading strategies ko implement karne aur market ke potential movements ko identify karne mein help karte hain. Effective use of trading tools trading performance ko improve karne mein madad karta hai.

                      Trading platforms aur charting software ka selection traders ke trading style aur needs ke hisaab se hona chahiye. Traders ko in tools ka use karna aana chahiye aur unki functionality ko samajhna zaroori hota hai. Yeh tools traders ko market ke real-time data aur accurate analysis provide karte hain.
                      1. Conclusion Price action indicators trading ki world mein ek powerful tool hain. Inka use karke traders market ki movements ko better samajh sakte hain aur apni trading strategies ko optimize kar sakte hain. Price action trading ka concept simple hai lekin practice aur patience ki zaroorat hoti hai. Price action indicators ke zariye traders market ke potential movements aur reversals ko accurately predict kar sakte hain.

                      Price action trading ke advantages simplicity, clarity, aur real-time analysis hain. Ye factors trading decisions ko better guide karte hain aur trading performance ko improve karte hain. Traders ko price action indicators ko effectively use karna aana chahiye aur market ke real-time data ko analyze karna zaroori hota hai.

                      Traders ko price action trading ke tools aur techniques ko practice aur experience ke zariye master karna zaroori hota hai. Effective use of price action indicators trading success ke liye crucial hai. Traders ko apni trading strategies ko continuously update aur optimize karna chahiye taake wo market ke fluctuations ko better manage kar sakein.

                      Overall, price action trading ek straightforward aur effective approach hai jo market ke real-time data ko analyze karne mein help karti hai. Is technique ko samajhna aur effectively use karna trading career ko successful banane mein key role play kar sakta hai. Traders ko price action indicators ke zariye market ke potential movements ko accurately predict karna zaroori hota hai.
                      • #12 Collapse

                        Price action indicator ek trading tool hai jo ke financial markets mein price movements ko analyze karne ke liye use hota hai. Yeh indicator traders ko market ki current conditions aur future price movements ke trends ko samajhne mein madad karta hai. Price action trading ek aisa approach hai jahan pe traders charts aur price movements ko directly observe karte hain, bina kisi external indicators ke.
                        Jab hum price action ki baat karte hain, to hum primarily chart patterns, price levels aur candlestick patterns ko observe karte hain. Candlestick patterns, jaise ke doji, hammer, aur engulfing, market ke sentiment aur potential reversals ko indicate karte hain. In patterns ka analysis traders ko yeh samajhne mein madad karta hai ke market ka mood kya hai aur kis direction mein move kar sakta hai.

                        Ek common price action technique support aur resistance levels ko identify karna hai. Support wo level hai jahan price girti hai aur wahan se bounce back karti hai, jabke resistance wo level hai jahan price upar ki taraf move karti hai aur wahan se wapas girti hai. In levels ko samajh kar traders ko yeh pata chalta hai ke kab buy ya sell karna hai.

                        Price action trading mein ek aur important concept hai trend lines. Trend lines market ke trends ko visually represent karti hain aur traders ko yeh batati hain ke market kis direction mein move kar raha hai. Jab price trend line ke upar ya niche move karti hai, to yeh ek potential trading signal hota hai.

                        Market structure bhi price action analysis ka ek part hai. Market structure se murad hai ke market kis tarah se move kar raha hai, jise ke higher highs aur higher lows ya lower highs aur lower lows. Ye movements market ke overall trend ko indicate karte hain. Higher highs aur higher lows bullish trend ko indicate karte hain, jabke lower highs aur lower lows bearish trend ko indicate karte hain.

                        Price action trading ka ek faida yeh bhi hai ke yeh trading decisions ko zyada objective banata hai. Traditional indicators kabhi kabhi misleading ho sakte hain, lekin price action trading ke zariye aap market ki real-time movements ko directly observe karte hain. Yeh approach zyada flexible aur adaptable hota hai, jo ke different market conditions mein kaam karta hai.

                        Lekin, price action trading bhi challenges ke bina nahi hota. Is approach ko effectively use karne ke liye aapko market ke behavior aur price movements ko deeply understand karna hota hai. Har trader ke liye yeh zaroori hai ke wo price action patterns ko analyze karne ki skills ko develop karein aur apne trading strategy ko test karein.

                        Aakhir mein, price action indicator ek valuable tool hai jo traders ko market ki dynamics ko samajhne aur successful trading decisions lene mein madad karta hai. Yeh approach ke sath patience aur practice zaroori hai, lekin agar sahi tarike se use kiya jaye to yeh traders ko significant edge de sakta hai


                        • #13 Collapse

                          # Price Action Indicator: Ek Comprehensive Guide
                          ## 1. Price Action Ka Matlab

                          Price action trading ek trading technique hai jisme traders market ki price movements ko analyze karte hain bina kisi lagging indicators ke. Ye technique price ke fluctuations par focus karti hai aur traders ko market ki actual behavior samajhne mein madad karti hai. Ismein price patterns, candlestick formations aur support-resistance levels ko use kiya jata hai.

                          ## 2. Price Action Indicators Ki Pehchaan

                          Price action indicators woh tools hain jo traders ko price movements ka analysis karne mein madad dete hain. Ye indicators historical price data par base hote hain aur ismein koi bhi lagging data ya external factors nahi hote. Traders in indicators ko market ki trend direction aur potential reversal points ko samajhne ke liye istemal karte hain.

                          ## 3. Candlestick Patterns Ka Ahmiyat

                          Candlestick patterns price action trading ka aik important hissa hain. Ye patterns market ke sentiment aur trader behavior ko reflect karte hain. Kuch mashhoor candlestick patterns jese ki doji, hammer, aur engulfing pattern hain, jo trend reversal ya continuation ke signals dete hain. Traders in patterns ko identify kar ke trading decisions lete hain.

                          ## 4. Support Aur Resistance Levels

                          Support aur resistance levels price action trading ke fundamental concepts hain. Support level wo price point hai jahan demand itni zyada hoti hai ke price usse niche nahi jaata. Resistance level wo price point hai jahan supply itni zyada hoti hai ke price usse upar nahi jaata. Ye levels traders ko entry aur exit points identify karne mein madad karte hain.

                          ## 5. Trend Lines Ka Istemal

                          Trend lines price action analysis mein important role play karti hain. Ye lines price movements ko visualize karne aur trends ko identify karne ke liye draw ki jaati hain. Agar price ek upward trend mein hai, to traders is trend line ko follow karte hain aur trading decisions uss direction mein lete hain.

                          ## 6. Breakouts Aur Fakeouts

                          Breakouts aur fakeouts price action trading ke key elements hain. Breakout wo situation hai jab price support ya resistance level ko successfully cross kar leta hai, jo market mein momentum create karta hai. Lekin kabhi kabhi price is breakout ko maintain nahi kar pata, aur ye fakeout ban jata hai. Traders ko in situations ka keenly observation karna chahiye.

                          ## 7. Price Action Trading Strategy

                          Price action trading strategy develop karna ek skill hai. Traders ko market ke price movements ko analyze karna aur patterns identify karna aana chahiye. Aik acha strategy price action ko support-resistance levels, candlestick patterns, aur trend lines ke sath mila kar tayar kiya jata hai. Is strategy se traders ko entry aur exit points ka pata chalta hai.

                          ## 8. Trading Psychology Ka Role

                          Price action trading mein trading psychology ka bohot bada role hota hai. Traders ko apni emotions ko control karna hota hai, kyunki market ki volatility unhe impulsive decisions lene par majboor kar sakti hai. Successful traders woh hote hain jo price movements ko samajhne ke sath-sath apne emotions par bhi control rakhte hain.

                          ## 9. Time Frames Ka Faida

                          Different time frames price action trading mein analysis ke liye important hote hain. Short-term traders 5-minute ya 15-minute charts par focus karte hain, jabke long-term traders daily ya weekly charts ka istemal karte hain. Different time frames ko analyze karna market ki overall trend aur price action ko samajhne mein madad karta hai.

                          ## 10. Risk Management Techniques

                          Price action trading mein risk management techniques ka istemal karna zaroori hai. Traders ko yeh samajhna chahiye ke har trade mein risk hota hai, is liye stop-loss orders ka istemal karna chahiye. Aik acha risk-to-reward ratio bhi zaroori hai, jisse traders ko losses se bachne mein madad milti hai.

                          ## 11. Backtesting Ka Ahmiyat

                          Backtesting price action trading strategies ko test karne ka ek effective tarika hai. Traders historical price data ka istemal kar ke dekhte hain ke unki strategy past mein kaise perform ki thi. Ye process unhe apne strategies ko refine karne aur unka effectiveness jaanchne mein madad karta hai.

                          ## 12. Common Mistakes Jo Traders Karte Hain

                          Price action trading mein kuch aam ghaltiyaan hain jo traders karte hain. In mein emotional trading, overtrading, aur incorrect risk management shamil hain. Yeh mistakes unki trading performance ko negatively impact karti hain. Is liye traders ko in ghaltiyon se bachne aur disciplined rahne ki zaroorat hai.

                          ## 13. Conclusion: Price Action Trading Ki Future

                          Price action trading ek aisi skill hai jo har trader ke liye valuable hai. Is technique ke zariye traders market ki actual movements ko samajh sakte hain aur informed decisions le sakte hain. Future mein, jab technology aur market dynamics evolve hote hain, price action trading ki relevance aur importance kabhi kam nahi hogi. Traders ko yeh samajhna chahiye ke continuous learning aur practice se wo apni skills ko enhance kar sakte hain.

                          Yeh article price action indicator aur iski importance ko samajhne mein madadgar hoga. Traders ko chahiye ke wo in concepts ko apni trading strategy mein shamil karen aur market ko behtar tarike se samajhne ki koshish karen.
                           
                          • #14 Collapse

                            Price Action Indicator: Ek Comprehensive Guide

                            Introduction


                            Price action trading ek aisa tareeqa hai jisme traders market ki price movements ko analyze karte hain bina kisi complex indicators ya tools ke. Is approach ka asal maqsad market ki real-time price fluctuations ko samajhna aur unse trade decisions lena hai. Is maqalay mein hum price action indicators ke bare mein baat karenge, unki ahmiyat, aur unhein kaise istemal kiya ja sakta hai.
                            Price Action Kya Hai?


                            Price action ka matlab hai market ki price ka waqt ke sath kis tarah se badalna. Yeh analysis sirf price charts par hota hai, jahan traders candlesticks, trends, aur support-resistance levels ko dekhte hain. Price action trading ka focus price ke asli movements par hota hai, jo traders ko samajhne mein madad deti hai ke market kis direction mein ja raha hai.
                            Price Action Indicators Ki Zaroorat


                            Traditional indicators jaise moving averages ya oscillators kabhi kabhi misleading signals de sakte hain. Is liye, price action indicators ko istemal karna behtar hota hai kyunki yeh market ki asal halat ko zahir karte hain. Yeh indicators aasan aur seedha tareeqa dete hain market ke behavior ko samajhne ka.
                            Candlestick Patterns


                            Candlestick patterns price action ka ek aham hissa hain. Yeh patterns market ki sentiment ko zahir karte hain aur traders ko entry ya exit points identify karne mein madad dete hain. Kuch mashhoor patterns mein doji, hammer, aur engulfing pattern shamil hain. Har pattern ki apni significance hai, jo market ki mood ko batati hai.
                            Support Aur Resistance Levels


                            Support aur resistance levels price action trading ke liye buniyadi concepts hain. Support level wo price hai jahan demand zyada hoti hai, jabke resistance level wo price hai jahan supply zyada hoti hai. In levels ko samajhna traders ko trade decisions lene mein madad karta hai, jaise buy ya sell signals.
                            Trend Lines


                            Trend lines market ki price direction ko samajhne ka behtareen tareeqa hain. Trend lines ko draw karke traders dekh sakte hain ke market bullish hai ya bearish. Agar price trend line ko torh deti hai, to yeh ek strong signal ho sakta hai market reversal ka.
                            Breakouts Aur Fakeouts


                            Breakouts tab hote hain jab price kisi support ya resistance level ko cross karti hai. Yeh ek trading opportunity ho sakti hai. Lekin, fakeouts bhi aksar hote hain jab price temporarily ek level ko cross karti hai phir wapas aa jati hai. Traders ko inhe identify karne ke liye price action indicators ka istemal karna chahiye.
                            Volume Analysis


                            Volume bhi price action trading mein ahmiyat rakhta hai. High volume price movements ko confirm kar sakta hai. Agar kisi breakout ke saath high volume hai, to yeh signal strong hai. Lekin low volume ke sath breakout ko trade karna risky ho sakta hai.
                            Market Sentiment


                            Market sentiment price action trading ka ek aur aham pehlu hai. Yeh samajhna zaroori hai ke market participants ka kya sochna hai. Jab sentiment bullish hota hai, to prices zyada badhte hain, jab bearish hota hai, to prices ghatte hain.
                            Time Frames


                            Price action indicators ko alag alag time frames par istemal kiya ja sakta hai. Traders choti time frames par quick trades kar sakte hain, jabke bade time frames par long-term trends ko analyze kar sakte hain. Har time frame ka apna importance hai aur traders ko apni strategy ke mutabiq inhe choose karna chahiye.
                            Risk Management


                            Price action trading mein risk management bohat zaroori hai. Traders ko apne losses ko control karne ke liye stop-loss orders ka istemal karna chahiye. Yeh unhein unexpected market movements se bacha sakta hai aur unke capital ko protect kar sakta hai.
                            Psychological Aspects


                            Trading sirf technical analysis nahi, balki psychological aspects bhi shamil hain. Fear aur greed traders ke decisions par bohat asar dalte hain. Price action trading mein traders ko apne emotions ko control karna seekhna hota hai, taake wo behtareen decisions le saken.
                            Practice Aur Experience


                            Jaise har trading style ke liye practice zaroori hai, waise hi price action trading ke liye bhi experience gain karna bohot ahm hai. Traders ko live market mein practice karna chahiye, taake wo price action ke patterns aur signals ko asan tareeqe se samajh saken.
                            Conclusion


                            Price action trading ek powerful technique hai jo traders ko market ke asli movements ko samajhne mein madad karti hai. Is technique ka istemal karke traders market ke trends, reversals, aur key levels ko asani se identify kar sakte hain. Yeh approach traditional indicators se behtar hai kyunki yeh market ki asli halat ko zahir karti hai. Price action indicators ko istemal karne ke liye aapko practice aur discipline ki zaroorat hai, lekin agar aap inhe sahi tareeqe se istemal karte hain, to aap apni trading performance ko behtar bana sakte hain.
                            • <a href="https://www.instaforex.org/ru/?x=ruforum">InstaForex</a>
                            • #15 Collapse

                              Price Action Indicator: Ek Mukammal Jaiza


                              1. Price Action Kya Hai?
                              Price action trading ek aisa tareeqa hai jismein trader sirf market ki price movement par focus karta hai, bina kisi technical indicator ke. Is ka maqsad price ki behavior ko samajhna aur usay use karte hue trading decisions lena hota hai. Traders jo price action ko istemal karte hain, wo market ki psychology aur price ke patterns ko analyse karte hain taake wo market ki next move ka andaza laga sakein.

                              2. Price Action Indicators Ka Ta'aruf
                              Price action indicators wo tools hain jo traders ko price movement ko behtar samajhne mein madad dete hain. Ye indicators chart par price ki historical movements ko dikhate hain aur help karte hain traders ko entry aur exit points identify karne mein. Price action indicators ko samajhna ek zaroori skill hai jo kisi bhi successful trader ke liye faida mand sabit ho sakti hai.

                              3. Price Action Indicators Ki Qismain
                              Price action indicators ki kai qismain hain, jin mein se kuch mashhoor indicators ye hain: candlestick patterns, support and resistance levels, trend lines, aur Fibonacci retracement. Har indicator ki apni ek khasiyat hai jo traders ko mukhtalif situations mein madad karti hai.

                              4. Candlestick Patterns
                              Candlestick patterns price action trading ka ek ahem hissa hain. Ye patterns traders ko price ki future movement ke baare mein ahm maloomat dete hain. Misal ke taur par, bullish engulfing pattern ek strong reversal signal hai, jab ke bearish engulfing pattern downtrend ki taraf ek strong signal hota hai. Candlestick patterns ko samajhna ek trader ke liye bahut zaroori hai kyun ke ye market ki emotions aur psychology ka izhar karte hain.

                              5. Support aur Resistance Levels
                              Support aur resistance levels price action indicators ka aik aur ahem hissa hain. Support level wo price point hai jahan demand zyada hoti hai aur price girne nahi paata, jabke resistance level wo price point hai jahan supply zyada hoti hai aur price upar nahi jaata. Ye levels market ke potential reversal points ko dikhate hain aur trading decisions mein madadgar hote hain.

                              6. Trend Lines
                              Trend lines bhi price action trading ke liye ek ahem tool hain. Ye lines market ki trend ko dikhati hain, chahe wo upward trend ho, downward trend ya lateral movement. Trend lines ke zariye traders price movement ka analysis karte hain aur future price movement ka andaza lagate hain.

                              7. Fibonacci Retracement
                              Fibonacci retracement levels bhi price action trading mein istamal hoti hain. Ye levels market ki price retracement ko dikhate hain, aur traders ko potential reversal points ka andaza lagane mein madad karte hain. Fibonacci levels ka istemal karte hue traders apne entry aur exit points ko behtar tarike se plan kar sakte hain.

                              8. Volume Analysis
                              Volume analysis bhi price action indicators ka hissa hai. Volume se yeh pata chalta hai ke kisi particular price movement ke peeche kitni activity hai. Jab volume zyada hota hai, toh is ka matlab hai ke traders ka interest zyada hai aur price movement ki sustainability bhi zyada hoti hai.

                              9. Price Action Strategy Tayar Karna
                              Price action trading strategy tayyar karne ke liye pehle traders ko price action indicators ko samajhna hoga. Strategy tayyar karte waqt traders ko entry aur exit points, stop-loss aur risk management ko zaroor madde nazar rakhna chahiye. Achi strategy wo hoti hai jo traders ko market ki movement ka accurate analysis karne mein madad kare.

                              10. Backtesting Aur Demo Trading
                              Price action trading seekhne ke liye backtesting aur demo trading bahut zaroori hai. Backtesting mein traders apni strategies ko historical data par test karte hain taake yeh jaan sakein ke wo kitni effective hain. Demo trading se traders ko real market conditions mein practice karne ka mauka milta hai bina kisi financial risk ke.

                              11. Trading Psychology
                              Trading psychology bhi price action trading ka ek important hissa hai. Traders ko apne emotions ko control karna hota hai, kyunki fear aur greed trading decisions ko negatively impact kar sakte hain. Price action trading mein discipline aur patience zaroori hain.

                              12. Market Conditions Ka Samajhna
                              Market conditions ko samajhna bhi price action trading mein ahem hai. Different market conditions, jaise trending market, ranging market, ya volatile market, traders ko alag alag trading strategies apply karne ki zaroorat hoti hai. Isliye market ki halat ko samajhna aur us ke mutabiq strategy tayyar karna zaroori hai.

                              13. Price Action Trading Ki Faida Aur Nuqsan
                              Price action trading ke kuch faida hain, jaise ke simplicity, asan analysis, aur indicators par dependency na hone ki wajah se. Lekin is ke kuch nuqsan bhi hain, jaise ke high volatility ke doran risk, jo price movements ko unpredictable bana sakta hai.

                              14. Conclusion
                              Aakhir mein, price action trading ek effective tareeqa hai jo traders ko market ki price movements ko samajhne aur us ke mutabiq decisions lene mein madad karta hai. Price action indicators ko samajhna aur unka istemal karna trading mein success ka ek ahem hissa hai. Har trader ko yeh samajhna chahiye ke effective trading ke liye sirf indicators nahi, balki market psychology aur risk management bhi zaroori hai. Price action trading ko seekhne aur practice karne se traders apne trading results ko behtar kar sakte hain aur market mein apni position ko mazid mazboot kar sakte hain.

                              اب آن لائن

                              Working...
                              X