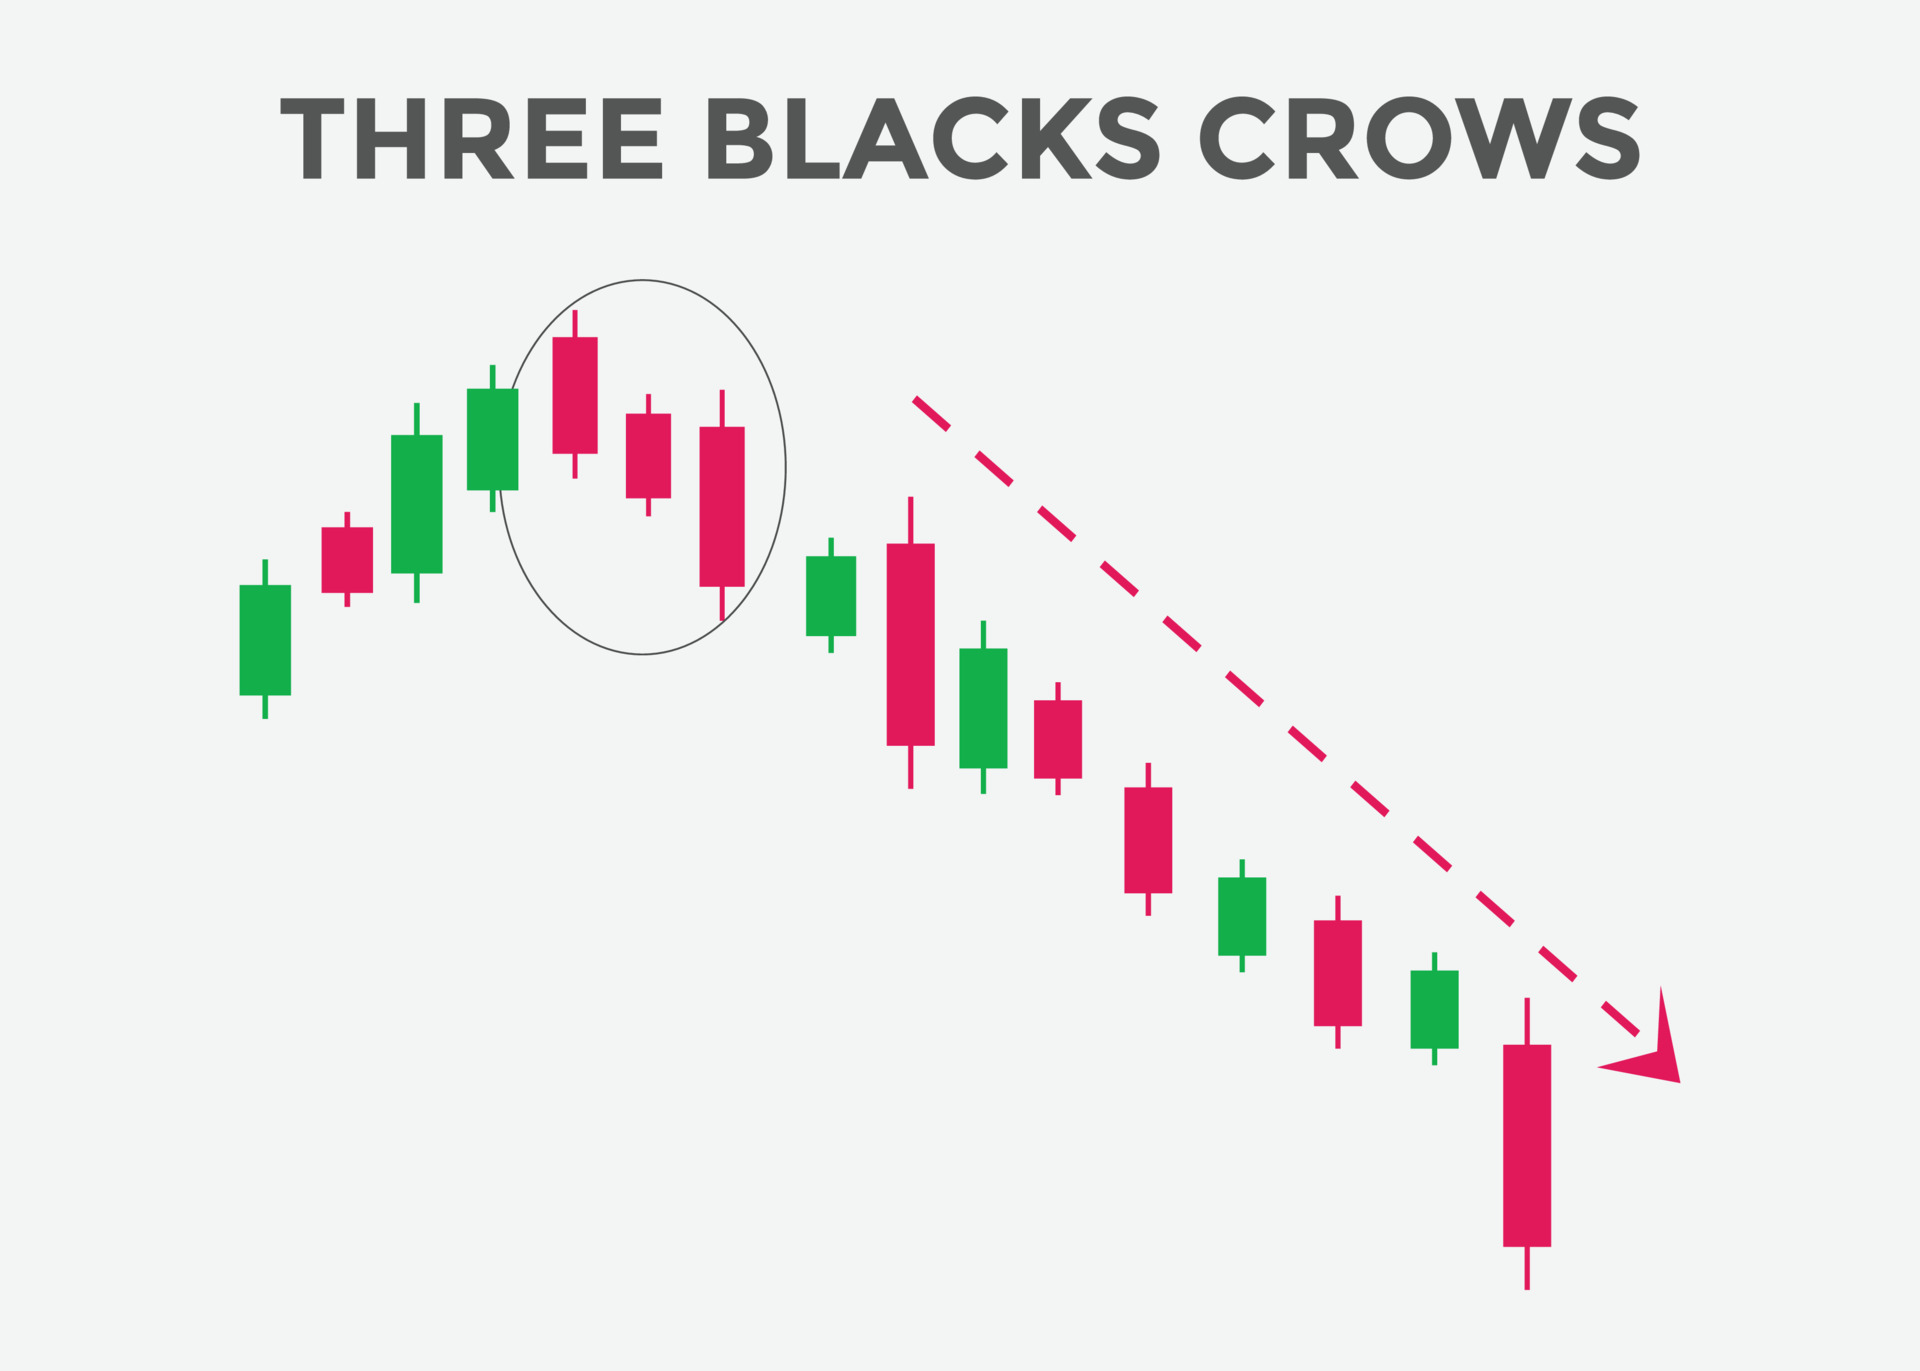
Three Black Crows Candlestick Pattern

No announcement yet.
`
X
  • وقت
  • دکھائیں
Clear All
new posts
  • #1 Collapse

    Three Black Crows Candlestick Pattern


    Taaruf


    Three Black Crows candlestick pattern ek bearish reversal pattern hai jo aksar market ki bullish trend ke baad dekha jata hai. Ye pattern teen consecutive black (ya red) candlesticks par mashoor hai, jo ke market ki tension aur investors ke bearish jazbat ka izhar karti hai. Is pattern ka samajhna trade ke liye bohot zaroori hai, khaas kar un logo kay liye jo technical analysis main maharat rakhte hain.
    Pattern ki Pehchaan


    Three Black Crows pattern ki pehchaan us waqt ki jaati hai jab teen consecutive candlesticks market ke niche ki taraf band hoti hain, aur har ek candlestick pichli candlestick ki closing se neeche band hoti hai. Har candlestick ka body bada aur shadow chhota hota hai, jo market ki selling pressure ko dikhata hai.
    Candlestick ki Takhleeq
    1. Pehli Candlestick: Ye bullish trend ka last candlestick hota hai jo ke market ki taqat ko bayan karta hai.
    2. Dusi Candlestick: Ye pehli candlestick se neeche banta hai aur bearish closing dikhata hai.
    3. Teesri Candlestick: Ye dusri candlestick se bhi neeche band hota hai, jo ke continuation ko darshata hai.
    Fawaid

    1. Behtar Trading Signals


    Three Black Crows pattern traders ko behtar signals faraham karti hai ke market bearish ho raha hai. Ye pattern jab dekha jata hai to ye logon ko ye jaag rahi hoti hai ke wo apne positions ko manage karein ya profit booking karein.
    2. Kharidari Ka Fursat


    Jab ye pattern achey tarikon se confirm ho jata hai, toh traders ko short selling ya derivatives trading mein fursat mil sakti hai. Is se wo market ke girne ka faida uthate hain.
    3. Portfolio Management


    Ye pattern portfolio management mein madadgar hoti hai. Agar koi trader bullish positions rakhta hai, toh ye pattern unhain is taraf ishara karta hai ke wo apne investment ko manage karein aur market ke bearish trend ka faida uthayen.
    Nuqsan

    1. Fake Signals


    Kabhi kabar, ye pattern fake signals bhi de sakta hai. Agar market ki volatility zyada ho toh ye logo ko galat faislay tak le ja sakta hai. Isliye, always confirm this pattern with other indicators.
    2. Trade Timing ka Masla


    Is pattern ko samajhne ke liye accents bohot zaroori hain. Kabhi kabhi traders samaj nahi pate ke kab trade lena hai aur kab nahi, jo unhein ghalat entry ya exit points tak le ja sakta hai.
    3. Overconfidence


    Doosre traders ke liye, is pattern ka analysis karne par overconfidence aa jata hai, jo trading decisions ko affect karta hai. Wo samajhte hain ke wo hamesha is pattern se faida uthayenge, jo ek galat fehmi hoti hai.
    Analysis Aur Examples

    Example 1: Aksar Ka Tajarba


    Maanlein ke aapne market ko observe kiya hai aur ye pattern dekha. Ab aap is pattern ko samajh kar apne trading decisions ko badal sakte hain. Agar ye pattern aata hai, toh aap short selling ke liye entry kar sakte hain.
    Example 2: Indicator ke Sath


    Achi trading practice ye hai ke ye pattern ko kisi aur indicator, jaise moving averages ya RSI, ke sath istemal karein. Agar aap dekhte hain ke Three Black Crows pattern ke sath RSI bhi overbought hai, toh ye aur bhi zyada confirm hota hai ke market gir sakta hai.
    Real-life Example


    Bohot se traders ne 2020 ke financial crisis ke doran ye pattern dekha, jis se unhon ne behtar decisions liye aur losses ko avoid kiya. Ye pattern na sirf stocks, balki forex aur commodities mein bhi dekha gaya hai.
    Strategies for Entry and Exit

    Entry Strategy
    • Confirmation: Ye zaroori hai ke aap is pattern ka confirmation dekhein. Jaise hi teesri candlestick close hoti hai, agar volume high hai toh ye trade lene ke liye acha sahara hai.
    • Stop Loss: Kabhi kabar stop loss ko hamesha apne entry point se thoda upar rakhein, taake market agar wapas upar chala jaye toh aap ka loss limited rahe.
    Exit Strategy
    • Profit Booking: Agar aapne short position li hui hai aur market gir raha hai, toh profit booking ka time zaroori hota hai. Aksar traders is pattern ke baad profit lete hain jab market me choti rally hoti hai.
    • Trailing Stop Loss: Ye ek acha method hai jisse aap profit ko lock kar sakte hain. Agar market aapke favor mein ja raha hai, toh stop loss ko market price ke sath adjust karein.
    Conclusion


    Three Black Crows candlestick pattern ek helpful tool hai jo traders ko market ke bearish trend ke baare mein agah karta hai. Is pattern ka samajhna aur better trading strategies ko banana aapki trading success ko doom kar sakta hai. Lekin, ye bhi zaroori hai ke aap sahi confirmation aur risk management strategies ka istemal karein.
  • <a href="https://www.instaforex.org/ru/?x=ruforum">InstaForex</a>
  • #2 Collapse

    Three Black Crows Candlestick Pattern


    1. Introduction to Three Black Crows Pattern

    Three Black Crows candlestick pattern aik bearish reversal pattern hai jo market ke top pe develop hota hai. Ye pattern financial markets mein bearish trends ko predict karne ke liye use hota hai. Jab ek strong bullish trend ke baad market ka mood change hota hai, tab ye pattern ban sakta hai. Is pattern ke teeno candles black ya red color ki hoti hain, jo downward movement ko indicate karti hain.

    Is pattern ko samajhne ke liye, humein candlestick charts ki basic understanding honi chahiye. Candlestick charts market ki price movements ko visualize karne ke liye use kiye jate hain. Ye charts price action ko clear aur detailed form me dikhate hain, jo traders ko better decision-making me help karta hai. Three Black Crows pattern bhi inhi charts par develop hota hai aur bearish trend ka signal deta hai.

    Pattern ke formation ke dauran, market me strong bearish sentiment hota hai. Is pattern ka formation bullish trend ke end ke baad hota hai, jo traders ko market ki potential reversal ke baare me warn karta hai. Is pattern ke identification se traders ko timely action lene me madad milti hai, jo unke trading decisions ko improve kar sakti hai.

    Three Black Crows pattern ki identification ke liye, traders ko candlestick chart par in teeno black candles ko dekhna padta hai. Ye candles sequentially ek dusre se lower close hoti hain. Is pattern ko accurately identify karna zaroori hai taake market ki direction ko sahi se predict kiya ja sake. Pattern ke teeno candles ek high bearish momentum ko show karti hain jo market ke future direction ko impact kar sakti hai.

    Is pattern ki understanding se traders ko market ke behavior ko better samajhne me madad milti hai. Three Black Crows pattern ek important tool hai jo trading strategies me bearish signals ke liye use kiya jata hai. Ye pattern market ke potential trend reversals ko predict karne me ek valuable asset hai.

    2. Pattern Definition

    Three Black Crows pattern teen consecutive black candles se milkar banta hai, jinke close prices pichle candle se niche hote hain. Har candle ka open price high hota hai aur ye candles ek dusre ke niche close hoti hain. Ye pattern bearish market conditions ko signal karta hai aur traders ko potential downtrend ke baare me warn karta hai.

    Candlestick chart me, first black candle ek strong bearish momentum ko show karti hai. Second black candle ki opening price pehle candle ke close se slightly lower hoti hai aur ye candle bhi bearish hoti hai. Third black candle ki opening price bhi pichli candle se lower hoti hai aur ye bhi bearish closing show karti hai. Ye pattern sequentially bearish trend ko show karta hai.

    Is pattern ki definition ko samajhne ke liye, traders ko candles ke open, close, high, aur low prices ka analysis karna padta hai. Agar candles ke bodies bade hote hain aur shadows chhoti hoti hain, to ye pattern zyada reliable hota hai. Har candle ke close price ka pichli candle se lower hona pattern ki validity ko increase karta hai.

    Pattern ke formation ke dauran, market me high selling pressure hota hai jo bearish sentiment ko dikhata hai. Ye pattern investors aur traders ko market me selling pressure aur potential downtrend ke baare me inform karta hai. Is pattern ko accurately identify karke traders timely trading decisions le sakte hain.

    Pattern ke definition ke andar, har candle ki body aur shadow ka analysis zaroori hota hai. Is analysis se traders ko pattern ki accuracy aur reliability ka pata chal sakta hai. Three Black Crows pattern ko sahi se interpret karke, traders market ke potential downtrends ko accurately predict kar sakte hain.

    3. Pattern Formation

    Three Black Crows pattern ki formation tab hoti hai jab market me bullish trend ke baad three consecutive black candles create hoti hain. Har candle ka body pichli candle se chhota hota hai aur inka close price bhi lower hota hai. Pattern ke formation ke liye, market me strong bearish sentiment hona zaroori hai.

    Pattern ki formation ke dauran, pehli black candle ek strong bearish move ko show karti hai. Dusri black candle pehli candle ke close se thodi niche open hoti hai aur iski closing price bhi lower hoti hai. Teesri black candle dusri candle ke close se bhi niche open hoti hai aur ye bhi bearish closing show karti hai. Is sequence me teeno candles bearish trend ko indicate karti hain.

    Is pattern ki formation ko identify karna market ke technical analysis ke liye important hota hai. Traders ko pattern ke teeno candles ke open, close, high, aur low prices ka observation karna padta hai. Har candle ki body aur shadow pattern ke formation ko validate karti hai.

    Pattern formation ke dauran market me selling pressure ka increase hona zaroori hai. Ye pressure pattern ke validity ko confirm karta hai aur bearish trend ke continuation ko signal karta hai. Pattern ke formation ke baad agar market me further decline dekha jata hai, to pattern ka signal strong hota hai.

    Pattern ke formation ko samajhne ke liye, historical charts aur case studies ka analysis bhi useful hota hai. Is analysis se traders ko pattern ki effectiveness aur reliability ka idea milta hai. Pattern formation ke accurate identification se traders timely trading decisions le sakte hain.

    4. Ideal Characteristics

    Ideal Three Black Crows pattern me, har candle ka open aur close price previous candle se lower hota hai. Candles ka body bada hota hai aur shadow chhoti hoti hai, jo bearish trend ke confirmation ko indicate karta hai. Ideal pattern ki identification ke liye, in characteristics ka observation zaroori hota hai.

    Pehli candle ka body strong aur bearish hota hai. Dusri candle ka open price pehli candle ke close se thoda lower hota hai aur iski body bhi bearish hoti hai. Teesri candle ka open price dusri candle ke close se bhi lower hota hai aur iski body bhi large aur bearish hoti hai. Ye characteristics pattern ko ideal banate hain.

    Candles ka body bada hona aur shadow ka chhota hona bearish trend ke strong momentum ko indicate karta hai. Ideal Three Black Crows pattern me teeno candles ki bodies large aur bearish hoti hain jo market me strong selling pressure ko show karti hain. Ye characteristics pattern ke reliability ko increase karti hain.

    Pattern ki ideal characteristics ko samajhne ke liye, traders ko candlestick charts ka detailed analysis karna padta hai. Patterns ke open, close, high, aur low prices ka observation karna zaroori hota hai. Is analysis se traders ko pattern ki accuracy aur effectiveness ka idea milta hai.

    Ideal characteristics ki identification se traders ko pattern ki validity aur market ke potential direction ke baare me clear understanding milti hai. Ye understanding trading decisions ko improve karne me madad karti hai. Three Black Crows pattern ke ideal characteristics ko samajhne se traders effective trading strategies develop kar sakte hain.

    5. Significance of the Pattern

    Three Black Crows pattern bearish market reversal ko signal karta hai. Ye pattern traders ko suggest karta hai ke bullish trend khatam ho raha hai aur market niche ki taraf move kar sakti hai. Pattern ki significance ko samajhne ke liye, market trends aur historical performance ka analysis zaroori hota hai.

    Pattern ki significance market me strong bearish sentiment ke formation ko show karti hai. Jab ye pattern develop hota hai, to ye market me selling pressure ke increase ko indicate karta hai. Traders is pattern ko use karke potential downtrend ke baare me informed decisions le sakte hain.

    Pattern ki significance ko evaluate karne ke liye, historical charts aur case studies ka analysis kiya jata hai. Is analysis se pattern ke accuracy aur reliability ka assessment kiya jata hai. Agar pattern ke baad market me further decline dekha jata hai, to pattern ka signal zyada strong hota hai.

    Pattern ke significance ko confirm karne ke liye, complementary indicators ka use bhi kiya jata hai. Moving averages, RSI, aur MACD jese indicators pattern ke signal ko validate karte hain. Is confirmation se traders ko market ke potential downtrend ke baare me accurate information milti hai.

    Three Black Crows pattern ki significance trading strategies me bearish signals ke liye use hoti hai. Is pattern ko identify karke traders timely action le sakte hain aur profitable trading opportunities ko grab kar sakte hain. Pattern ke significance ki understanding se traders market ke behavior ko better samajh sakte hain.

    6. Pattern Analysis

    Pattern ki analysis ke liye, traders ko candles ke open, close, high, aur low prices ka analysis karna padta hai. Agar candles ka body bada hai aur shadow chhoti hai, to pattern zyada reliable hota hai. Analysis se pattern ke validity aur reliability ka pata chalta hai.

    Pehli candle ke close price ke comparison me, dusri candle ka open price lower hota hai aur ye bhi bearish hoti hai. Teesri candle ka open price dusri candle se lower hota hai aur ye bhi bearish hoti hai. In candles ki body aur shadow pattern ke analysis me important role play karti hain.

    Pattern ke analysis ke dauran, market ke volume ka observation bhi kiya jata hai. Agar volume increase hota hai aur market me further decline dekha jata hai, to pattern ka signal strong hota hai. Volume ka increase pattern ke validity ko confirm karta hai aur bearish trend ke continuation ko indicate karta hai.

    Pattern analysis me, historical charts aur past performance ka study bhi zaroori hota hai. Is study se traders ko pattern ki effectiveness aur accuracy ka idea milta hai. Historical data ka review karke, traders dekh sakte hain ke Three Black Crows pattern ne past me kis tarah se market trends ko predict kiya hai. Is analysis se traders ko pattern ke strengths aur weaknesses ka pata chal sakta hai.

    Pattern analysis me complementary indicators ka bhi role hota hai. Moving averages, Relative Strength Index (RSI), aur MACD jese indicators pattern ki reliability ko confirm karne me madad karte hain. Agar ye indicators bhi bearish signals provide kar rahe hain, to pattern ka signal zyada strong hota hai.

    Traders ko pattern analysis ke dauran, market ki overall conditions ko bhi consider karna chahiye. Economic news, geopolitical events, aur other market factors pattern ke effectiveness ko impact kar sakte hain. In factors ka consideration traders ko market ke potential direction ko accurately predict karne me madad karta hai.

    7. Confirmation Signals

    Three Black Crows pattern ka confirmation signals ka wait kiya jata hai. Is pattern ke baad agar trading volume bhi increase hota hai aur market me further decline dekha jata hai, to pattern ka signal strong hota hai. Confirmation signals pattern ki accuracy aur reliability ko validate karte hain.

    Confirmation signals ke liye, traders ko market ki additional indicators aur tools ka use karna padta hai. Agar volume increase hota hai aur market me price action bearish rehti hai, to pattern ka signal zyada reliable hota hai. Ye confirmation signals pattern ke effectiveness ko enhance karte hain.

    Trading volume ke analysis se traders ko market me selling pressure ka indication milta hai. Agar volume pattern ke teeno candles ke dauran increase hota hai, to ye bearish sentiment ke strong confirmation ko indicate karta hai. Isse traders ko potential downtrend ke baare me clear understanding milti hai.

    Confirmation signals ka wait karna traders ko premature trades se bachata hai. Agar pattern ke baad additional bearish signals milte hain, to traders ko trade execution me cautious rehna chahiye. Confirmation ke baad trading decisions le kar, traders apne risk ko minimize kar sakte hain aur trading outcomes ko improve kar sakte hain.

    8. Trading Strategy

    Three Black Crows pattern ko trading strategy me incorporate karne ke liye, traders ko iske formation ke baad market ke movement ka observation karna chahiye. Pattern ke confirmation ke baad sell orders place karna behtar hota hai. Trading strategy ko implement karte waqt risk management aur market conditions ka dhyan rakha jana chahiye.

    Trading strategy me, pattern ke teeno candles ka observation zaroori hota hai. Pehli candle ke baad dusri aur teesri candle ki formation ko observe karke, traders market ke potential downtrend ka signal le sakte hain. Pattern ke formation ke baad market ki price action aur volume ka analysis bhi important hota hai.

    Risk management trading strategy ka integral part hai. Traders ko stop loss aur target levels ko set karna padta hai taake potential losses ko minimize kiya ja sake. Three Black Crows pattern ke sath stop loss ko pattern ke last candle ke high ke thoda upar place kiya jata hai. Isse sudden market reversal se bachne me madad milti hai.

    Trading strategy me, complementary indicators ka use bhi beneficial hota hai. Moving averages, RSI, aur MACD jese indicators pattern ke signals ko confirm karte hain aur trading decisions ko strengthen karte hain. In indicators ka use trading strategy ko more effective aur reliable banata hai.

    Traders ko market ke overall conditions aur news events ko bhi consider karna chahiye. Market ke macroeconomic factors aur geopolitical events trading strategy ko impact kar sakte hain. In factors ko analyze karke, traders apni strategy ko adjust kar sakte hain aur market ke potential movements ke liye prepare ho sakte hain.

    9. Stop Loss Placement

    Three Black Crows pattern ke sath stop loss placement bhi zaroori hai. Stop loss ko pattern ke last black candle ke high ke thoda upar place kiya jata hai taake sudden reversal se bach sakhein. Proper stop loss placement risk management me help karta hai aur losses ko minimize karta hai.

    Stop loss placement ke liye, pattern ke teeno candles ke high aur low prices ka analysis karna padta hai. Traders ko pattern ke formation ke dauran market ki volatility aur price action ko consider karna chahiye. Stop loss ko pattern ke last candle ke high ke upar place karke, traders market ke sudden reversals se bach sakte hain.

    Effective stop loss placement trading strategy ko more reliable banata hai. Agar market me unexpected reversal hota hai, to stop loss trade ko loss se bachata hai. Ye placement traders ko market ke potential risks ko manage karne me madad karta hai aur trading outcomes ko improve karta hai.

    Traders ko stop loss placement ke sath risk-reward ratio ko bhi consider karna chahiye. Stop loss aur target levels ke beech ka ratio traders ko trade ki profitability ka idea deta hai. Proper risk-reward ratio ko maintain karke, traders profitable trading opportunities ko maximize kar sakte hain.

    Stop loss placement me, historical data aur case studies ka analysis bhi useful hota hai. Is analysis se traders ko pattern ke effectiveness aur stop loss ke placement strategies ke baare me insights milti hain. Ye insights trading decisions ko enhance karte hain aur market ke potential movements ko better samajhne me madad karti hain.

    10. Risk Management

    Risk management Three Black Crows pattern ke sath trading me crucial hota hai. Proper risk-reward ratio aur trade size ko manage karna zaroori hai taake losses minimize ho sakein. Risk management strategies trading decisions ko more effective aur reliable banati hain.

    Risk management ke liye, traders ko stop loss aur target levels ko set karna padta hai. Ye levels market ke potential movements aur pattern ke signals ke basis par set kiye jate hain. Risk management strategies ko implement karke, traders apne trading outcomes ko optimize kar sakte hain aur losses ko minimize kar sakte hain.

    Trade size aur leverage ka management bhi risk management me important role play karta hai. Traders ko apni trade size ko manage karna chahiye taake potential losses manageable ho sakein. Leverage ka use karte waqt, traders ko market ki volatility aur risks ko consider karna chahiye.

    Risk management strategies ko continuously review aur adjust karna zaroori hota hai. Market conditions aur economic factors ke changes ko consider karke, traders apni strategies ko modify kar sakte hain. Effective risk management se traders market ke potential risks ko efficiently manage kar sakte hain.

    Risk management ke liye, historical data aur performance analysis ka bhi use kiya jata hai. Traders ko past performance aur risk management strategies ka review karke apne trading decisions ko enhance karna chahiye. Ye review traders ko market ke behavior aur risk factors ke baare me insights provide karta hai.

    11. Pattern Limitations

    Is pattern ki limitations bhi hain. Agar market me high volatility hai ya pattern ke baad quick reversal hota hai, to pattern ka signal accurate nahi ho sakta. Pattern ki limitations ko samajhna trading decisions ko better banane me madad karta hai.

    Pattern ki limitations ko identify karne ke liye, traders ko market ki volatility aur price action ka observation karna padta hai. Agar market me sudden movements aur high volatility hoti hai, to Three Black Crows pattern ka signal accurate nahi ho sakta. Is situation me, traders ko cautious trading decisions le kar market ke risks ko manage karna chahiye.

    Pattern ke limitations ko samajhne ke liye, complementary indicators aur tools ka use bhi beneficial hota hai. Agar indicators pattern ke signal ko confirm nahi kar rahe hain, to pattern ki reliability decrease ho sakti hai. Is analysis se traders ko market ke potential risks aur limitations ka idea milta hai.

    Pattern ki limitations ke baare me historical data aur case studies ka review bhi useful hota hai. Is review se traders ko pattern ke past performance aur accuracy ke baare me insights milti hain. Ye insights trading decisions ko enhance karne me madad karti hain aur market ke potential trends ko accurately predict karne me help karti hain.

    Pattern ke limitations ko consider karte waqt, traders ko market ke macroeconomic factors aur news events ko bhi analyze karna chahiye. In factors ke changes pattern ke effectiveness ko impact kar sakte hain. Traders ko in factors ko monitor karke apne trading decisions ko adjust karna chahiye.

    12. Complementary Indicators

    Three Black Crows pattern ka use complementary indicators ke sath kiya ja sakta hai. Moving averages, RSI, aur MACD jese indicators se confirmation milne par pattern ki reliability increase hoti hai. Complementary indicators pattern ke signals ko validate karne me madad karte hain.

    Moving averages pattern ke signals ko confirm karne ke liye use kiye jate hain. Agar moving averages bearish trend ko show kar rahe hain, to Three Black Crows pattern ke signal ki reliability increase hoti hai. Moving averages ka use market ke trend ko identify karne aur validate karne me helpful hota hai.

    Relative Strength Index (RSI) bhi pattern ke confirmation ke liye useful hota hai. Agar RSI overbought conditions ko indicate karta hai aur bearish reversal signals provide karta hai, to pattern ka signal strong hota hai. RSI market ke momentum aur strength ko analyze karne me madad karta hai.

    MACD indicator bhi pattern ke signals ko validate karne me use kiya jata hai. Agar MACD line bearish crossover show karti hai aur market me further decline ko indicate karti hai, to pattern ka signal zyada reliable hota hai. MACD indicator market ke momentum aur trend reversals ko identify karne me madad karta hai.

    Complementary indicators ka use trading decisions ko enhance karta hai. Indicators ke signals ko combine karke, traders market ke potential movements ko accurately predict kar sakte hain aur trading outcomes ko improve kar sakte hain. Is analysis se traders ko pattern ke effectiveness aur reliability ke baare me clear understanding milti hai.

    13. Historical Performance

    Three Black Crows pattern ke historical performance ka review karke traders ko pattern ke effectiveness aur accuracy ka idea milta hai. Historical performance analysis se traders pattern ke past trends aur outcomes ko analyze karke better trading decisions le sakte hain.

    Historical performance analysis me, traders ko past data ka review karna padta hai. Pattern ke teeno candles ki formation aur market ke subsequent movements ka observation karke, traders pattern ke reliability ke baare me insights gain kar sakte hain. Ye analysis traders ko pattern ke past performance aur accuracy ke baare me clear understanding provide karta hai.

    Historical data ke review ke sath, case studies aur examples ka use bhi beneficial hota hai. Case studies se traders ko pattern ke real-world applications aur outcomes ke baare me practical knowledge milti hai. Ye knowledge traders ko pattern ke effectiveness aur reliability ko analyze karne me help karti hai.

    Historical performance ko consider karte waqt, market ke macroeconomic factors aur news events ko bhi analyze karna chahiye. In factors ke changes pattern ke performance ko impact kar sakte hain. Traders ko market ke overall conditions ko consider karke pattern ke signals ko interpret karna chahiye.

    Historical performance analysis traders ko pattern ke strengths aur weaknesses ke baare me clear understanding provide karta hai. Is analysis se traders apne trading strategies ko improve kar sakte hain aur market ke potential trends ko accurately predict kar sakte hain.

    14. Conclusion

    Three Black Crows pattern ek strong bearish reversal pattern hai jo market me downtrend ke signals provide karta hai. Pattern ke teeno black candles ki formation aur subsequent market movements pattern ki effectiveness aur accuracy ko validate karte hain.

    Pattern ke formation ke baad, confirmation signals aur complementary indicators ka use trading decisions ko enhance karta hai. Stop loss placement aur risk management strategies pattern ke signals ko reliable aur effective banate hain. Historical performance analysis pattern ke effectiveness aur reliability ko assess karne me madad karta hai.

    Pattern ke limitations ko samajhna aur complementary indicators ka use trading strategy ko strengthen karte hain. Traders ko market ke macroeconomic factors aur news events ko consider karke apne trading decisions ko adjust karna chahiye. Effective trading strategies aur risk management se traders market ke potential trends ko accurately predict kar sakte hain.

    In insights aur strategies ko implement karke, traders Three Black Crows pattern ka effectively use kar sakte hain aur apne trading outcomes ko optimize kar sakte hain. Pattern ke signals ko validate karna aur market ke conditions ko analyze karna successful trading decisions me key role play karta hai.
    • #3 Collapse

      Three Black Crows Candlestick Pattern

      1. Taaruf Three Black Crows candlestick pattern ek ahem bearish reversal pattern hai jo technical analysis mein kaafi important hai. Yeh pattern tab nazar aata hai jab market mein ek bearish trend develop ho raha hota hai. Is pattern ko samajhna aur iski pehchaan karna traders ke liye zaroori hai, kyunki yeh unhe market ke future movements ke bare mein insights provide karta hai. Three Black Crows ka pattern tin consecutive black candlesticks se milkar banta hai, jo ek strong downtrend ko signal dete hain. Har candlestick ka body pichli candlestick ke body se chhota hota hai aur har ek candlestick ka closing price pichli candlestick se niche hota hai.

      Pattern ke formation ka waqt market ke behavior ko analyze karna zaroori hota hai. Agar yeh pattern market ke peak par ban raha hai, to iska matlab hai ke market ne apni uptrend ki strength kho di hai aur ab downward movement shuru hone wali hai. Is pattern ke formation ke baad, traders ko caution ki zaroorat hoti hai kyunki yeh signal hota hai ke market bearish ho sakta hai. Yeh pattern un logon ke liye particularly important hai jo swing trading ya position trading mein interested hote hain, kyunki is pattern ka accurate identification unhe better trading decisions lene mein madad karta hai.

      Three Black Crows pattern ke formation ke baad, traders ko market ki movement ko closely monitor karna chahiye. Yeh pattern tab tak valid hota hai jab tak tin consecutive black candlesticks clearly visible hain aur unka closing price ek dusre se niche hota hai. Agar is pattern ke formation ke dauran market mein volume bhi increase ho raha hai, to yeh pattern ki validity ko aur bhi strengthen karta hai. Is pattern ko samajhne se traders ko market ki direction aur potential reversals ke bare mein insights milte hain, jo unke trading strategies ko optimize karne mein madadgar hota hai.

      2. Pattern Ka Tashkeel Three Black Crows pattern ka tashkeel kaafi straightforward hai, lekin isko identify karna thoda challenging ho sakta hai agar market ki movement complex ho. Is pattern ka basic structure teen consecutive bearish candlesticks hota hai. Har candlestick ka body pichli candlestick ke body se chhota hota hai aur har ek candlestick ka closing price pichli candlestick se niche hota hai. Yeh pattern market ke downward trend ko confirm karta hai aur iske formation ke baad bearish trend ke continue hone ki possibility hoti hai.

      Pehli candlestick is pattern ka initial bearish move dikhati hai. Yeh candlestick market ke initial downturn ko represent karti hai aur iska body long aur solid hota hai. Doosri candlestick pehli candlestick ke niche close hoti hai aur iski body bhi comparatively long aur solid hoti hai. Teesri candlestick doosri candlestick ke niche close hoti hai aur iska body bhi long hota hai, jo ki pattern ke completion ko signify karta hai. Yeh pattern tab tak valid hota hai jab tak teen consecutive bearish candlesticks properly visible hain aur unka closing price consistently lower hai.

      Pattern ka tashkeel tab tak valid hai jab tak har candlestick ke body ka size consistent hai aur unki closing price har baar lower hoti hai. Agar pattern ke formation ke dauran kisi bhi candlestick ka body unusually small ya large ho, to yeh pattern ki validity ko affect kar sakta hai. Traders ko chahiye ke wo pattern ke tashkeel ko dhyan se observe karein aur ensure karein ke pattern properly formed hai, taake accurate trading decisions liye ja sakein.

      3. Pehli Candlestick Pehli candlestick is pattern ka initial bearish move ko dikhati hai. Yeh candlestick market ke peak par ban sakti hai, jahan se downward movement ka trend start hota hai. Is candlestick ka opening price high hota hai aur closing price significantly low hoti hai, jo market ke bearish sentiment ko indicate karta hai. Yeh candlestick market ke previous uptrend ko end kar deti hai aur downward movement ke start hone ka signal deti hai.

      Pehli candlestick ki length aur body ka size bhi pattern ke validity ko affect karte hain. Agar pehli candlestick ka body long hai aur iski shadow minimal hai, to yeh bearish trend ki strength ko highlight karta hai. Is candlestick ke formation ke baad, traders ko chahiye ke wo market ke movement ko closely monitor karein aur ensure karein ke market bearish trend ko continue kar raha hai.

      Pehli candlestick ke formation ke baad, traders ko yeh dekhna chahiye ke market ka momentum kitna strong hai. Agar market ke volume bhi increase ho raha hai, to yeh pattern ke bearish trend ko support karta hai. Pehli candlestick ke analysis ke baad, traders ko second candlestick ke formation ke liye prepare rehna chahiye aur ensure karein ke pattern correctly form ho raha hai.

      4. Doosri Candlestick Doosri candlestick pehli candlestick ke niche close hoti hai aur iski body bhi relatively long aur solid hoti hai. Yeh candlestick market ke continued bearish trend ko represent karti hai aur iski closing price pehli candlestick ke closing se niche hoti hai. Is candlestick ke formation ke baad, traders ko bearish trend ke continuation ki confirmation milti hai.

      Doosri candlestick ki length aur body ka size bhi bearish trend ke strength ko determine karta hai. Agar doosri candlestick ka body pehli candlestick ke body se chhota hai lekin still bearish hai, to yeh market ke downward momentum ko maintain kar raha hai. Traders ko is candlestick ke formation ke dauran market ke volume ko bhi monitor karna chahiye, kyunki volume ka increase pattern ke bearish trend ko support karta hai.

      Doosri candlestick ke analysis ke baad, traders ko teesi candlestick ke formation ka intezaar karna chahiye. Agar doosri candlestick ke formation ke baad bhi market mein bearish momentum continue hota hai, to pattern ke valid hone ki possibility zyada hoti hai. Traders ko ensure karna chahiye ke doosri candlestick clearly visible ho aur uski closing price pehli candlestick se niche ho.

      5. Teesri Candlestick Teesri candlestick pattern ke completion ko signify karti hai aur iski closing price doosri candlestick ke closing price se niche hoti hai. Yeh candlestick market ke downward trend ko confirm karti hai aur traders ko bearish position open karne ka signal deti hai. Teesri candlestick ka body bhi long aur solid hota hai, jo pattern ke bearish strength ko highlight karta hai.

      Teesri candlestick ki formation ke baad, traders ko chahiye ke wo market ke movement ko closely observe karein aur pattern ke signals ko interpret karein. Agar teesri candlestick ke formation ke dauran market mein volume bhi increase ho raha hai, to yeh pattern ki validity ko aur bhi strengthen karta hai. Traders ko is candlestick ke formation ke baad apni trading strategy ko adjust karna chahiye aur bearish positions ko open karna chahiye.

      Teesri candlestick ke closing price pehli aur doosri candlestick se niche hoti hai, jo pattern ke bearish trend ko confirm karta hai. Agar teesri candlestick ke formation ke baad bhi market bearish trend ko continue karta hai, to traders ko pattern ke signals ko follow karna chahiye. Pattern ke successful formation ke baad, traders ko apni positions ko monitor karna chahiye aur market ke movements ke according adjust karna chahiye.

      6. Pattern Ka Ahmiyat Three Black Crows pattern market ke bearish trend ko confirm karta hai aur traders ko downward movement ke signals provide karta hai. Yeh pattern unke liye particularly useful hota hai jo long positions mein hain aur bearish reversal ki anticipation kar rahe hain. Is pattern ki pehchaan se traders ko market ki direction aur potential reversals ke bare mein insights milti hain.

      Pattern ke formation ke baad, traders ko market ke bearish trend ko continue hone ke signals ko dekhna chahiye. Agar market pattern ke signals ko follow karta hai, to yeh traders ko opportunity provide karta hai ke woh apni positions ko adjust kar saken aur better trading decisions le saken. Pattern ka ahmiyat tab zyada hota hai jab yeh market ke peak par form hota hai, kyunki yeh market ke reversal ke signals provide karta hai.

      Is pattern ki ahmiyat ko samajhne ke liye traders ko market ke volume aur other indicators ko bhi analyze karna chahiye. Agar volume pattern ke bearish signals ko support karta hai, to yeh pattern ke validity ko aur bhi strengthen karta hai. Traders ko pattern ke analysis ke baad apni trading strategies ko adjust karna chahiye aur bearish positions open karni chahiye.

      7. Pattern Ka Faiyda Three Black Crows pattern traders ko bearish trend ke signals provide karta hai, jo unhe better trading decisions lene mein madad karta hai. Is pattern ke faida yeh hai ke yeh traders ko market ke potential reversals aur downward movements ke signals deta hai. Yeh pattern unke liye particularly useful hota hai jo swing trading ya position trading mein interested hote hain.

      Pattern ka faida yeh hai ke yeh traders ko early warning deta hai ke market bearish ho sakta hai. Is pattern ke formation ke baad, traders ko opportunity milti hai ke woh apni positions ko adjust kar saken aur bearish trend se profit kama saken. Is pattern ke faida ko maximize karne ke liye traders ko market ke volume aur other indicators ko bhi analyze karna chahiye.

      Pattern ka faida tab zyada hota hai jab yeh market ke peak par form hota hai aur bearish trend ke signals provide karta hai. Traders ko pattern ke signals ko closely monitor karna chahiye aur market ke movements ke according apni trading strategies ko adjust karna chahiye. Is pattern ke faida ko samajhne ke liye traders ko practice aur experience ki zaroorat hoti hai.

      8. Entry Points Entry points identify karte waqt, traders usually teesri candlestick ke close hone ke baad short positions open karte hain. Yeh strategy bearish trend ko capture karne ke liye hoti hai aur traders ko downward movement se profit kamane ka mauka deti hai. Entry points ke selection ke waqt, traders ko pattern ke formation aur market ke behavior ko dhyan se dekhna chahiye.

      Teesri candlestick ke closing ke baad short position open karna ek common strategy hai, lekin traders ko apne risk management strategies ko bhi consider karna chahiye. Stop loss aur take profit levels ko set karna zaroori hai, taake market ke fluctuations se bacha ja sake aur maximum profit hasil kiya ja sake. Entry points ke selection ke waqt, traders ko pattern ke signals aur market ke volume ko bhi analyze karna chahiye.

      Entry points ko accurately identify karne ke liye traders ko technical analysis tools aur indicators ka bhi istemaal karna chahiye. Agar market ke volume pattern ke bearish signals ko support karta hai, to yeh entry points ke accuracy ko enhance kar sakta hai. Traders ko apni trading strategies ko market ke conditions ke according adjust karna chahiye aur entry points ko carefully select karna chahiye.

      9. Stop Loss Ka Istemaal Stop loss ka istemaal karna traders ke liye zaroori hai, kyunki agar market pattern ke against move kare to loss se bacha ja sakta hai. Generally, stop loss ko pattern ke upar set kiya jata hai, jo pattern ki last candlestick ke high ke upar hota hai. Yeh stop loss level traders ko market ke unexpected movements se bacha sakta hai.

      Stop loss ke placement ka waqt, traders ko pattern ke formation aur market ke behavior ko consider karna chahiye. Agar market pattern ke against move kar raha hai, to stop loss level trigger hoga aur traders ko loss se bachne ka mauka milega. Stop loss ke proper placement se traders ko risk management mein madad milti hai aur capital ko protect kiya ja sakta hai.

      Stop loss ka istemaal karte waqt, traders ko apni risk tolerance aur trading strategy ko bhi consider karna chahiye. Agar traders ka risk tolerance high hai, to wo apni stop loss levels ko thoda door set kar sakte hain. Lekin, stop loss ko accurate placement ke liye technical analysis tools aur market conditions ka bhi istemaal karna chahiye.

      10. Volume Ka Role Volume ka role pattern ke confirmation aur accuracy ko determine karta hai. Agar pattern ke formation ke dauran volume increase hota hai, to yeh bearish trend ko support karta hai aur pattern ki validity ko strengthen karta hai. Volume ka analysis pattern ke signals ko validate karne mein madad karta hai.

      Volume ka role tab aur bhi significant hota hai jab pattern market ke peak par form hota hai. Agar volume high hai aur bearish trend ko support karta hai, to yeh pattern ke effectiveness ko enhance karta hai. Traders ko volume analysis ko pattern ke signals ke sath combine karna chahiye, taake accurate trading decisions liye ja saken.

      Volume ke low hone ki surat mein, pattern ki validity ko challenge kiya ja sakta hai. Agar volume pattern ke signals ko support nahi karta, to yeh bearish trend ke strength ko indicate kar sakta hai. Traders ko volume analysis ko pattern ke signals ke sath interpret karna chahiye aur market ke behavior ko dhyan se observe karna chahiye.

      11. Pattern Ke Limitations Three Black Crows pattern har waqt effective nahi hota aur kabhi-kabhi yeh false signals bhi de sakta hai. Market ki volatility aur other factors pattern ke effectiveness ko affect kar sakte hain. Traders ko pattern ke limitations ko samajhna zaroori hai aur dusre indicators aur tools ke sath combine karke analysis karna chahiye.

      Pattern ke limitations ko samajhne ke liye, traders ko market ke behavior aur volatility ko closely monitor karna chahiye. Agar market highly volatile hai aur pattern ke signals inconsistent hain, to yeh pattern ki validity ko affect kar sakta hai. Traders ko pattern ke signals ko carefully interpret karna chahiye aur accurate trading decisions lene ke liye dusre indicators ka istemaal karna chahiye.

      Pattern ke limitations ko address karne ke liye traders ko practice aur experience ki zaroorat hoti hai. Market conditions aur volatility ke hisaab se pattern ke effectiveness ko evaluate karna chahiye aur trading strategies ko adjust karna chahiye. Traders ko pattern ke limitations ko samajh kar apni trading strategies ko refine karna chahiye.

      12. Alternatives Agar Three Black Crows pattern nazar aata hai, to traders ko dusre technical indicators aur patterns ko bhi dekhna chahiye. RSI, MACD, aur Moving Averages jaise indicators pattern ke bearish signals ko support kar sakte hain aur trading decisions ko enhance kar sakte hain. Indicators ka combination pattern ke signals ko validate karne mein madad karta hai.

      Traders ko pattern ke sath dusre indicators ka istemaal karna chahiye taake accurate trading decisions liye ja saken. Indicators ki analysis pattern ke signals ko strengthen karti hai aur market ke movements ko better understand karne mein madad karti hai. Traders ko indicators aur pattern ke combination se apni trading strategies ko optimize karna chahiye.

      Pattern ke sath indicators ka istemaal karne se trading strategies ko refine kiya ja sakta hai aur better trading decisions liye ja sakte hain. Traders ko market conditions ke hisaab se indicators aur pattern ke signals ko combine karna chahiye aur apni trading strategies ko adjust karna chahiye. Indicators aur patterns ke combination se traders ko market ke accurate predictions aur insights milti hain.

      13. Conclusion Three Black Crows pattern ek effective bearish candlestick pattern hai jo market ke downward movements aur potential reversals ke signals provide karta hai. Is pattern ki accurate pehchaan aur analysis se traders ko better trading decisions lene mein madad milti hai. Pattern ke signals ko volume aur dusre indicators ke sath combine karke trading strategies ko enhance kiya ja sakta hai.

      Pattern ka accurate analysis traders ko bearish trends ke potential reversals ke signals deta hai aur unhe market ke movements ko better understand karne mein madad karta hai. Traders ko pattern ke formation ke baad market ke behavior ko closely monitor karna chahiye aur apni trading strategies ko adjust karna chahiye. Is pattern ke analysis ke sath practice aur experience se trading decisions ko optimize kiya ja sakta hai aur market ke accurate predictions kiye ja sakte hai.
      • #4 Collapse

        Three Black Crows Candlestick Pattern: Ek Mukammal Guide

        1. Ta'aruf: Three Black Crows Pattern

        Three Black Crows pattern ek ahem candlestick pattern hai jo technical analysis mein use hota hai. Yeh pattern market ke bearish sentiment ko darshata hai, jise traders market ki girawat ke possible scenario ke roop mein dekhte hain. Is pattern ka naam teen consecutive black (ya red) candlesticks se aaya hai jo bearish trend ko represent karte hain. Yeh pattern investors aur traders ko ek ahem signal deta hai ke market mein girawat ka momentum badh raha hai.

        Three Black Crows pattern ka formation tab hota hai jab market ek bullish trend se girne lagta hai. Is pattern ki pehchan ke liye zaroori hai ke teen consecutive candlesticks ki formation ko dekha jaye, jisme har candlestick ki closing price previous candlestick se neeche hoti hai. Yeh pattern especially tab dekha jata hai jab market already ek strong uptrend mein hota hai aur sudden shift ka signal dena chahte hain.

        Pattern ko identify karne ke liye traders ko har candlestick ke open aur close prices ko analyze karna padta hai. Jab yeh pattern complete hota hai, to iska matlab hota hai ke sellers market par control le rahe hain aur buying pressure kam hai. Yeh pattern traders ko short selling ke liye signal deta hai aur market me bearish trend ke continuation ki ummeed hoti hai.

        Is pattern ki significance market analysis mein tab hoti hai jab traders isse dusre technical indicators ke saath combine karte hain. Yeh pattern single signal ke taur par nahi dekha jata, balke iska combination overall market trend aur other indicators ke sath karna chahiye. Is pattern ki samajh market ki movement ko better predict karne mein madad karti hai aur trading decisions ko informed banati hai.

        2. Pattern Ka Structure

        Three Black Crows pattern ke structure ko samajhna zaroori hai. Is pattern mein teen consecutive black candlesticks hoti hain jo market ki bearish sentiment ko show karti hain. Har candlestick ka closing price previous candlestick se neeche hota hai aur open price previous candlestick ke high se upar hota hai. Yeh structure market ki girawat ko darshata hai aur sellers ki dominance ko highlight karta hai.

        Har candlestick ka body solid aur long hona chahiye, jo bearish market trend ko darshata hai. Candlestick ka body chhoti ya thin nahi honi chahiye, balke yeh clear signal dena chahiye ke market mein selling pressure dominant hai. Pattern ka structure tab clear hota hai jab teen consecutive candlesticks ka body ek dusre ke sath aligned ho aur overall bearish trend ko reflect kare.

        Yeh pattern tab form hota hai jab market mein ek strong uptrend ho aur phir sudden bearish reversal ka signal mile. Candlestick ka open price previous candlestick se higher hona chahiye aur close price lower hona chahiye. Yeh sequence bearish pressure ko indicate karta hai aur market ke downward movement ko show karta hai.

        Pattern ke structure ko samajhne ke baad, traders ko iske interpretation aur trading strategy ko bhi samajhna chahiye. Yeh pattern ek ahem signal hai lekin iska analysis dusre technical indicators aur market conditions ke sath karna chahiye. Is pattern ke structure ko accurately identify karne se market trends aur price movements ko better samjha ja sakta hai.

        3. Pattern Ka Interpretation

        Three Black Crows pattern ka interpretation market ke bearish sentiment ko samajhne mein madad karta hai. Jab yeh pattern form hota hai, to iska matlab hota hai ke market mein sellers ka dominance hai aur buying pressure kam ho raha hai. Is pattern ko bearish signal ke taur par dekha jata hai jo market ke downward trend ko darshata hai.

        Pattern ke interpretation ke liye zaroori hai ke traders market ke overall trend ko samjhein. Agar pattern ek strong uptrend ke baad form hota hai, to iska bearish signal zyada effective hota hai. Is pattern ka interpretation tab hota hai jab traders next day ke price movements ko monitor karte hain aur confirmation signal ko dekhte hain.

        Is pattern ke interpretation ke dauran, traders ko market ki volume aur other technical indicators ko bhi consider karna chahiye. High volume ke sath pattern ka formation bearish trend ko confirm kar sakta hai. Agar volume low hai, to pattern ki reliability kam ho sakti hai aur traders ko cautious approach rakhni chahiye.

        Pattern ke interpretation mein psychological factors bhi important hote hain. Traders ko market sentiment aur investor behavior ko samajhna chahiye. Jab market bearish sentiment ko reflect karta hai, to sellers market par control le lete hain aur buying pressure decrease hota hai. Yeh psychological aspect trading decisions ko influence karta hai aur market ki movement ko samajhne mein madad karta hai.

        4. Pattern Ka Formation

        Three Black Crows pattern ka formation ek clear bearish trend ko represent karta hai. Yeh pattern tab form hota hai jab market mein lagataar teen din tak girawat hoti hai. Har din ki candlestick ka close price previous din se lower hota hai aur open price previous candlestick ke high se upar hota hai.

        Pattern ke formation ko accurately identify karne ke liye traders ko candlestick chart ka detailed analysis karna padta hai. Har candlestick ke open aur close prices ko check karna zaroori hai aur ensure karna chahiye ke har candlestick ki body long aur solid ho. Yeh formation market ke downward momentum ko darshata hai aur bearish trend ko highlight karta hai.

        Pattern ke formation ke dauran, traders ko market ke overall trend aur volume ko bhi analyze karna chahiye. Agar pattern high volume ke sath form hota hai, to iska bearish signal zyada reliable hota hai. Volume market ke sentiment ko reflect karta hai aur pattern ki accuracy ko confirm karne mein madad karta hai.

        Pattern ka formation tab clear hota hai jab market mein previous uptrend ke baad sudden bearish reversal ka signal mile. Yeh pattern ek strong bearish signal hai jo traders ko short selling aur market ke downward movement ke liye prepare karta hai. Accurate formation ke liye pattern ko dusre technical indicators ke sath confirm karna zaroori hai.

        5. Signal Ki Tashreeh

        Three Black Crows pattern ka signal ek strong bearish trend ko indicate karta hai. Jab yeh pattern form hota hai, to iska matlab hota hai ke market mein selling pressure dominant hai aur buying interest kam ho raha hai. Yeh signal traders ko market ke girawat ke liye prepare karta hai aur short selling opportunities ko identify karne mein madad karta hai.

        Signal ki tashreeh ke liye, traders ko pattern ke formation aur confirmation signals ko samajhna zaroori hai. Pattern ke complete hone ke baad, traders ko next day ke price movements ko monitor karna chahiye aur confirmation signal ke liye dekhna chahiye. Agar next day ki candlestick bhi bearish closing ke sath hoti hai, to pattern ka signal strong hota hai.

        Signal ko interpret karne ke liye market ke overall trend aur volume ko bhi consider karna chahiye. High volume ke sath pattern ka formation aur signal ka confirmation bearish trend ko zyada reliable banata hai. Agar volume low hai, to signal ki reliability kam ho sakti hai aur traders ko cautious approach rakhni chahiye.

        Signal ki tashreeh ke dauran psychological factors bhi important hote hain. Market sentiment aur investor behavior ko samajhna zaroori hai. Jab market bearish signal ko reflect karta hai, to sellers ka dominance hota hai aur buying pressure decrease hota hai. Yeh psychological aspect trading decisions ko influence karta hai aur signal ki accuracy ko affect karta hai.

        6. Pattern Ki Pehchan

        Three Black Crows pattern ki pehchan ke liye traders ko specific candlestick formations ko dekhna padta hai. Is pattern mein teen consecutive black (ya red) candlesticks hoti hain, jismein har candlestick ki closing price previous candlestick se neeche hoti hai aur open price previous candlestick ke high se upar hota hai.

        Pattern ki pehchan ke liye candlestick chart ka detailed analysis zaroori hai. Traders ko har candlestick ke open aur close prices ko check karna chahiye aur ensure karna chahiye ke body long aur solid ho. Candlestick ke upper aur lower shadows ko bhi consider karna chahiye, lekin pattern ki accuracy ke liye body ki length aur alignment important hoti hai.

        Pattern ki pehchan mein traders ko market ke overall trend aur volume ko bhi dekhna chahiye. Agar pattern ek strong uptrend ke baad form hota hai aur high volume ke sath hota hai, to yeh pattern zyada reliable hota hai. Low volume aur chhoti candlesticks pattern ke reliability ko kam kar sakti hain.

        Pattern ki pehchan ke dauran traders ko psychological aspects aur market sentiment ko bhi samajhna chahiye. Market mein bearish sentiment aur sellers ka dominance pattern ke pehchan ko confirm karta hai. Traders ko pattern ke formation ke baad market ke reaction ko monitor karna chahiye aur trading decisions ko accordingly adjust karna chahiye.

        7. Confirmation Ki Zaroorat

        Three Black Crows pattern ke signal ki confirmation zaroori hoti hai taake pattern ki reliability ko verify kiya ja sake. Pattern ke complete hone ke baad, traders ko next day ke candlestick ke price movements ko monitor karna chahiye. Agar next day ki candlestick bhi bearish closing ke sath hoti hai, to pattern ka confirmation strong hota hai.

        Confirmation ke liye traders ko market ke volume aur other technical indicators ko bhi consider karna chahiye. High volume ke sath pattern ka formation aur confirmation bearish trend ko zyada reliable banata hai. Agar volume low hai, to pattern ki reliability kam ho sakti hai aur traders ko cautious approach rakhni chahiye.

        Pattern ke confirmation ke liye, traders ko support aur resistance levels ko bhi analyze karna chahiye. Agar pattern ke formation ke baad market support levels ko break karta hai, to bearish trend ke continuation ke chances zyada hote hain. Resistance levels ko break karne se market ke downward momentum ko confirm kiya ja sakta hai.

        Confirmation ke dauran traders ko market sentiment aur psychological factors ko bhi samajhna chahiye. Market ke reaction aur investor behavior pattern ke confirmation ko affect kar sakte hain. Traders ko pattern ke signal ko overall market trend aur other indicators ke sath match karna chahiye taake trading decisions zyada informed ho sakain.

        8. Risk Management

        Three Black Crows pattern ke saath effective risk management zaroori hai. Pattern ke signal ko use karte waqt traders ko stop-loss orders set karne chahiye taake unexpected market movements se bachaa ja sake. Stop-loss orders market ke sudden movements ke against protection provide karte hain aur losses ko minimize karte hain.

        Risk management ke liye, traders ko position sizing aur leverage ko bhi consider karna chahiye. Proper position sizing aur leverage ka use karne se risk ko manage kiya ja sakta hai aur potential losses ko control kiya ja sakta hai. Over-leveraging aur large positions risk ko badha sakte hain aur unexpected market movements se losses ka risk hota hai.

        Pattern ke signal ke saath risk management ke liye traders ko market ke volatility aur overall trend ko bhi analyze karna chahiye. Agar market volatility high hai, to risk management strategies ko adjust karna zaroori hota hai. High volatility market me risk management aur stop-loss orders ka implementation zyada important ho jata hai.

        Risk management ke dauran, traders ko psychological aspects aur market sentiment ko bhi consider karna chahiye. Emotional decisions aur over-trading risk management strategies ko affect kar sakte hain. Traders ko disciplined aur systematic approach rakhni chahiye taake risk management effective ho aur trading decisions informed ho.

        9. Entry Aur Exit Points

        Three Black Crows pattern ke signal ke baad entry aur exit points ko identify karna zaroori hota hai. Pattern ke complete hone ke baad entry points usually short selling ke liye hoti hain. Traders ko pattern ke signal ko consider karte hue market me entry points identify karne chahiye aur potential short selling opportunities ko evaluate karna chahiye.

        Exit points ko identify karne ke liye traders ko market ke overall trend aur additional indicators ko analyze karna chahiye. Traders ko stop-loss orders aur profit targets set karne chahiye taake market ke sudden movements ke against protection mil sake. Exit points ko market ke reaction aur pattern ke confirmation ke sath adjust karna zaroori hota hai.

        Entry aur exit points ko identify karte waqt, traders ko market ke support aur resistance levels ko bhi consider karna chahiye. Support levels ke break hone se bearish trend ke continuation ke chances zyada hote hain aur resistance levels ke break hone se market ke upward movement ko confirm kiya ja sakta hai.

        Traders ko entry aur exit points ke determination ke dauran psychological factors aur market sentiment ko bhi samajhna chahiye. Market ke reaction aur investor behavior trading decisions ko affect kar sakte hain. Traders ko disciplined aur systematic approach rakhni chahiye taake entry aur exit points effectively identify kiye ja sake.

        10. Practical Examples

        Practical examples ke zariye traders Three Black Crows pattern ko real market scenarios me samajh sakte hain. Yeh examples pattern ke effectiveness aur reliability ko illustrate karte hain aur market ke bearish trends ko identify karne mein madad karte hain. Examples ke zariye traders ko pattern ke formation aur signal ko better samajhne ka mauka milta hai.

        Example 1: Suppose ek stock ek strong uptrend mein hai aur phir suddenly teen consecutive black candlesticks form hoti hain. Is pattern ka formation bearish trend ko indicate karta hai aur traders ko short selling ke liye signal deta hai. Next day ki bearish closing se pattern ka confirmation milta hai aur market ke downward movement ke chances zyada hote hain.

        Example 2: Ek forex pair ek strong bullish trend ke baad teen consecutive black candlesticks form karta hai. Pattern ke formation ke baad traders ko market ke reaction aur volume ko monitor karna chahiye. Agar volume high hai aur pattern ka confirmation milta hai, to bearish trend ke continuation ke chances zyada hote hain aur short selling opportunities available hoti hain.

        Example 3: Ek commodity market ek strong uptrend ke baad teen consecutive black candlesticks form karta hai. Traders ko pattern ke formation ke baad stop-loss orders set karne chahiye aur profit targets determine karne chahiye. Market ke bearish trend ke continuation ke liye traders ko pattern ke signal aur confirmation ko closely monitor karna chahiye.

        Practical examples ke zariye traders ko pattern ke effectiveness aur real market scenarios me application samajhna chahiye. Yeh examples pattern ke formation aur signal ko validate karte hain aur trading decisions ko informed banate hain.

        11. Common Mistakes

        Three Black Crows pattern ke analysis ke dauran kuch common mistakes ho sakti hain jo traders ko avoid karni chahiye. Yeh mistakes pattern ke effectiveness ko affect kar sakti hain aur trading decisions ko impact kar sakti hain. Common mistakes ko samajhkar traders apne trading strategy ko improve kar sakte hain aur better results achieve kar sakte hain.

        Mistake 1: Pattern ko standalone signal ke taur par use karna. Traders ko Three Black Crows pattern ko dusre technical indicators ke sath combine karna chahiye taake overall market trend aur signal ki reliability ko verify kiya ja sake.

        Mistake 2: Pattern ke confirmation signal ko ignore karna. Traders ko pattern ke signal ke baad confirmation ke liye next day ke price movements ko monitor karna chahiye. Confirmation signal ke bina trading decisions unreliable ho sakti hain.

        Mistake 3: Market ke volume aur overall trend ko consider na karna. High volume aur market trend pattern ki reliability ko affect karte hain. Traders ko volume aur market trend ko bhi analyze karna chahiye taake accurate trading decisions le sakein.

        Mistake 4: Psychological factors aur market sentiment ko ignore karna. Market sentiment aur investor behavior pattern ke effectiveness ko impact karte hain. Traders ko psychological aspects aur market sentiment ko samajhna chahiye taake trading decisions zyada informed ho sakain.

        Mistake 5: Risk management strategies ko ignore karna. Effective risk management trading decisions ko protect karta hai aur potential losses ko minimize karta hai. Traders ko stop-loss orders aur proper position sizing ka use karna chahiye taake risk ko manage kiya ja sake.

        12. Alternative Patterns

        Three Black Crows pattern ke alternative patterns bhi hain jo bearish signals dete hain aur market ke downward trends ko indicate karte hain. In alternative patterns ka comparison Three Black Crows ke sath karke traders ko market trends aur trading strategies ko better samajhna chahiye.

        Alternative Pattern 1: Dark Cloud Cover - Yeh pattern bhi bearish trend ko indicate karta hai aur market ke upward trend ke baad form hota hai. Is pattern mein ek large white candlestick ke baad ek black candlestick hoti hai jo white candlestick ke high ke upar open hoti hai aur half ya zyada white candlestick ko cover karti hai.

        Alternative Pattern 2: Evening Star - Yeh pattern bhi bearish reversal signal ko indicate karta hai. Is pattern mein ek large white candlestick ke baad ek small candlestick hoti hai jo indecisive hoti hai aur phir ek large black candlestick hoti hai jo white candlestick ke half ya zyada ko cover karti hai.

        Alternative Pattern 3: Hanging Man - Yeh pattern bhi bearish trend ko indicate karta hai. Is pattern mein ek small body ke sath ek long lower shadow hoti hai aur yeh uptrend ke baad form hoti hai. Pattern ka signal bearish trend ke continuation ke liye hota hai.

        Alternative patterns ko samajhne ke baad, traders ko Three Black Crows pattern ke saath comparison karke market ke bearish signals aur trading strategies ko analyze karna chahiye. Yeh comparison traders ko different patterns ke effectiveness aur reliability ko evaluate karne mein madad karta hai.

        13. Conclusion

        Three Black Crows candlestick pattern ek important tool hai jo traders ko market ke bearish trends identify karne me madad karta hai. Yeh pattern market ke downward momentum ko reflect karta hai aur traders ko short selling opportunities ke liye signal deta hai. Lekin, is pattern ko effective tareeqe se use karne ke liye thorough analysis aur risk management zaroori hai.

        Traders ko pattern ke signal ko dusre technical indicators aur market conditions ke sath combine karna chahiye. Pattern ka formation aur confirmation ko analyze karna zaroori hai aur market ke volume aur sentiment ko bhi consider karna chahiye. Effective risk management aur disciplined approach ke sath pattern ko use karke traders apne trading decisions ko informed aur successful bana sakte hain.

        Three Black Crows pattern ka accurate analysis aur trading strategy market ke bearish trends ko identify karne mein madad karta hai aur trading decisions ko zyada effective aur profitable banata hai. Traders ko pattern ke saath caution aur proper planning ke sath approach karna chahiye taake unke trading decisions zyada informed aur successful ho sakain.
        • #5 Collapse

          1. Pehli Candlestick: Ye bullish trend ka last candlestick hota hai jo ke market ki taqat ko bayan karta hai.
          2. Dusi Candlestick: Ye pehli candlestick se neeche banta hai aur bearish closing dikhata hai.
          3. Teesri Candlestick: Ye dusri candlestick se bhi neeche band hota hai, jo ke continuation ko darshata hai.
          Fawaid

          1. Behtar Trading Signals


          Three Black Crows pattern traders ko behtar signals faraham karti hai ke market bearish ho raha hai. Ye pattern jab dekha jata hai to ye logon ko ye jaag rahi hoti hai ke wo apne positions ko manage karein ya profit booking karein.
          2. Kharidari Ka Fursat


          Jab ye pattern achey tarikon se confirm ho jata hai, toh traders ko short selling ya derivatives trading mein fursat mil sakti hai. Is se wo market ke girne ka faida uthate hain.
          3. Portfolio Management


          Ye pattern portfolio management mein madadgar hoti hai. Agar koi trader bullish positions rakhta hai, toh ye pattern unhain is taraf ishara karta hai ke wo apne investment ko manage karein aur market ke bearish trend ka faida uthayen.
          Nuqsan

          1. Fake Signals


          Kabhi kabar, ye pattern fake signals bhi de sakta hai. Agar market ki volatility zyada ho toh ye logo ko galat faislay tak le ja sakta hai. Isliye, always confirm this pattern with other indicators.
          2. Trade Timing ka Masla


          Is pattern ko samajhne ke liye accents bohot zaroori hain. Kabhi kabhi traders samaj nahi pate ke kab trade lena hai aur kab nahi, jo unhein ghalat entry ya exit points tak le ja sakta hai.
          3. Overconfidence


          Doosre traders ke liye, is pattern ka analysis karne par overconfidence aa jata hai, jo trading decisions ko affect karta hai. Wo samajhte hain ke wo hamesha is pattern se faida uthayenge, jo ek galat fehmi hoti hai.
          Analysis Aur Examples

          Example 1: Aksar Ka Tajarba


          Maanlein ke aapne market ko observe kiya hai aur ye pattern dekha. Ab aap is pattern ko samajh kar apne trading decisions ko badal sakte hain. Agar ye pattern aata hai, toh aap short selling ke liye entry kar sakte hain.
          Example 2: Indicator ke Sath


          Achi trading practice ye hai ke ye pattern ko kisi aur indicator, jaise moving averages ya RSI, ke sath istemal karein. Agar aap dekhte hain ke Three Black Crows pattern ke sath RSI bhi overbought hai, toh ye aur bhi zyada confirm hota hai ke market gir sakta hai.
          Real-life Example


          Bohot se traders ne 2020 ke financial crisis ke doran ye pattern dekha, jis se unhon ne behtar decisions liye aur losses ko avoid kiya. Ye pattern na sirf stocks, balki forex aur commodities mein bhi dekha gaya hai.
          Strategies for Entry and Exit

          Entry Strategy
          • Confirmation: Ye zaroori hai ke aap is pattern ka confirmation dekhein. Jaise hi teesri candlestick close hoti hai, agar volume high hai toh ye trade lene ke liye acha sahara hai.
          • Stop Loss: Kabhi kabar stop loss ko hamesha apne entry point se thoda upar rakhein, taake market agar wapas upar chala jaye toh aap ka loss limited rahe.
          Exit Strategy
          • Profit Booking: Agar aapne short position li hui hai aur market gir raha hai, toh profit booking ka time zaroori hota hai. Aksar traders is pattern ke baad profit lete hain jab market me choti rally hoti hai.Pattern Ka Interpretation

            Three Black Crows pattern ka interpretation market ke bearish sentiment ko samajhne mein madad karta hai. Jab yeh pattern form hota hai, to iska matlab hota hai ke market mein sellers ka dominance hai aur buying pressure kam ho raha hai. Is pattern ko bearish signal ke taur par dekha jata hai jo market ke downward trend ko darshata hai.
            Pattern Ka Tashkeel Three Black Crows pattern ka tashkeel kaafi straightforward hai, lekin isko identify karna thoda challenging ho sakta hai agar market ki movement complex ho. Is pattern ka basic structure teen consecutive bearish candlesticks hota hai. Har candlestick ka body pichli candlestick ke body se chhota hota hai aur har ek candlestick ka closing price pichli candlestick se niche hota hai. Yeh pattern market ke downward trend ko confirm karta hai aur iske formation ke baad bearish trend ke continue hone ki possibility hoti hai.

            Pehli candlestick is pattern ka initial bearish move dikhati hai. Yeh candlestick market ke initial downturn ko represent karti hai aur iska body long aur solid hota hai. Doosri candlestick pehli candlestick ke niche close hoti hai aur iski body bhi comparatively long aur solid hoti hai. Teesri candlestick doosri candlestick ke niche close hoti hai aur iska body bhi long hota hai, jo ki pattern ke completion ko signify karta hai. Yeh pattern tab tak valid hota hai jab tak teen consecutive bearish candlesticks properly visible hain aur unka closing price consistently lower hai.

            Pattern ka tashkeel tab tak valid hai jab tak har candlestick ke body ka size consistent hai aur unki closing price har baar lower hoti hai. Agar pattern ke formation ke dauran kisi bhi candlestick ka body unusually small ya large ho, to yeh pattern ki validity ko affect kar sakta hai. Traders ko chahiye ke wo pattern ke tashkeel ko dhyan se observe karein aur ensure karein ke pattern properly formed hai, taake accurate trading decisions liye ja sakein.

            3. Pehli Candlestick Pehli candlestick is pattern ka initial bearish move ko dikhati hai. Yeh candlestick market ke peak par ban sakti hai, jahan se downward movement ka trend start hota hai. Is candlestick ka opening price high hota hai aur closing price significantly low hoti hai, jo market ke bearish sentiment ko indicate karta hai. Yeh candlestick market ke previous uptrend ko end kar deti hai aur downward movement ke start hone ka signal deti hai.

            Pehli candlestick ki length aur body ka size bhi pattern ke validity ko affect karte hain. Agar pehli candlestick ka body long hai aur iski shadow minimal hai, to yeh bearish trend ki strength ko highlight karta hai. Is candlestick ke formation ke baad, traders ko chahiye ke wo market ke movement ko closely monitor karein aur ensure karein ke market bearish trend ko continue kar raha hai.

            Pehli candlestick ke formation ke baad, traders ko yeh dekhna chahiye ke market ka momentum kitna strong hai. Agar market ke volume bhi increase ho raha hai, to yeh pattern ke bearish trend ko support karta hai. Pehli candlestick ke analysis ke baad, traders ko second candlestick ke formation ke liye prepare rehna chahiye aur ensure karein ke pattern correctly form ho raha hai.

            4. Doosri Candlestick Doosri candlestick pehli candlestick ke niche close hoti hai aur iski body bhi relatively long aur solid hoti hai. Yeh candlestick market ke continued bearish trend ko represent karti hai aur iski closing price pehli candlestick ke closing se niche hoti hai. Is candlestick ke formation ke baad, traders ko bearish trend ke continuation ki confirmation milti hai.

            Doosri candlestick ki length aur body ka size bhi bearish trend ke strength ko determine karta hai. Agar doosri candlestick ka body pehli candlestick ke body se chhota hai lekin still bearish hai, to yeh market ke downward momentum ko maintain kar raha hai. Traders ko is candlestick ke formation ke dauran market ke volume ko bhi monitor karna chahiye, kyunki volume ka increase pattern ke bearish trend ko support karta hai.

            Doosri candlestick ke analysis ke baad, traders ko teesi candlestick ke formation ka intezaar karna chahiye. Agar doosri candlestick ke formation ke baad bhi market mein bearish momentum continue hota hai, to pattern ke valid hone ki possibility zyada hoti hai. Traders ko ensure karna chahiye ke doosri candlestick clearly visible ho aur uski closing price pehli candlestick se niche ho.

            5. Teesri Candlestick Teesri candlestick pattern ke completion ko signify karti hai aur iski closing price doosri candlestick ke closing price se niche hoti hai. Yeh candlestick market ke downward trend ko confirm karti hai aur traders ko bearish position open karne ka signal deti hai. Teesri candlestick ka body bhi long aur solid hota hai, jo pattern ke bearish strength ko highlight karta hai.

            Teesri candlestick ki formation ke baad, traders ko chahiye ke wo market ke movement ko closely observe karein aur pattern ke signals ko interpret karein. Agar teesri candlestick ke formation ke dauran market mein volume bhi increase ho raha hai, to yeh pattern ki validity ko aur bhi strengthen karta hai. Traders ko is candlestick ke formation ke baad apni trading strategy ko adjust karna chahiye aur bearish positions ko open karna chahiye.

            Teesri candlestick ke closing price pehli aur doosri candlestick se niche hoti hai, jo pattern ke bearish trend ko confirm karta hai. Agar teesri candlestick ke formation ke baad bhi market bearish trend ko continue karta hai, to traders ko pattern ke signals ko follow karna chahiye. Pattern ke successful formation ke baad, traders ko apni positions ko monitor karna chahiye aur market ke movements ke according adjust karna chahiye.

            6. Pattern Ka Ahmiyat Three Black Crows pattern market ke bearish trend ko confirm karta hai aur traders ko downward movement ke signals provide karta hai. Yeh pattern unke liye particularly useful hota hai jo long positions mein hain aur bearish reversal ki anticipation kar rahe hain. Is pattern ki pehchaan se traders ko market ki direction aur potential reversals ke bare mein insights milti hain.

            Pattern ke formation ke baad, traders ko market ke bearish trend ko continue hone ke signals ko dekhna chahiye. Agar market pattern ke signals ko follow karta hai, to yeh traders ko opportunity provide karta hai ke woh apni positions ko adjust kar saken aur better trading decisions le saken. Pattern ka ahmiyat tab zyada hota hai jab yeh market ke peak par form hota hai, kyunki yeh market ke reversal ke signals provide karta hai.

            Is pattern ki ahmiyat ko samajhne ke liye traders ko market ke volume aur other indicators ko bhi analyze karna chahiye. Agar volume pattern ke bearish signals ko support karta hai, to yeh pattern ke validity ko aur bhi strengthen karta hai. Traders ko pattern ke analysis ke baad apni trading strategies ko adjust karna chahiye aur bearish positions open
            Pattern ke interpretation ke liye zaroori hai ke traders market ke overall trend ko samjhein. Agar pattern ek strong uptrend ke baad form hota hai, to iska bearish signal zyada effective hota hai. Is pattern ka interpretation tab hota hai jab traders next day ke price movements ko monitor karte hain aur confirmation signal ko dekhte hain.

            Is pattern ke interpretation ke dauran, traders ko market ki volume aur other technical indicators ko bhi consider karna chahiye. High volume ke sath pattern ka formation bearish trend ko confirm kar sakta hai. Agar volume low hai, to pattern ki reliability kam ho sakti hai aur traders ko cautious approach rakhni chahiye.

            Pattern ke interpretation mein psychological factors bhi important hote hain. Traders ko market sentiment aur investor behavior ko samajhna chahiye. Jab market bearish sentiment ko reflect karta hai, to sellers market par control le lete hain aur buying pressure decrease hota hai. Yeh psychological aspect trading decisions ko influence karta hai aur market ki movement ko samajhne mein madad karta hai.

            4. Pattern Ka Formation

            Three Black Crows pattern ka formation ek clear bearish trend ko represent karta hai. Yeh pattern tab form hota hai jab market mein lagataar teen din tak girawat hoti hai. Har din ki candlestick ka close price previous din se lower hota hai aur open price previous candlestick ke high se upar hota hai.

            Pattern ke formation ko accurately identify karne ke liye traders ko candlestick chart ka detailed analysis karna padta hai. Har candlestick ke open aur close prices ko check karna zaroori hai aur ensure karna chahiye ke har candlestick ki body long aur solid ho. Yeh formation market ke downward momentum ko darshata hai aur bearish trend ko highlight karta hai.

            Pattern ke formation ke dauran, traders ko market ke overall trend aur volume ko bhi analyze karna chahiye. Agar pattern high volume ke sath form hota hai, to iska bearish signal zyada reliable hota hai. Volume market ke sentiment ko reflect karta hai aur pattern ki accuracy ko confirm karne mein madad karta hai.

            Pattern ka formation tab clear hota hai jab market mein previous uptrend ke baad sudden bearish reversal ka signal mile. Yeh pattern ek strong bearish signal hai jo traders ko short selling aur market ke downward movement ke liye prepare karta hai. Accurate formation ke liye pattern ko dusre technical indicators ke sath confirm karna zaroori hai.

            5. Signal Ki Tashreeh

            Three Black Crows pattern ka signal ek strong bearish trend ko indicate karta hai. Jab yeh pattern form hota hai, to iska matlab hota hai ke market mein selling pressure dominant hai aur buying interest kam ho raha hai. Yeh signal traders ko market ke girawat ke liye prepare karta hai aur short selling opportunities ko identify karne mein madad karta hai.

            Signal ki tashreeh ke liye, traders ko pattern ke formation aur confirmation signals ko samajhna zaroori hai. Pattern ke complete hone ke baad, traders ko next day ke price movements ko monitor karna chahiye aur confirmation signal ke liye dekhna chahiye. Agar next day ki candlestick bhi bearish closing ke sath hoti hai, to pattern ka signal strong hota hai.

            Signal ko interpret karne ke liye market ke overall trend aur volume ko bhi consider karna chahiye. High volume ke sath pattern ka formation aur signal ka confirmation bearish trend ko zyada reliable banata hai. Agar volume low hai, to signal ki reliability kam ho sakti hai aur traders ko cautious approach rakhni chahiye.

            Signal ki tashreeh ke dauran psychological factors bhi important hote hain. Market sentiment aur investor behavior ko samajhna zaroori hai. Jab market bearish signal ko reflect karta hai, to sellers ka dominance hota hai aur buying pressure decrease hota hai. Yeh psychological aspect trading decisions ko influence karta hai aur signal ki accuracy ko affect karta hai.

            6. Pattern Ki Pehchan

            Three Black Crows pattern ki pehchan ke liye traders ko specific candlestick formations ko dekhna padta hai. Is pattern mein teen consecutive black (ya red) candlesticks hoti hain, jismein har candlestick ki closing price previous candlestick se neeche hoti hai aur open price previous candlestick ke high se upar hota hai.

            Pattern ki pehchan ke liye candlestick chart ka detailed analysis zaroori hai. Traders ko har candlestick ke open aur close prices ko check karna chahiye aur ensure karna chahiye ke body long aur solid ho. Candlestick ke upper aur lower shadows ko bhi consider karna chahiye, lekin pattern ki accuracy ke liye body ki length aur alignment important hoti hai.

            Pattern ki pehchan mein traders ko market ke overall trend aur volume ko bhi dekhna chahiye. Agar pattern ek strong uptrend ke baad form hota hai aur high volume ke sath hota hai, to yeh pattern zyada reliable hota hai. Low volume aur chhoti candlesticks pattern ke reliability ko kam kar sakti hain.

            Pattern ki pehchan ke dauran traders ko psychological aspects aur market sentiment ko bhi samajhna chahiye. Market mein bearish sentiment aur sellers ka dominance pattern ke pehchan ko confirm karta hai. Traders ko pattern ke formation ke baad market ke reaction ko monitor karna chahiye aur trading decisions ko accordingly adjust karna
          • Trailing Stop Loss: Ye ek acha method hai jisse aap profit ko lock kar sakte hain. Agar market aapke favor mein ja raha hai, toh stop loss ko market price
          • #6 Collapse

            Three Black Crows Candlestick Pattern: Ek Mukammal Jaiza

            1. Taaruf

            Three Black Crows ek aisa candlestick pattern hai jo technical analysis mein ek important role play karta hai. Ye pattern khas taur par bearish reversal ko indicate karta hai, jiska matlab hai ke market ke upar chadhai ka trend khatam ho raha hai aur niche girawat ka trend shuru ho raha hai. Is pattern ka pehla candle market ke upar chadhai ke trend ko dikhata hai, jab ke agle teen candles bearish rehti hain. Ye pattern traders ko market ki direction samajhne mein madad karta hai aur trading decisions lene mein guide karta hai.

            Ye pattern ka naam "Three Black Crows" is liye rakha gaya hai kyun ke ismein teen consecutive black (bearish) candles hoti hain jo ek jese rang ki hoti hain, jo ke ek crows ki tarah lagti hain. Is pattern ko identify karna market analysis ka ek fundamental hissa hai. Jab ye pattern market mein banta hai, to ye ek strong bearish signal hota hai, jisse traders ko sell trades ko consider karne ka signal milta hai.

            Is pattern ki pehchaan karke traders apne trading strategies ko adjust kar sakte hain aur risk management strategies ko implement kar sakte hain. Ye pattern long-term aur short-term traders dono ke liye useful hai, kyun ke iski understanding market ki short-term aur long-term trends ko analyze karne mein madad karti hai.

            Three Black Crows pattern ko market ke different scenarios mein use kiya ja sakta hai, jese ke stock markets, forex markets, aur commodities markets. Har market ki apni khasiyat hoti hai, lekin ye pattern unke trading behaviors aur trends ko samajhne mein madad karta hai. Isliye, is pattern ka knowledge har trader ke liye zaroori hai.

            In short, Three Black Crows ek aisa tool hai jo market ke bearish reversals ko identify karne mein madad karta hai aur traders ko informed decisions lene mein guide karta hai. Iska use karke traders apne trading strategies ko optimize kar sakte hain aur market movements ko accurately predict kar sakte hain.

            2. Pattern Ki Shakal

            Three Black Crows pattern ka shape teen consecutive black candles se bana hota hai. Har candle ka open price peechli candle ke close price se kam hota hai aur close price bhi peechli candle ke close price se kam hota hai. Ye continuous bearish movement ko reflect karta hai aur market mein downward pressure ko dikhata hai.

            Pehla candle ek strong bullish trend ke baad aata hai aur iska close price market ke high level par hota hai. Dusra aur teesra candles bhi similar pattern follow karte hain, jisme har candle ka open aur close price peechle candle se kam hota hai. Is pattern mein gap nahi hota aur har candle ke beech ka gap chhota hota hai, jo ke market ke strong bearish trend ko indicate karta hai.

            Is pattern ko samajhne ke liye candles ki formation aur unki positions ko dekhna zaroori hai. Agar candles ki formation sahi hai aur pattern complete hota hai, to ye pattern market ke reversal ka strong signal hota hai. Traders ko is pattern ko market charts par identify karna aana chahiye taake wo timely trades execute kar sakein.

            Three Black Crows pattern ka shape traders ko market ki sentiment aur trend ke baare mein information provide karta hai. Jab ye pattern ban jata hai, to market me selling pressure barh jata hai aur buyers ki dominance kam ho jati hai. Ye pattern market ke sentiment ko reflect karta hai aur traders ko bearish trades karne ka signal deta hai.

            Pattern ki shape aur formation ko analyze karke traders apne trading strategies ko optimize kar sakte hain aur market movements ko accurately predict kar sakte hain. Isliye, pattern ki shakal aur formation ko samajhna trading analysis ka ek important aspect hai.

            3. Formation

            Three Black Crows pattern ka formation ek specific sequence follow karta hai. Pehla candle ek uptrend ke baad hota hai, jisme price higher close hoti hai. Jab ye candle market me bullish trend ko indicate karta hai, to doosra candle aata hai jo ke pehle candle ke close price se lower open aur close price hota hai. Yeh bearish movement ko dikhata hai aur market me selling pressure barhata hai.

            Teesra candle bhi similar bearish formation ko follow karta hai, jisme iska open aur close price pehle candle ke close price se kam hota hai. Ye candle market ke continuous bearish trend ko reflect karta hai aur trend reversal ko confirm karta hai. Teen candles ki continuous bearish formation market me selling pressure ko confirm karti hai aur buyers ke control ko indicate karti hai.

            Is pattern ke formation mein gap nahi hona chahiye, yani ke har candle ka open price pehle candle ke close price ke nazdeek hona chahiye. Agar candles ke beech gap hota hai to pattern ki effectiveness kam ho sakti hai. Isliye, candles ke formation aur unki positioning ko closely monitor karna zaroori hai.

            Formation ke tamam steps complete hone ke baad, traders ko confirmation signals ki zaroorat hoti hai. Ye confirmation signals market ke volume increase aur price movements ke through milte hain. Agar ye confirmation signals milte hain to traders pattern ke bearish signal ko validate kar sakte hain aur trade decisions le sakte hain.

            Formation ke waqt pattern ki accuracy aur effectiveness ko ensure karna trading strategies ke success ke liye zaroori hai. Accurate formation ke sath hi, traders ko pattern ke bearish signal ko timely aur effectively use karna chahiye taake wo profitable trades execute kar sakein.

            4. Psychological Aspect

            Three Black Crows pattern market ke psychological aspect ko bhi reflect karta hai. Jab ye pattern banta hai, to ye signal deta hai ke market me buyers ka control kam ho raha hai aur sellers ki dominance barh rahi hai. Iska matlab hai ke market ke participants ka sentiment bearish ho raha hai aur selling pressure barh raha hai.

            Is pattern ka psychological impact traders aur investors ke decision-making process ko affect karta hai. Jab traders is pattern ko dekhte hain, to wo apne positions ko adjust karte hain aur bearish trades ko consider karte hain. Market ke participants ka sentiment aur behavior is pattern ke signal ko validate karta hai aur trading decisions ko influence karta hai.

            Market ke psychological aspect ko samajhne se traders ko pattern ke effectiveness aur market movements ko better understand karne mein madad milti hai. Ye understanding traders ko market ke trends aur sentiment ko accurately predict karne mein madad karti hai aur trading strategies ko optimize karne mein guide karti hai.

            Pattern ka psychological aspect trading decisions ke liye important hai, kyun ke ye market ke overall sentiment ko reflect karta hai. Jab pattern banta hai, to ye market ke participants ke behavior aur trading actions ko influence karta hai, jo ke pattern ke effectiveness aur trading strategies ke success ko impact karta hai.

            In short, Three Black Crows pattern ka psychological aspect market ke sentiment aur trading behavior ko reflect karta hai aur traders ko market movements ko accurately understand karne mein madad karta hai. Is aspect ko samajhkar traders apne trading strategies ko enhance kar sakte hain aur market trends ko better predict kar sakte hain.

            5. Confirmation

            Three Black Crows pattern ko effective trading tool banane ke liye confirmation signals ki zaroorat hoti hai. Pattern ke complete hone ke baad, traders ko market ke volume aur price movements ke through confirmation signals dekhne chahiye. Ye confirmation signals pattern ke bearish signal ko validate karte hain aur trading decisions ko guide karte hain.

            Confirmation signals ke liye volume increase ko dekhna zaroori hota hai. Jab volume barhta hai, to ye market ke strong bearish trend ko confirm karta hai aur pattern ke effectiveness ko validate karta hai. Volume ke sath pattern ki confirmation se traders ko market ke bearish trend ko accurately predict karne mein madad milti hai.

            Price movements bhi confirmation signals provide karte hain. Jab market ke prices continuously lower close hote hain, to ye pattern ke bearish signal ko reinforce karta hai aur trading decisions ko guide karta hai. Isliye, price movements aur volume ke analysis ko trading strategy ke sath integrate karna zaroori hai.

            Confirmation signals ke bina pattern ke effectiveness ko validate nahi kiya ja sakta aur false signals ka risk barh jata hai. Traders ko pattern ke completion ke baad confirmation signals ko closely monitor karna chahiye taake wo effective trading decisions le sakein aur profitable trades execute kar sakein.

            In short, Three Black Crows pattern ke effectiveness ko confirmation signals ke zariye validate kiya jata hai. Ye signals market ke volume aur price movements ke through milte hain aur trading decisions ko guide karte hain. Accurate confirmation signals se traders apne trading strategies ko optimize kar sakte hain aur market movements ko better predict kar sakte hain.

            6. Trading Strategy

            Three Black Crows pattern ko trading strategy mein incorporate karne ke liye specific steps follow kiye ja sakte hain. Pehla step pattern ki identification hai. Traders ko market charts par Three Black Crows pattern ko accurately identify karna chahiye aur pattern ke completion ka intezaar karna chahiye.

            Pattern ke complete hone ke baad, traders ko entry points ko identify karna chahiye. Entry points tab consider kiye ja sakte hain jab confirmation signals milte hain aur market ke bearish trend ko validate kiya jata hai. Traders short selling ya put options ka istemal karke market ke downward movement se fayda utha sakte hain.

            Risk management bhi trading strategy ka ek important aspect hai. Traders ko stop-loss orders set karne chahiye taake losses ko limit kiya ja sake. Stop-loss orders pattern ke bearish signal ke against market ke unexpected movements ko cover karte hain aur trading risks ko minimize karte hain.

            Trading strategy ko market ke conditions ke sath align karna zaroori hai. Market ki volatility aur other technical indicators ko bhi consider karna chahiye taake trading decisions zyada accurate ho sakain. Pattern ke signals ko other indicators ke sath integrate karke traders apne trading strategies ko enhance kar sakte hain.

            In short, Three Black Crows pattern ko trading strategy mein incorporate karne ke liye pattern ki identification, entry points, risk management, aur market conditions ko consider karna zaroori hai. Is approach se traders apne trading decisions ko optimize kar sakte hain aur market ke bearish trend se fayda utha sakte hain.

            7. Risk Management

            Three Black Crows pattern ko trade karte waqt risk management bahut important hota hai. Risk management ke bina trading strategies ineffective ho sakti hain aur traders ko significant losses ka samna karna pad sakta hai. Isliye, effective risk management strategies ko implement karna zaroori hai.

            Pehla step stop-loss orders set karna hai. Stop-loss orders ko pattern ke bearish signal ke against market movements ke liye set karna chahiye. Ye orders losses ko limit karte hain aur trading risks ko minimize karte hain. Stop-loss levels ko market conditions aur pattern ke signals ke sath align karke set karna chahiye.

            Dusra step position sizing hai. Traders ko apne positions ko market ke risk aur volatility ke according size karna chahiye. Large positions risk ko barhate hain aur losses ko increase kar sakte hain, isliye position sizing ko carefully manage karna zaroori hai.

            Tisra step trading plan aur discipline hai. Traders ko ek clear trading plan banani chahiye aur us plan ke sath stick karna chahiye. Trading plan ko market conditions aur pattern ke signals ke sath align karna chahiye aur trading decisions ko disciplined manner mein execute karna chahiye.

            Risk management strategies ko trading strategies ke sath integrate karke traders apne trading risks ko effectively manage kar sakte hain. Market ke conditions aur volatility ko consider karke risk management strategies ko customize karna zaroori hai taake traders profitable trades execute kar sakein.

            In short, Three Black Crows pattern ko trade karte waqt risk management ka implementation zaroori hai. Stop-loss orders, position sizing, aur trading plan ko carefully manage karke traders apne trading risks ko minimize kar sakte hain aur profitable trades execute kar sakte hain.

            8. Historical Performance

            Three Black Crows pattern ki historical performance ko analyze karne se traders ko pattern ki effectiveness aur reliability ke baare mein information milti hai. Pichle years mein, is pattern ne bearish reversals ko accurately predict kiya hai aur market ke trends ko identify karne mein madad ki hai.

            Historical data ke analysis se ye pata chalta hai ke pattern ne significant profits generate kiye hain aur bearish trends ko accurately predict kiya hai. Lekin, pattern ki effectiveness market conditions aur other factors pe depend karti hai. Historical performance ko market conditions aur trading strategies ke sath align karna zaroori hai.

            Pichle trends aur data ko analyze karke traders ko pattern ke historical performance ke baare mein insights milte hain. Ye insights trading decisions ko guide karte hain aur pattern ke effectiveness ko validate karte hain. Historical performance ke analysis se traders ko pattern ke reliability ke baare mein information milti hai.

            Historical data ke analysis se ye bhi pata chalta hai ke pattern ne kab successful trades generate kiye hain aur kab false signals diye hain. Ye information traders ko pattern ke effective use aur risk management ke strategies ko optimize karne mein madad karti hai.

            In short, Three Black Crows pattern ki historical performance ko analyze karke traders pattern ke effectiveness aur reliability ke baare mein information le sakte hain. Historical data ke analysis se pattern ke successful trades aur false signals ke baare mein insights milti hain jo ke trading decisions ko guide karti hain.

            9. Pattern Ki Limitations

            Three Black Crows pattern ki kuch limitations bhi hain jo traders ko consider karni chahiye. Har pattern ki tarah, is pattern ke bhi limitations aur shortcomings hain jo trading decisions ko affect kar sakti hain. Ye limitations traders ko pattern ke effective use aur risk management ke strategies ko optimize karne mein madad karti hain.

            Ek limitation ye hai ke pattern false signals bhi de sakta hai. Market ki volatility aur unexpected movements pattern ke signals ko affect kar sakte hain aur false signals generate kar sakte hain. Isliye, pattern ke signals ko other technical indicators ke sath validate karna zaroori hai.

            Dusri limitation ye hai ke pattern ka effectiveness market conditions pe depend karta hai. Agar market conditions bearish nahi hain ya pattern ke signals market ke overall trend ke sath align nahi hain, to pattern ki effectiveness kam ho sakti hai. Isliye, market conditions ko consider karke pattern ke signals ko validate karna zaroori hai.

            Tisri limitation ye hai ke pattern ka accuracy 100% nahi hota. Pattern market ke behavior aur sentiment ko accurately reflect karta hai, lekin market ke unexpected movements aur volatility pattern ke signals ko affect kar sakte hain. Traders ko pattern ke signals ke sath risk management strategies ko implement karna chahiye taake losses ko limit kiya ja sake.

            In short, Three Black Crows pattern ki limitations ko consider karna zaroori hai. Pattern ke false signals, market conditions, aur accuracy ke limitations ko samajhkar traders apne trading strategies ko optimize kar sakte hain aur effective trading decisions le sakte hain.

            10. Comparisons

            Three Black Crows pattern ko other bearish patterns ke sath compare karke traders ko different patterns ke strengths aur weaknesses ke baare mein information milti hai. Comparisons se traders ko patterns ke effectiveness aur suitability ke baare mein insights milti hain.

            Dark Cloud Cover aur Evening Star patterns ko Three Black Crows ke sath compare kiya ja sakta hai. Dark Cloud Cover pattern bhi bearish reversal ko indicate karta hai aur market ke sentiment ko reflect karta hai. Lekin, is pattern ki formation aur signals Three Black Crows se different hote hain.

            Evening Star pattern bhi bearish reversal ko indicate karta hai aur market ke sentiment ko reflect karta hai. Is pattern mein ek bullish candle ke baad do bearish candles banti hain. Comparisons se traders ko patterns ke differences aur similarities ke baare mein information milti hai aur trading strategies ko optimize karne mein madad milti hai.

            Comparisons ke zariye traders ko patterns ke effectiveness aur reliability ke baare mein information milti hai. Ye information traders ko different patterns ke strengths aur weaknesses ko understand karne mein madad karti hai aur trading decisions ko guide karti hai.

            In short, Three Black Crows pattern ko other bearish patterns ke sath compare karke traders ko patterns ke differences aur similarities ke baare mein information milti hai. Comparisons se traders ko patterns ke effectiveness aur reliability ke baare mein insights milti hain jo ke trading strategies ko enhance karne mein madad karti hain.

            11. Practical Examples

            Three Black Crows pattern ko market charts par dekh kar traders ne past mein significant profits kamaye hain. Practical examples se traders ko pattern ke real-world applications aur effectiveness ke baare mein information milti hai. Examples mein stocks, forex, aur commodities markets ki analysis shamil hai.

            Stock markets mein Three Black Crows pattern ne bearish reversals ko accurately predict kiya hai aur profitable trades generate kiye hain. Forex markets mein bhi is pattern ne market ke trends ko accurately predict kiya hai aur traders ko profitable trades ka mauka diya hai.

            Commodities markets mein bhi Three Black Crows pattern ka use karke traders ne successful trades ki hain. Pattern ke signals ko market conditions aur other technical indicators ke sath integrate karke traders ne profitable trades execute ki hain.

            Practical examples se traders ko pattern ke effectiveness aur real-world applications ke baare mein insights milti hain. Ye examples traders ko pattern ke use aur trading strategies ko better understand karne mein madad karti hain aur market movements ko accurately predict karne mein guide karti hain.

            In short, Three Black Crows pattern ke practical examples se traders ko pattern ke real-world applications aur effectiveness ke baare mein information milti hai. Examples ke zariye traders apne trading strategies ko enhance kar sakte hain aur market movements ko better predict kar sakte hain.

            12. Indicator Integration

            Technical analysts Three Black Crows pattern ko other indicators ke sath integrate karte hain taake trading decisions zyada accurate ho sakain. Indicator integration se traders ko pattern ke signals ko validate karne aur market ke trends ko accurately predict karne mein madad milti hai.

            Moving Averages ko Three Black Crows pattern ke sath integrate karke traders trend ke direction ko better understand kar sakte hain. Moving Averages ke crossovers aur pattern ke signals ko analyze karke traders apne trading decisions ko optimize kar sakte hain.

            Relative Strength Index (RSI) bhi pattern ke signals ke sath integrate kiya ja sakta hai. RSI ke readings se traders ko market ke overbought aur oversold conditions ke baare mein information milti hai aur pattern ke bearish signals ko validate karne mein madad milti hai.

            Indicator integration se traders ko market ke different aspects ko analyze karne aur pattern ke signals ko confirm karne mein madad milti hai. Ye integration trading strategies ko enhance karne aur market movements ko accurately predict karne mein guide karti hai.

            In short, Three Black Crows pattern ko other indicators ke sath integrate karke traders apne trading decisions ko zyada accurate aur effective bana sakte hain. Indicator integration se pattern ke signals ko validate karne aur market ke trends ko better understand karne mein madad milti hai.

            13. Pattern Ki Evolution

            Time ke sath, Three Black Crows pattern ki importance aur recognition barh gaya hai. Modern trading platforms aur tools ke zariye is pattern ko asaani se identify kiya ja sakta hai aur trading strategies ko enhance kiya ja sakta hai. Pattern ki evolution market ke advancements aur trading tools ke development ke sath closely linked hai.

            Modern trading platforms aur tools ke zariye pattern ko identify karne aur analyze karne mein madad milti hai. Advanced charting tools aur technical indicators pattern ke signals ko accurately identify karne aur validate karne mein madad karte hain. Is evolution se traders ko pattern ke use aur effectiveness ko optimize karne ka mauka milta hai.

            Pattern ki evolution ke sath traders ke trading strategies bhi evolve hui hain. Traders ne pattern ke signals ko better analyze karne aur market movements ko accurately predict karne ke liye advanced techniques aur tools develop kiye hain. Is evolution se trading decisions aur strategies ko optimize kiya gaya hai.

            In short, Three Black Crows pattern ki evolution ne trading tools aur strategies ko enhance kiya hai. Modern trading platforms aur tools ke zariye pattern ko accurately identify aur analyze kiya ja sakta hai, jo ke traders ko trading decisions aur strategies ko optimize karne mein madad karta hai.

            14. Conclusion

            Three Black Crows ek effective bearish reversal pattern hai jo technical analysis mein valuable tool ban chuka hai. Is pattern ko samajhkar aur sahi tarike se trade karke investors market ke trend ko accurately predict kar sakte hain. Lekin, kisi bhi trading pattern ka istemal karte waqt comprehensive analysis aur risk management ko madde nazar rakhna zaroori hai.

            Pattern ke effectiveness ko accurately analyze karne aur validate karne ke liye confirmation signals aur other technical indicators ko consider karna zaroori hai. Risk management strategies ko implement karne se traders apne trading risks ko minimize kar sakte hain aur profitable trades execute kar sakte hain.

            Three Black Crows pattern ki historical performance, limitations, aur comparisons se traders ko pattern ke effectiveness aur suitability ke baare mein insights milti hain. Practical examples aur indicator integration se pattern ke real-world applications aur effectiveness ko enhance kiya ja sakta hai.

            In short, Three Black Crows pattern ek valuable trading tool hai jo market ke bearish reversals ko identify karne mein madad karta hai. Is pattern ka effective use aur comprehensive analysis trading strategies ko optimize karne aur market movements ko accurately predict karne mein guide karta hai.
            • #7 Collapse

              Three Black Crows Candlestick Pattern trading ke world mein ek popular technical analysis indicator hai jo market trend aur price movements ke bare mein significant insights provide karta hai. Yeh pattern generally bearish trend ka indication hota hai aur traders ko signal deta hai ke market ke andar selling pressure barh raha hai aur buyers ke control se market nikal raha hai. Is pattern ka naam Three Black Crows kyun hai aur isay kaise identify karte hain, is ko samajhna trading ke liye bahut zaroori hai. Three Black Crows ek bearish reversal pattern hota hai jo tab form hota hai jab market ek uptrend se nikal kar downtrend ki taraf move karta hai. Is pattern mein consecutively 3 bearish candles hoti hain jinhon ne almost ek hi range mein close karna hota hai. Har ek candle ka opening price previous candle ke body ke andar hota hai, aur closing price consistently lower hota hai.


              Three Black Crows pattern tab form hota hai jab market kisi bullish (upar jaate hue) trend mein hota hai aur phir achanak se bearish (neeche aate hue) ho jata hai. Is transition se yeh samjha jaata hai ke pehle buyers dominate kar rahe the, lekin ab sellers ne control le liya hai aur market neeche girne wala hai.

              Candlestick Patterns Ki Basics
              Is pattern ko samajhne se pehle humein thoda sa candlestick patterns ka background lena hoga. Candlestick charts trading mein price action ko visualize karne ka ek tareeqa hoti hain. Ek typical candlestick do main components par mushtamil hoti hai: body aur shadows.
              • Body represent karta hai opening aur closing price ke darmiyan ka range.
              • Shadows (ya wicks) indicate karti hain highest aur lowest price jo us particular period ke liye achieve hue hote hain.
              Candlestick ko do colors mein dikhaya jata hai: green (ya white) jab closing price opening price se zyada ho (bullish candle), aur red (ya black) jab closing price opening price se kam ho (bearish candle).

              Three Black Crows Pattern Ko Kaise Identify Karte Hain?
              Three Black Crows pattern ko identify karna kaafi asaan hota hai agar aap candlestick charts ko achi tarah samajhte hain. Yeh pattern teen consecutive bearish candles (red ya black) par mushtamil hota hai jo ek bullish trend ke baad appear hoti hain. Is pattern ke liye kuch khas cheezein hain jo identify karni hoti hain:
              1. Pehli Candle: Pehli bearish candle uptrend ke baad form hoti hai aur iski body significant hoti hai, jo yeh indicate karti hai ke sellers ne control le liya hai.
              2. Doosri Candle: Doosri candle bhi bearish hoti hai lekin iski opening pehli candle ke body ke andar hoti hai, lekin closing pehle se lower hoti hai. Yeh indicate karta hai ke selling pressure maintain hai.
              3. Teesri Candle: Teesri candle bhi bearish hoti hai, aur iski closing price aur bhi lower hoti hai, jo market mein abhi tak selling pressure ke continuation ko dikhata hai.
              Key Points
              • Teeno candles ke body zyada honi chahiye aur unki shadows kam honi chahiye. Yeh dikhata hai ke downtrend strong hai aur koi significant resistance nahi hai.
              • Yeh pattern generally ek trend reversal ko indicate karta hai, is liye iska occur hona after an uptrend zaroori hota hai.
              • Har candle ka close previous candle se neeche hona chahiye.
              Three Black Crows Pattern Ka Psychological Analysis
              Three Black Crows pattern ko samajhne ka ek aur tareeqa iska psychological aspect hai. Market mein jab uptrend hota hai, to log optimistic hote hain aur buy karte hain. Lekin jab ek certain point par market overbought ho jata hai ya buyers ki strength kam ho jati hai, to sellers dominate karne lagte hain.

              Pehli candle is baat ka indication hoti hai ke selling pressure badh raha hai. Buyers pehle thoda aur push karte hain lekin sellers ke aggressive behavior ki wajah se market neeche girta hai. Doosri aur teesri candles ke saath yeh pressure zyada intense hota jata hai aur buyers completely control kho dete hain.

              Yeh pattern kaam karta hai kyun ke market participants ko lagta hai ke price ab reversal ki taraf move karega aur is wajah se panic mein selling hoti hai. Yeh collective sentiment pattern ko banata hai.

              Three Black Crows Aur Confirmation Indicators
              Yeh pattern powerful signal de sakta hai, lekin is pattern ke basis par sirf trade lena hamesha acha idea nahi hota. Market mein hamesha uncertainty hoti hai, aur is wajah se confirmations lena zaroori hota hai. Confirmation ke liye kai tools aur indicators ka use kiya ja sakta hai:
              1. Volume Indicator: Jab Three Black Crows pattern ban raha ho aur saath mein volume bhi increase ho raha ho, to yeh ek strong indication hota hai ke trend reversal ho raha hai. High volume selling pressure ke intensity ko confirm karta hai.
              2. Moving Averages: Agar price Three Black Crows ke baad 50-day ya 200-day moving average ke neeche close ho jaye, to yeh bhi ek bearish signal hota hai.
              3. Relative Strength Index (RSI): RSI ek popular momentum oscillator hai jo overbought aur oversold conditions ko measure karta hai. Agar Three Black Crows ke baad RSI overbought zone (70+ level) se neeche aaye to yeh trend reversal ka aur bhi strong confirmation deta hai.
              4. MACD (Moving Average Convergence Divergence): MACD ka bearish crossover bhi ek strong signal hota hai ke downtrend start ho gaya hai.
              Three Black Crows Ki Limitations
              Jitna powerful yeh pattern hai, itni hi important baat yeh hai ke iska blindly follow karna chhoti galti ho sakta hai. Three Black Crows pattern ki kuch limitations hain jo traders ko samajhni chahiye:
              1. False Signals: Har Three Black Crows pattern bearish reversal ko indicate nahi karta. Kabhi kabhi yeh sirf temporary pullback ho sakta hai aur uptrend wapas resume ho sakta hai. Is liye confirmation indicators zaroori hain.
              2. Market Conditions: Yeh pattern highly volatile ya unpredictable markets mein itna reliable nahi hota. Strong trends mein, market overbought hone ke bawajood uptrend continue kar sakta hai.
              3. Trend Ka Duration: Is pattern ka rely karna yeh assume karta hai ke uptrend kaafi waqt tak chala hai, lekin agar uptrend short term ho to reversal ka signal kamzor ho sakta hai.


              Three Black Crows Strategy Mein Kaise Use Karte Hain?
              Traders jo Three Black Crows pattern ko apni strategy mein include karte hain, unke liye sabse pehla step yeh hota hai ke pehle market condition ko analyze karna chahiye. Agar market already ek sustained uptrend mein hai, to is pattern ka appearance trend reversal ka strong signal ho sakta hai.
              1. Entry Point: Jab Three Black Crows pattern confirm ho jata hai, to entry tab hoti hai jab teesri candle ke baad bhi price neeche hi continue karta hai ya kisi support level ko break karta hai.
              2. Stop Loss: Stop loss lagana critical hota hai, aur yeh usually teesri candle ke high ke aas paas set kiya jata hai. Agar price unexpectedly upar chala jaye to loss ko limit kiya ja sake.
              3. Target Setting: Target setting ke liye aap previous support levels ko use kar sakte hain ya Fibonacci retracement levels ko bhi analyze kar sakte hain. Trend continuation ke analysis ke liye momentum indicators ko use karna helpful hota hai.
              Three Black Crows candlestick pattern ek powerful bearish reversal signal hota hai jo market mein selling pressure ko dikhata hai. Is pattern ka asar tab zyada strong hota hai jab yeh ek long uptrend ke baad form hota hai aur saath mein volume aur other confirmation indicators bhi signal ko support karte hain. Lekin is pattern ke kuch limitations bhi hain, jinke liye hamesha careful rahna padta hai. False signals aur volatile markets mein yeh pattern misleading ho sakta hai. Is liye hamesha additional technical tools jaise RSI, MACD, aur moving averages ka use karna zaroori hota hai. Three Black Crows ek effective tool hai agar sahi tareeqe se use kiya jaye. Proper risk management ke saath, yeh pattern traders ko market trends aur reversal ko timely identify karne mein madad de sakta hai.
              Believe in yourself and your abilities. When you fight for your dreams, you can achieve anything.
              • #8 Collapse

                Three Black Crows Candlestick Pattern: A Comprehensive Guide

                1. تعارف


                Three Black Crows candlestick pattern ایک انتہائی مشہور اور اہم تکنیکی تجزیہ کا نمونہ ہے جو مالیاتی مارکیٹس میں خاص طور پر اسٹاک اور کرنسی ٹریڈنگ میں استعمال ہوتا ہے۔ یہ نمونہ مندی کے رجحان کی نشاندہی کرتا ہے اور عموماً ایک بڑی قیمت کی تبدیلی کی توقع ہوتی ہے۔
                2. Three Black Crows کیا ہیں؟


                Three Black Crows ایک مندی کا نمونہ ہے جو تین متوالی سیاہ شمعوں پر مشتمل ہوتا ہے۔ ہر شمع کی اختتامی قیمت پچھلی شمع کی اختتامی قیمت سے کم ہوتی ہے، جس سے یہ ظاہر ہوتا ہے کہ مارکیٹ میں دباؤ بڑھتا جا رہا ہے۔ یہ نمونہ عام طور پر ایک اوپر کی جانب چلنے والے رجحان کے بعد ظاہر ہوتا ہے۔
                3. یہ نمونہ کیوں اہم ہے؟


                یہ نمونہ اس لیے اہم ہے کیونکہ یہ ٹریڈرز کو ایک واضح اشارہ دیتا ہے کہ مارکیٹ میں فروخت کا دباؤ بڑھتا جا رہا ہے۔ جب یہ نمونہ بنتا ہے، تو یہ سرمایہ کاروں کو یہ سوچنے پر مجبور کرتا ہے کہ قیمتیں مزید نیچے جا سکتی ہیں، جس سے مزید فروخت کا عمل شروع ہوتا ہے۔
                4. Three Black Crows کی ساخت


                Three Black Crows کی ساخت تین متوالی سیاہ شمعوں کی ہوتی ہے، جہاں ہر شمع کی جسمانی لمبائی کافی ہوتی ہے اور سایے کم ہوتے ہیں۔ یہ شمعیں ایک دوسرے کے قریب ہوتی ہیں اور ان کی اختتامی قیمتیں کم ہوتی جاتی ہیں۔ یہ شمعیں عموماً ایک بڑی تیزی کی شمع کے بعد ظاہر ہوتی ہیں۔
                5. نمونے کی تصدیق


                اس نمونے کی تصدیق کے لیے، ٹریڈرز کو شمعوں کے درمیان کی جگہ کو دیکھنا چاہیے۔ اگر شمعیں ایک دوسرے کے قریب ہیں اور ان کے سایے کم ہیں، تو یہ نمونہ مضبوط سمجھا جاتا ہے۔ اس کے علاوہ، حجم بھی اہمیت رکھتا ہے؛ جب یہ نمونہ بڑی حجم کے ساتھ بنتا ہے، تو یہ مزید مستحکم سمجھا جاتا ہے۔
                6. Three Black Crows کے فوائد


                Three Black Crows کے استعمال کے فوائد میں شامل ہیں: مارکیٹ کے موڑ کی شناخت، مندی کے رجحان کی مضبوطی کی تصدیق، اور خطرات کے انتظام کے لیے بہترین مواقع فراہم کرنا۔ یہ نمونہ ٹریڈرز کو پیشگی اطلاع دیتا ہے کہ قیمتیں نیچے جا سکتی ہیں، جس سے انہیں اپنی حکمت عملیوں میں تبدیلی کرنے کا موقع ملتا ہے۔
                7. Three Black Crows کی شناخت کیسے کریں؟


                Three Black Crows کی شناخت کے لیے، آپ کو چار چیزوں کا دھیان رکھنا ہوگا: پہلی بات یہ کہ یہ نمونہ ایک اوپر کی طرف جانے والے رجحان کے بعد ہونا چاہیے، دوسری بات یہ کہ تین متوالی سیاہ شمعیں ہونی چاہئیں، تیسری بات یہ ہے کہ ہر شمع کی اختتامی قیمت پچھلی شمع سے کم ہونی چاہیے، اور چوتھی بات یہ کہ ان شمعوں کا حجم کافی ہونا چاہیے۔
                8. Three Black Crows کی مثالیں


                مثال کے طور پر، اگر کسی اسٹاک کی قیمت مسلسل اوپر جارہی ہو اور اچانک Three Black Crows کا نمونہ ظاہر ہو جائے، تو یہ سرمایہ کاروں کے لیے ایک سنگین خطرہ ہوسکتا ہے۔ یہ اس بات کا اشارہ ہوتا ہے کہ خریدار کمزور پڑ گئے ہیں اور فروخت کا دباؤ بڑھ رہا ہے۔
                9. Three Black Crows کا اثر


                یہ نمونہ مارکیٹ کے جذبات پر گہرا اثر ڈال سکتا ہے۔ جب سرمایہ کار یہ نمونہ دیکھتے ہیں، تو انہیں یقین ہوتا ہے کہ قیمتیں مزید نیچے جائیں گی، جس سے وہ مزید فروخت کرنے کا فیصلہ کر سکتے ہیں۔ یہ عمل مارکیٹ میں مزید مندی پیدا کرتا ہے۔
                10. Three Black Crows کی حکمت عملی


                اس نمونہ کی بنیاد پر حکمت عملی بناتے وقت، ٹریڈرز کو احتیاط سے عمل کرنا چاہیے۔ وہ اس نمونہ کو دیکھتے ہوئے، اس کے بعد کی قیمت کی حرکت پر توجہ دیں اور اس کے مطابق اپنے ٹریڈز میں تبدیلی کریں۔ یہ ضروری ہے کہ ٹریڈرز مارکیٹ کے عمومی حالات اور دیگر تکنیکی اشاروں کا بھی خیال رکھیں۔
                11. خطرات اور نقصانات


                جبکہ Three Black Crows ایک طاقتور مندی کا اشارہ فراہم کرتا ہے، لیکن اس کے ساتھ کچھ خطرات بھی ہوتے ہیں۔ یہ نمونہ ہمیشہ درست نہیں ہوتا، اور کبھی کبھار مارکیٹ کی حرکت غیر متوقع ہوسکتی ہے۔ لہذا، ٹریڈرز کو اپنے ٹریڈز میں اسٹاپ لاسز کا استعمال کرنا چاہیے تاکہ نقصان سے بچا جا سکے۔
                12. دیگر candlestick نمونوں کے ساتھ موازنہ


                Three Black Crows کا موازنہ دیگر candlestick نمونوں جیسے کہ 'Bearish Engulfing' اور 'Shooting Star' سے کیا جا سکتا ہے۔ ہر نمونہ مختلف مارکیٹ کی حالتوں کی نشاندہی کرتا ہے، لیکن Three Black Crows خاص طور پر مضبوط مندی کی تصدیق کرتا ہے۔
                13. Three Black Crows کا استعمال


                اس نمونہ کو استعمال کرتے وقت، ٹریڈرز کو اپنے تجزیات میں اسے دیگر تکنیکی اشاروں کے ساتھ ملانا چاہیے، جیسے کہ موونگ ایوریجز یا RSI (Relative Strength Index)۔ یہ مدد کرتا ہے کہ ٹریڈرز زیادہ مستحکم فیصلے کریں اور خطرات کو کم کریں۔
                14. نتیجہ


                Three Black Crows candlestick pattern ایک اہم تکنیکی تجزیاتی ٹول ہے جو مارکیٹ کے رجحانات کی شناخت میں مدد کرتا ہے۔ یہ نمونہ ٹریڈرز کو مندی کی توقعات کا ایک واضح اشارہ دیتا ہے اور ان کی حکمت عملیوں کو بہتر بنانے میں مددگار ثابت ہوتا ہے۔ اس نمونہ کا مؤثر استعمال سرمایہ کاروں کو کامیاب ٹریڈنگ میں معاونت فراہم کرتا ہے، لیکن انہیں خطرات کا بھی خیال رکھنا چاہیے۔


                • <a href="https://www.instaforex.org/ru/?x=ruforum">InstaForex</a>
                • #9 Collapse

                  Three Black Crows Candlestick Pattern


                  Introduction

                  Forex trading mein candlestick patterns ka kafi ahmiyat hai. Ye patterns traders ko market ki mood aur future price movements ka andaza lagane mein madad dete hain. In candlestick patterns mein se aik mashhoor pattern "Three Black Crows" hai. Ye pattern bearish reversal signal dene ke liye jaana jata hai. Is maqalay mein, hum Three Black Crows candlestick pattern ki tafseelat, is ki pehchaan, aur is ka istemal kaise karna hai, par baat karenge.
                  Three Black Crows Ki Pehchaan


                  Three Black Crows pattern teen consecutive black (ya red) candlesticks par mabni hota hai, jo ke bearish trend ki taraf ishara karte hain. Is pattern ki pehchaan yeh hai:
                  1. Teen consecutive bearish candlesticks: Yeh candlesticks har ek doosre se zyada long aur closing price ke saath lower hoti hain. Is ka matlab hai ke market ne har din lower closing ki taraf move kiya.
                  2. Open and Close: Har candlestick ki opening price pichli candlestick ke closing price ke nazdeek hoti hai. Is se yeh darust hota hai ke market mein momentum hai.
                  3. Body aur Shadow: Candlesticks ki body dark honi chahiye aur in ki shadows (wick) choti honi chahiye. Is se market ke selling pressure ki tasveer milti hai.

                  Is pattern ka nazar aana market mein aik strong bearish trend ki taraf ishara karta hai. Yeh pattern aksar bullish trend ke baad banta hai, jo ke reversal ki taraf ishara karta hai.
                  Pattern Ka Maqsad


                  Three Black Crows pattern ka asal maqsad market mein bearish sentiment ko darust karna hai. Jab yeh pattern banta hai, to yeh traders ko yeh batata hai ke sellers ka control barh raha hai aur buyers ki taqat kam ho rahi hai. Is pattern ke bante hi traders bearish positions lene ka soch sakte hain. Yeh pattern aksar long bullish trends ke baad aata hai, jahan market ne pichle kuch dino mein acha kiya hota hai.
                  Technical Analysis Mein Iska Istemal


                  Traders is pattern ka istemal technical analysis mein karte hain taake woh entry aur exit points ka andaza laga saken. Is pattern ka istemal karne ke kuch ahem points yeh hain:
                  1. Confirmation: Jab Three Black Crows pattern banta hai, to traders ko chahiye ke woh kisi aur technical indicator ya pattern ki confirmation ka intezar karein. Yeh confirmation kisi bhi doosre bearish pattern, volume spike, ya momentum indicators ke zariye mil sakta hai.
                  2. Stop Loss: Aam tor par, stop loss ko last candlestick ke high par set kiya jata hai. Is tarah traders apne potential losses ko control mein rakh sakte hain.
                  3. Target Setting: Target ko previous support level ya ek predetermined risk-reward ratio ke hisaab se set kiya jata hai. Yeh traders ko profit secure karne mein madad karta hai.
                  Trading Strategies Using Three Black Crows


                  Three Black Crows pattern ko trading strategies mein include karna kaafi faida mand ho sakta hai. Yahan kuch strategies di gayi hain jo is pattern ke sath istemal ki ja sakti hain:
                  1. Breakout Strategy: Jab Three Black Crows pattern ban jata hai, to traders lower breakout ke liye dekhte hain. Yeh unhe ek short position lene ka mauqa deta hai jab price is pattern ke neeche close hoti hai.
                  2. Retest Strategy: Kabhi kabhi, market Three Black Crows pattern ke baad retest karta hai. Traders yeh dekhte hain ke kya price pichli resistance level tak aati hai. Agar price retest hoti hai aur phir se girti hai, to yeh ek strong selling signal ho sakta hai.
                  3. Combining with Other Indicators: Traders aksar is pattern ko RSI (Relative Strength Index) ya MACD (Moving Average Convergence Divergence) jese indicators ke sath mila kar istemal karte hain. Agar RSI overbought zone mein hai aur Three Black Crows pattern banta hai, to yeh ek strong sell signal ban sakta hai.
                  Risk Management


                  Kisi bhi trading strategy ke sath risk management ka khayal rakhna zaroori hai. Three Black Crows pattern ka istemal karte waqt kuch risk management techniques yeh hain:
                  1. Proper Position Sizing: Traders ko apne portfolio ke hisaab se position size tay karna chahiye. Yeh unhe potential losses se bacha sakta hai.
                  2. Using Stop Losses: Stop losses ko zaroor istemal karna chahiye, kyunki markets unpredictable hote hain. Agar market against chali jaye to stop loss aapko badi losses se bacha sakta hai.
                  3. Emotional Control: Trading mein emotions ka kafi ahm role hota hai. Traders ko chahiye ke woh apne emotions ko control mein rakhein aur impulsive decisions se bachen.
                  Conclusion


                  Three Black Crows candlestick pattern ek powerful bearish reversal indicator hai jo traders ko market ki downward trend ki taraf ishara karta hai. Is pattern ki pehchaan aur istemal karna aapko market ke mood ko samajhne mein madad de sakta hai. Lekin, kisi bhi trading strategy ki tarah, Three Black Crows pattern ka istemal karte waqt risk management aur confirmation ka khayal rakhna zaroori hai. Agar aap is pattern ko sahi tarah se istemal karte hain, to aap Forex trading mein behtareen faida hasil kar sakte hain.

                  اب آن لائن

                  Working...
                  X