Pipe Tops and Pipe Bottom candle stick patteran
X
  • وقت
  • دکھائیں
Clear All
new posts
  • #1 Collapse

    Pipe Tops and Pipe Bottom candle stick patteran
    Pipe Tops Aur Pipe Bottoms Candle Stick Pattern

    Muqadma

    Candlestick patterns stock market aur forex trading mein analysis ke liye bohot zaroori hote hain. In patterns se traders ko market ke movement ko samajhne aur future ke trends ka andaza lagane mein madad milti hai. Aaj hum do khas candlestick patterns par baat karenge: Pipe Tops aur Pipe Bottoms. Ye patterns trend reversal ko indicate karte hain aur traders ke liye bohot valuable ho sakte hain.

    Click image for larger version

Name:	images - 2024-07-12T122635.516.jpeg
Views:	18
Size:	67.9 کلوبائٹ
ID:	13038225
    Pipe Tops Pattern

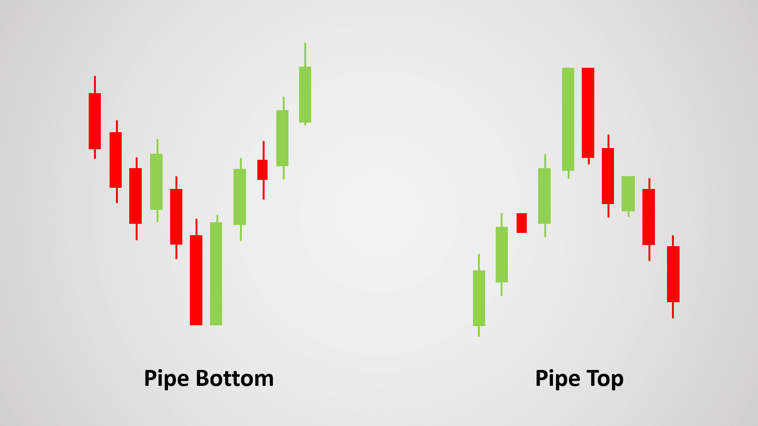
    Pipe Tops pattern ek bullish trend ke baad appear hota hai aur ye indicate karta hai ke market mein bearish reversal hone wala hai. Is pattern mein do consecutive candles hoti hain jinka high level almost equal hota hai aur dono candles ke beech mein ek chhoti si shadow hoti hai.
    1. First Candle: Pehli candle bullish hoti hai jo ke ek strong uptrend ko represent karti hai. Is candle ka body bara hota hai aur shadow chhoti ya bilkul nahi hoti.
    2. Second Candle: Dusri candle bearish hoti hai jo pehli candle ke high ke qareeb se open hoti hai. Ye candle pehli candle se chhoti hoti hai aur iske shadow bhi chhoti hoti hain.

    Pipe Tops Ki Pehchaan
    • High Points: Dono candles ke high points almost barabar hote hain.
    • Trend: Ye pattern ek strong bullish trend ke baad appear hota hai.
    • Volume: Pehli candle mein high volume hota hai jab ke dusri candle mein volume decrease hota hai.

    Pipe Tops Ka Tajzia

    Pipe Tops pattern ek strong indication hota hai ke market mein bullish trend khatam hone wala hai aur bearish trend shuru hone wala hai. Jab ye pattern confirm ho jata hai to traders short selling ya apni positions ko exit kar sakte hain taake losses se bacha ja sake.
    Click image for larger version

Name:	images - 2024-07-12T122608.995.jpeg
Views:	18
Size:	28.1 کلوبائٹ
ID:	13038224

    Pipe Bottoms Pattern

    Pipe Bottoms pattern ek bearish trend ke baad appear hota hai aur ye indicate karta hai ke market mein bullish reversal hone wala hai. Is pattern mein bhi do consecutive candles hoti hain jinka low level almost equal hota hai aur dono candles ke beech mein ek chhoti si shadow hoti hai.
    1. First Candle: Pehli candle bearish hoti hai jo ke ek strong downtrend ko represent karti hai. Is candle ka body bara hota hai aur shadow chhoti ya bilkul nahi hoti.
    2. Second Candle: Dusri candle bullish hoti hai jo pehli candle ke low ke qareeb se open hoti hai. Ye candle pehli candle se chhoti hoti hai aur iske shadow bhi chhoti hoti hain.

    Pipe Bottoms Ki Pehchaan
    • Low Points: Dono candles ke low points almost barabar hote hain.
    • Trend: Ye pattern ek strong bearish trend ke baad appear hota hai.
    • Volume: Pehli candle mein high volume hota hai jab ke dusri candle mein volume decrease hota hai.

    Pipe Bottoms Ka Tajzia

    Pipe Bottoms pattern ek strong indication hota hai ke market mein bearish trend khatam hone wala hai aur bullish trend shuru hone wala hai. Jab ye pattern confirm ho jata hai to traders buying ya apni positions ko hold kar sakte hain taake profits kamaya ja sake.
    Click image for larger version

Name:	images - 2024-07-12T122558.390.png
Views:	21
Size:	10.1 کلوبائٹ
ID:	13038223

    Pipe Tops Aur Pipe Bottoms Ki Ahmiyat

    Pipe Tops aur Pipe Bottoms patterns ki ahmiyat trading mein bohot zyada hoti hai. In patterns ke through traders market ke trend reversals ko pehchan kar sakte hain aur apni trading strategies ko accordingly adjust kar sakte hain. In patterns ko samajhne aur use karne se traders ko significant profits kamane ka mauka milta hai aur market risks ko bhi minimize karne mein madad milti hai.
    Candlestick patterns trading mein bohot zaroori hoti hain aur inka sahih istemal kar ke traders apni trading performance ko improve kar sakte hain. Pipe Tops aur Pipe Bottoms patterns ke zariye traders market ke trend reversals ko accurately pehchan sakte hain aur apni strategies ko adjust kar ke significant profits kama sakte hain. Ye patterns trading ki duniya mein ek valuable tool hain jo traders ko informed decisions lene mein madadgar sabit hote hain.
  • <a href="https://www.instaforex.org/ru/?x=ruforum">InstaForex</a>
  • #2 Collapse

    Pipe Tops and Pipe Bottom candle stick patteran


    Click image for larger version

Name:	download (11).jfif
Views:	17
Size:	13.8 کلوبائٹ
ID:	13038238


    Pipe Tops Candlestick Pattern


    Pipe Tops candlestick pattern aik bullish reversal pattern hai jo aksar downtrend ke baad bantay hain. Is pattern mein do candles hoti hain: pehli candle ek long bearish candle hoti hai aur doosri candle ek long bullish candle hoti hai. Yeh dono candles mil kar "pipes" ki shakal banati hain jo ke bottom mein almost same level par close hoti hain.
    Pipe Tops Pattern Ke Key Points:
    1. Pehli Candle: Long bearish candle jo downtrend ko continue karti hai.
    2. Doosri Candle: Long bullish candle jo pehli candle ke low level ke qareeb close hoti hai.
    3. Confirmation: Yeh pattern tab confirm hota hai jab teesri candle bullish hoti hai aur yeh price aur bhi upar chalti hai.
    Pipe Tops Pattern Ki Example:


    Misaal ke taur par, agar aik stock ki price gir rahi hai aur aik din ek lambi bearish candle banti hai, phir agle din ek lambi bullish candle banti hai jo pehli candle ke close ke qareeb close hoti hai, to yeh Pipe Tops pattern banata hai. Is se yeh signal milta hai ke market ka trend ab bullish ho sakta hai.
    Trading Strategy:
    • Entry Point: Jab teesri candle bullish ho aur previous high ko break kare.
    • Stop Loss: Pipe Tops pattern ka low point.
    • Target: Risk-reward ratio ko dekhte hue target set karein, jaise ke 1:2 ya 1:3.
    Pipe Bottoms Candlestick Pattern


    Pipe Bottoms candlestick pattern aik bearish reversal pattern hai jo aksar uptrend ke baad bantay hain. Is pattern mein bhi do candles hoti hain: pehli candle ek long bullish candle hoti hai aur doosri candle ek long bearish candle hoti hai. Yeh dono candles mil kar "pipes" ki shakal banati hain jo ke top mein almost same level par close hoti hain.
    Pipe Bottoms Pattern Ke Key Points:
    1. Pehli Candle: Long bullish candle jo uptrend ko continue karti hai.
    2. Doosri Candle: Long bearish candle jo pehli candle ke high level ke qareeb close hoti hai.
    3. Confirmation: Yeh pattern tab confirm hota hai jab teesri candle bearish hoti hai aur yeh price aur bhi neeche chalti hai.
    Pipe Bottoms Pattern Ki Example:


    Misaal ke taur par, agar aik stock ki price barh rahi hai aur aik din ek lambi bullish candle banti hai, phir agle din ek lambi bearish candle banti hai jo pehli candle ke close ke qareeb close hoti hai, to yeh Pipe Bottoms pattern banata hai. Is se yeh signal milta hai ke market ka trend ab bearish ho sakta hai.
    Trading Strategy:
    • Entry Point: Jab teesri candle bearish ho aur previous low ko break kare.
    • Stop Loss: Pipe Bottoms pattern ka high point.
    • Target: Risk-reward ratio ko dekhte hue target set karein, jaise ke 1:2 ya 1:3.
    Pipe Tops aur Pipe Bottoms Pattern Ka Analysis:
    1. Volume Analysis: In patterns ke sath volume ka analysis bhi zaroori hai. Agar second candle ke sath volume zyada hai to yeh pattern aur bhi strong ho jata hai.
    2. Support and Resistance Levels: In patterns ko support aur resistance levels ke qareeb observe karna chahiye. Agar yeh levels par bantay hain to reversal ka chance zyada hota hai.
    3. Market Sentiment: Market ka overall sentiment bhi dekhna zaroori hai. Agar market bearish hai to Pipe Tops pattern zyada effective ho sakta hai aur agar market bullish hai to Pipe Bottoms pattern zyada effective ho sakta hai.
    Conclusion


    Pipe Tops aur Pipe Bottoms candlestick patterns trading mein bohot important hain. Yeh patterns humein market ke reversal points ke baare mein early indications dete hain. Magar in patterns ko use karne se pehle hamesha aur factors jaise ke volume, support/resistance levels, aur overall market sentiment ko bhi madde nazar rakhna chahiye.

    Trading mein success ke liye zaroori hai ke aap in patterns ko ache se samjhein aur in ke sath proper risk management techniques ka bhi istemal karein. Is tarah se aap apni trading strategies ko aur bhi effective bana sakte hain aur market ke trends ko ache se capitalize kar sakte hain.
    • #3 Collapse

      Pipe Tops and Pipe Bottom Candlestick Patterns

      Candlestick patterns are essential tools in technical analysis for traders to interpret market sentiment and predict potential price movements. Among these patterns, Pipe Tops and Pipe Bottoms are notable for indicating potential reversals in trends. Let's delve into these patterns and their significance in trading, particularly in the context of the financial markets.
      Pipe Tops


      Pipe Tops, also known as Piercing Line or Bullish Engulfing patterns, typically appear at the end of a downtrend. They consist of two candles:
      1. First Candle: This candle is a bearish candle, indicating that sellers are in control of the market.
      2. Second Candle: The second candle opens lower than the previous close but rallies throughout the session to close above the midpoint of the first candle's body. This bullish candle signifies a potential reversal in sentiment from bearish to bullish.

      Traders interpret Pipe Tops as a signal that selling pressure is weakening, and buyers may be stepping in, potentially leading to a bullish reversal. However, confirmation through subsequent price action is crucial before making trading decisions based solely on this pattern.
      Pipe Bottoms


      On the flip side, Pipe Bottoms, also known as Bullish Piercing or Bullish Engulfing patterns in some contexts, emerge at the end of uptrends, suggesting a potential reversal to the downside. These patterns consist of:
      1. First Candle: A bullish candle, indicating that buyers are dominating the market.
      2. Second Candle: The following candle opens higher than the previous close but fails to sustain the bullish momentum, closing below the midpoint of the first candle's body. This bearish candle suggests a shift in sentiment from bullish to bearish.

      Pipe Bottoms are seen as a warning sign for traders who might consider taking profits or adjusting their positions as the uptrend weakens. As with Pipe Tops, confirmation from subsequent price action is essential to validate the potential trend reversal.
      Trading Strategies


      Traders use Pipe Tops and Pipe Bottoms in conjunction with other technical indicators and analysis tools to enhance their trading strategies. Here are a few common strategies involving these patterns:
      • Confirmation: Traders wait for the close of the second candle to confirm the pattern before entering a trade. This confirmation helps reduce false signals and improves the reliability of the pattern.
      • Volume Analysis: Analyzing trading volume can provide additional confirmation of the strength of the reversal indicated by Pipe Tops or Pipe Bottoms. Increased volume during the formation of these patterns may indicate strong buying or selling pressure.
      • Support and Resistance Levels: Traders often look for Pipe Tops and Pipe Bottoms near significant support or resistance levels on price charts. These levels can act as additional confirmation of potential trend reversals.


      In conclusion, Pipe Tops and Pipe Bottoms are important candlestick patterns that traders use to identify potential trend reversals in the financial markets. While these patterns provide valuable insights into market sentiment shifts, they should always be confirmed by other technical indicators and analysis tools before making trading decisions. Understanding these patterns and incorporating them into a broader trading strategy can help traders improve their decision-making process and potentially enhance their trading outcomes in volatile market conditions
      • #4 Collapse

        Candlestick analysis ek bohot hi mashhoor aur asan method hai jo trading mein use hoti hai. Yeh method Japanese rice traders ne 18th century mein develop kiya tha. Candlestick charts price movement ko visual form mein dikhate hain, jahan har candle ek specific time period ko represent karti hai.

        agar aap inhe sahi tarike se samajh kar use karein. Confirmation, volume aur risk management ko madde nazar rakh kar aap apni trading ki accuracy ko badha sakte hain. Trading ek risky business hai, lekin sahi knowledge aur strategy ke saath aap isme successful ho sakte hain.

        Pipe Top aur Pipe Bottom Patterns


        Pipe top aur pipe bottom candlestick patterns reversal patterns hain. Yeh patterns batate hain ke market trend ab change hone wala hai. Pipe top pattern market ke top par form hota hai aur pipe bottom pattern market ke bottom par form hota hai.


        Click image for larger version

Name:	images (63).jpeg
Views:	20
Size:	67.9 کلوبائٹ
ID:	13038346


        Pipe Top Pattern


        Pipe top pattern tab banta hai jab market uptrend mein ho aur do candles banati hain jo dikhne mein similar hoti hain. Pehli candle ek lambi bullish (green) candle hoti hai jo strong buying pressure ko indicate karti hai. Dusri candle bearish (red) hoti hai aur pehli candle ke high ke kareeb se start hoti hai lekin close pehli candle ke low ke kareeb hoti hai. Yeh pattern yeh batata hai ke buyers ab weak ho rahe hain aur sellers ne control le liya hai.

        Pipe Bottom Pattern


        Pipe bottom pattern market ke bottom par form hota hai jab market downtrend mein ho. Is pattern mein pehli candle bearish (red) hoti hai jo strong selling pressure ko indicate karti hai. Dusri candle bullish (green) hoti hai jo pehli candle ke low ke kareeb se start hoti hai aur close pehli candle ke high ke kareeb hoti hai. Yeh pattern yeh batata hai ke sellers ab weak ho rahe hain aur buyers ne control le liya hai.

        Analysis Aur Trading Strategy

        Confirmation


        Sirf pipe top ya pipe bottom pattern dekh kar trade lena risky ho sakta hai. Isliye, hamesha confirmation ka wait karein. Confirmation ke liye next candle ka close previous candle ke direction mein hona chahiye. Agar pipe top ke baad ek bearish candle close hoti hai, toh yeh ek strong confirmation hoga. Wahi pipe bottom ke liye, agar ek bullish candle close hoti hai, toh yeh confirmation hoga.

        Volume


        Volume bhi ek important factor hai. Agar pipe pattern ke saath volume bhi high hai, toh yeh pattern aur bhi reliable hota hai. High volume ka matlab hai ke market mein bohot zyada activity hai aur trend reversal ke chances zyada hain.Risk management trading ka ek important aspect hai. Hamesha stop loss use karein. Pipe top pattern mein stop loss pehli bullish candle ke high ke upar lagayein aur pipe bottom pattern mein stop loss pehli bearish candle ke low ke neeche lagayein. Isse aapka loss control mein rahega agar market aapke against jaye.

        Take Profit


        Take profit levels set karna bhi zaroori hai. Pipe top pattern ke case mein aap previous support level ko apna take profit level bana sakte hain. Aur pipe bottom pattern ke case mein previous resistance level ko take profit level bana sakte hain.
        • #5 Collapse

          Pipe Tops and Pipe Bottom Candlestick Pattern.

          Click image for larger version

Name:	target.jpg
Views:	13
Size:	36.7 کلوبائٹ
ID:	13038361

          Pipe Tops.

          Introduction.

          Pipe Tops candlestick pattern aik bearish reversal pattern hoti hai jo market ke top pe form hoti hai. Ye pattern indicate karti hai ke price upar jane ke baad ab neeche aane wali hai.

          Formation.

          Ye pattern do candles se milke banti hai.
          1. Pehli Candle: Yeh ek lambi bullish candle hoti hai jo strong uptrend ko show karti hai.
          2. Dusri Candle: Dusri candle pehli candle ke high ke aas-paas open hoti hai aur ek lambi bearish candle banati hai jo pehli candle ke low se bhi neeche close hoti hai.

          Significance:
          • Yeh pattern batata hai ke market mein strength thi lekin sellers ne market ko dominate kar liya.
          • Is pattern ka meaning hai ke buyers ab weak ho gaye hain aur sellers strong ho gaye hain, jo future mein price decline ka indication hai.

          Confirmation:
          • Pattern ke baad ek bearish candle ka close hona confirmation hai.
          • Volume increase hona bhi important factor hai jo pattern ki validity ko support karta hai.

          Pipe Bottoms.

          Introduction.

          Pipe Bottoms candlestick pattern aik bullish reversal pattern hoti hai jo market ke bottom pe form hoti hai. Ye pattern indicate karti hai ke price neeche jane ke baad ab upar aane wali hai.

          Formation.

          Ye pattern do candles se milke banti hai.
          1. Pehli Candle: Yeh ek lambi bearish candle hoti hai jo strong downtrend ko show karti hai.
          2. Dusri Candle: Dusri candle pehli candle ke low ke aas-paas open hoti hai aur ek lambi bullish candle banati hai jo pehli candle ke high se bhi upar close hoti hai.

          Significance:
          • Yeh pattern batata hai ke market mein selling pressure tha lekin buyers ne market ko dominate kar liya.
          • Is pattern ka meaning hai ke sellers ab weak ho gaye hain aur buyers strong ho gaye hain, jo future mein price increase ka indication hai.

          Confirmation:
          • Pattern ke baad ek bullish candle ka close hona confirmation hai.
          • Volume increase hona bhi important factor hai jo pattern ki validity ko support karta hai.

          Pipe Tops aur Pipe Bottoms.

          Dono patterns market ke significant reversal points pe form hote hain. In patterns ko identify karke traders apni trading strategy ko adjust kar sakte hain aur potential profit ko maximize kar sakte hain.

          Risk Management:
          • Hamesha stop-loss use karna chahiye taake unexpected market movements se bach sakein.
          • Confirmation ke baad hi trade enter karni chahiye taake false signals se bacha ja sake.

          Importance of Volume:
          • Volume ka increase hona in patterns ki validity ko confirm karta hai.
          • Zyada volume matlab zyada traders involved hain, jo pattern ki strength ko confirm karta hai.

          Pipe Tops aur Pipe Bottoms patterns technical analysis mein important tools hain jo traders ko market trends ko samajhne aur profitable trading decisions lene mein madad karte hain.
          • #6 Collapse

            **Pipe Tops and Pipe Bottom Candlestick Patterns**
            Pipe Tops aur Pipe Bottoms forex aur stock market mein important candlestick patterns hote hain jo price reversals ko indicate karte hain. Yeh patterns typically trend reversal ke baad form hote hain aur traders ke liye significant signals provide karte hain.

            **Pipe Tops:**
            Pipe Tops ek bearish reversal pattern hote hain jo uptrend ke baad form hota hai. Is pattern mein price ek higher high banata hai, phir ek doosra attempt karta hai higher high banane ka lekin is baar price pehle se neeche close karta hai, indicating ke uptrend khatam ho raha hai aur bearish trend start hone ki possibility hai. Pipe Tops mein typically do ya zyada candles involved hotay hain jinmein se ek higher high aur doosra lower high form karta hai.

            **Pipe Bottoms:**
            Pipe Bottoms opposite pattern hote hain jinhe bullish reversal indicate karte hain downtrend ke baad. Is pattern mein price ek lower low banata hai, phir ek doosra attempt karta hai lower low banane ka lekin is baar price pehle se upar close karta hai, indicating ke downtrend khatam ho raha hai aur bullish trend start hone ki possibility hai. Pipe Bottoms mein bhi typically do ya zyada candles involved hotay hain jinmein se ek lower low aur doosra higher low form karta hai.

            **Trading Strategy:**
            Pipe Tops aur Pipe Bottoms patterns ko trade karne ke liye traders ko confirmation ki zaroorat hoti hai. Aam tor par, traders wait karte hain ke next candle jo pattern ko confirm karta hai uske close ke neeche ya upar entry ya stop loss place karte hain. Iske ilawa, volume aur additional technical indicators ka bhi istemal kiya jata hai confirmation ke liye.

            **Risk Management:**
            Jaise ke har trading pattern mein, risk management Pipe Tops aur Pipe Bottoms patterns mein bhi ahem hota hai. Stop loss placement aur position sizing ko carefully manage karna zaroori hai takay losses minimize kiye ja sake aur trades ko profitable banaya ja sake.

            Pipe Tops aur Pipe Bottoms patterns market psychology aur price action ke important indicators hote hain jo traders ko potential reversals identify karne mein madad dete hain. Lekin, in patterns ko successfully trade karne ke liye thorough understanding aur practice zaroori hai. Isliye, agar aap in patterns ko incorporate karna chahte hain apne trading strategy mein, to pehle demo accounts par practice karein aur strategies ko refine karein takay aapko patterns ko sahi tarah se recognize aur interpret karne mein expertise ho.
            • #7 Collapse

              **Pipe Tops aur Pipe Bottom Candlestick Patterns**
              Forex trading mein candlestick patterns ka bohot ahmiyat hota hai kyunke yeh market sentiment aur potential reversals ko indicate karte hain. Aaj hum discuss karenge Pipe Tops aur Pipe Bottom candlestick patterns jo ke reversal patterns hain aur trend reversal ke strong signals provide karte hain.

              ### Pipe Tops Candlestick Pattern

              Pipe Tops pattern aik bearish reversal pattern hai jo ke uptrend ke end pe banta hai. Yeh pattern indicate karta hai ke market mein buying pressure khatam ho raha hai aur selling pressure increase ho raha hai. Pipe Tops pattern do bullish candles se banta hai jo ke identical highs aur similar bodies rakhti hain. Yeh pattern tab confirm hota hai jab second candle close hoti hai aur price pehla candle ke high se neeche close hoti hai.

              #### Features of Pipe Tops:
              1. **Two Bullish Candles:** Pipe Tops do bullish candles se mil ke banta hai jo similar highs rakhti hain.
              2. **Identical Highs:** Dono candles ke highs identical ya bohot close hote hain.
              3. **Trend Reversal:** Yeh pattern uptrend ke baad appear hota hai aur bearish reversal ko indicate karta hai.

              #### How to Trade Pipe Tops:
              - Jab Pipe Tops pattern form ho, to yeh bearish signal hai. Traders ko apni long positions close karni chahiye aur short positions open karni chahiye.
              - Entry point usually second candle ke close hone pe hota hai.
              - Stop loss pehla candle ke high ke upar set karna chahiye.
              - Profit targets previous support levels ya technical analysis ke zariye set kiye ja sakte hain.

              ### Pipe Bottom Candlestick Pattern

              Pipe Bottom pattern aik bullish reversal pattern hai jo ke downtrend ke end pe banta hai. Yeh pattern indicate karta hai ke market mein selling pressure khatam ho raha hai aur buying pressure increase ho raha hai. Pipe Bottom pattern do bearish candles se banta hai jo ke identical lows aur similar bodies rakhti hain. Yeh pattern tab confirm hota hai jab second candle close hoti hai aur price pehla candle ke low se upar close hoti hai.

              #### Features of Pipe Bottoms:
              1. **Two Bearish Candles:** Pipe Bottom do bearish candles se mil ke banta hai jo similar lows rakhti hain.
              2. **Identical Lows:** Dono candles ke lows identical ya bohot close hote hain.
              3. **Trend Reversal:** Yeh pattern downtrend ke baad appear hota hai aur bullish reversal ko indicate karta hai.

              #### How to Trade Pipe Bottoms:
              - Jab Pipe Bottom pattern form ho, to yeh bullish signal hai. Traders ko apni short positions close karni chahiye aur long positions open karni chahiye.
              - Entry point usually second candle ke close hone pe hota hai.
              - Stop loss pehla candle ke low ke neeche set karna chahiye.
              - Profit targets previous resistance levels ya technical analysis ke zariye set kiye ja sakte hain.

              ### Conclusion

              Pipe Tops aur Pipe Bottom candlestick patterns forex trading mein important role play karte hain. Yeh patterns trend reversal ko indicate karte hain aur trading decisions mein madadgar hote hain. Lekin in patterns ko effectively trade karne ke liye practice aur proper analysis zaroori hai. Hamesha risk management strategies ko follow karein aur market conditions ko samajh kar trade karein.
              • #8 Collapse

                **Pipe Tops and Pipe Bottom Candlestick Pattern**

                Pipe Tops aur Pipe Bottom candlestick patterns trading mein bohot important role play karte hain. Yeh patterns traders ko market ki direction predict karne mein madad dete hain. Aayiye dekhte hain ke yeh patterns kya hain aur inko kaise identify kiya ja sakta hai.

                **Pipe Tops Candlestick Pattern**

                Pipe Tops pattern typically bullish trend ke end par banta hai aur bearish reversal indicate karta hai. Is pattern mein do consecutive candles hoti hain. Pehli candle ek lambi bullish candle hoti hai, jo ke market ke strong uptrend ko represent karti hai. Dusri candle bearish hoti hai, jo ke pehli candle ke high se thoda upar khulti hai aur pehli candle ke body ko puri tarah engulf karti hai.

                Pipe Tops ko identify karne ke liye, pehli candle ka high aur dusri candle ka high lagbhag same hona chahiye. Yeh pattern tab aur bhi significant ho jata hai jab yeh major resistance level par banta hai. Traders is pattern ko dekh kar apni bullish positions ko close kar sakte hain aur bearish positions ko initiate kar sakte hain.

                **Pipe Bottom Candlestick Pattern**

                Pipe Bottom pattern typically bearish trend ke end par banta hai aur bullish reversal indicate karta hai. Is pattern mein bhi do consecutive candles hoti hain. Pehli candle ek lambi bearish candle hoti hai, jo ke market ke strong downtrend ko represent karti hai. Dusri candle bullish hoti hai, jo ke pehli candle ke low se thoda niche khulti hai aur pehli candle ke body ko puri tarah engulf karti hai.

                Pipe Bottom ko identify karne ke liye, pehli candle ka low aur dusri candle ka low lagbhag same hona chahiye. Yeh pattern tab aur bhi significant ho jata hai jab yeh major support level par banta hai. Traders is pattern ko dekh kar apni bearish positions ko close kar sakte hain aur bullish positions ko initiate kar sakte hain.

                **Pipe Tops aur Pipe Bottom Patterns ka Importance**

                Yeh patterns traders ko market ke reversals ko pehchanne mein madad karte hain aur timely decisions lene mein assist karte hain. Lekin in patterns ko use karte waqt caution zaroori hai. Hamesha confirmation signals ka intezar karna chahiye aur dusre technical indicators ke saath combine karke analysis karna chahiye.

                Trading mein hamesha risk management ka dhyan rakhna chahiye. Stop-loss levels set karna aur apni trading strategy ko follow karna zaroori hai. Pipe Tops aur Pipe Bottom patterns ko samajhne aur effectively use karne se traders market mein better performance de sakte hain aur apne profits ko maximize kar sakte hain.

                Yeh patterns aapko market ki trends aur reversals ko behtar samajhne mein madad karenge aur aapko trading decisions lene mein confidence denge. Trading ko ek discipline ke saath karne se hi success hasil ki ja sakti hai.
                • #9 Collapse

                  Pipe Tops and Pipe Bottoms candlestick patterns:

                  Pipe Tops and Pipe Bottoms candlestick patterns yeh reversal patterns hain jo do ya do se zyada samay avadhiyon mein unchaiyon aur nichliyon ke aabhas mein sankoch ko darshaate hain, jisse chhote shareer aur lambi uppar aur niche ki chhayen wale candlesticks banate hain, jo ek pipe ke aakar ke saman hote hain.


                  Pipe Top pattern ek uptrend ke ant mein banta hai jab kimat unchai ke paas consolidation ki avadhi mein pravesh karti hai. yah coiling phase kharidar aur bikretaon ke bich sanchalan ko darshata hai kyunki bullish momentum samayik roop se kam hota hai. sanchari shrinkhala pratirodh dwara simit hai jo haliya kimat shirsh per hai.


                  Pipe Bottom pattern ek downtrend ke ant mein banta hai jab kimat nichli ke paas consolidation ki avadhi mein pravesh karti hai. yah coiling phase kharidar aur bikretaon ke bich sanchalan ko darshata hai kyunki bearish momentum samayik roop se kam hota hai. sanchari shrinkhala samarthan dwara simit hai jo haliya kimat ke nichle hisse per hai.


                  Pipe Tops aur Pipe Bottoms patterns ki pahchan kaise karen:
                  1. Do adjacent price spikes ki talash karen: pattern do adjacent price spikes se banta hai, jo ek baar mein ek bullish aur ek bearish candlestick ho sakta hai.
                  2. Candlesticks mein chhote shareer aur lambi uppar aur niche ki chhayen honi chahie: candlesticks mein chhote shareer hone chahie jo unke wicks ki tulna mein mahatvpurn roop se chhote hain. isase pata chalta hai ki kharidar aur bikretaon ke bich sanchalan hai.
                  3. Candlesticks ek dusre ke sath overlap hone chahie: candlesticks ko ek dusre ke sath overlap hona chahie, ya kam se kam unki lambai mein saman hona chahie. isase pata chalta hai ki do spikes ki shakti saman hai.
                  4. Pattern ek pramukh samarthan ya pratirodh star per banna chahie: pattern ko ek pramukh samarthan ya pratirodh star per banna chahie. yah is baat ka sanket hai ki iska trend per mahatvpurn prabhav padne ki sambhavna hai.


                  Pipe Tops aur Pipe Bottoms patterns ka vyapar kaise karen:
                  1. Trend ki tasdik karen: pattern ko vyapar karne se pahle, yah sunishchit karne ke liye trend ki tasdik karna mahatvpurn hai ki yah ek valid reversal pattern hai. aap iske liye trendlines, moving averages ya anya technical indicators ka upyog kar sakte hain.
                  2. Entry point ki pahchan karen: ek bar jab aap trend ki tasdik kar lete hain, to aapko entry point ki pahchan karne ki avashyakta hogi. pipe top pattern ke liye, entry point pattern ke nichle hisse se niche ek stop order hai. pipe bottom pattern ke liye, entry point pattern ke unche hisse se upar ek stop order hai.
                  3. stop loss ki sthapna karen: apne stop loss ko pattern ke andar rakhen. pipe top pattern ke liye, stop loss ko pattern ke nichle hisse se upar rakhen. pipe bottom pattern ke liye, stop loss ko pattern ke unche hisse se niche rakhen.
                  4. labh ka lakshya nirdharit karen: apne labh ka lakshya pattern ke aadhar per nirdharit karen. pipe top pattern ke liye, labh ka lakshya pattern ke nichle hisse se niche ki doori hai. pipe bottom pattern ke liye, labh ka lakshya pattern ke unche hisse se upar ki doori hai.


                  Pipe Tops aur Pipe Bottoms patterns ki seemaen:
                  • ye pattern sabhi samay samadhan nahin karte hain: koi bhi technical indicator 100% satik nahin hai, aur pipe top aur pipe bottom patterns koi apvad nahin hain. ye pattern kabhi-kabhi galat ho sakte hain, isliye stop loss ka upyog karna mahatvpurn hai.
                  • pattern ko anya sanketoon ke sath jodna mahatvpurn hai: koi bhi vyapar karne ka nirnay lene se pahle, pattern ko anya sanketoon ke sath jodna mahatvpurn hai. isase aapko pattern ki vishwasniiyata ka behtar muly
                  • <a href="https://www.instaforex.org/ru/?x=ruforum">InstaForex</a>
                  • #10 Collapse

                    Pipe Tops aur Pipe Bottoms candlestick patterns trading mein bohot important technical indicators hain, jo market mein reversal ko identify karne mein madad karte hain. Ye patterns trend ke khatam hone ki nishani hotay hain aur traders ko ye signal dete hain ke price action ab ulat sakta hai, yaani ek naye trend ka aghaz ho sakta hai. Pipe Tops aur Pipe Bottoms dono reversal patterns hain jo candlestick charts par form hotay hain. In patterns ka aik khas structure hota hai jo market mein potential trend reversal ko indicate karta hai. Dono patterns ke formation mein do consecutive candles hoti hain jo almost same high ya low par khul kar close hoti hain. Ye pattern aksar strong trends ke baad dekhne ko milte hain, jab market overbought ya oversold hoti hai.


                    Pipe Tops
                    Pipe Tops pattern ek bearish reversal pattern hai jo uptrend ke baad form hota hai. Is pattern mein do consecutive candles hoti hain jin ke highs almost equal hote hain, aur ye high points pattern ke pipes kehlate hain. Pipe Tops pattern tab form hota hai jab pehli candle bullish ho, lekin doosri candle bearish ho aur uska close pehli candle ke close se niche ho.

                    Pipe Bottoms
                    Pipe Bottoms pattern ek bullish reversal pattern hai jo downtrend ke baad form hota hai. Is pattern mein do consecutive candles hoti hain jin ke lows almost equal hote hain, aur ye low points pattern ke pipes kehlate hain. Pipe Bottoms pattern tab form hota hai jab pehli candle bearish ho, lekin doosri candle bullish ho aur uska close pehli candle ke close se upar ho.

                    Pipe Tops Aur Pipe Bottoms Ka Structure
                    Pipe Tops aur Pipe Bottoms patterns ke structure ko samajhna zaroori hai kyunki ye aapko pattern ko correctly identify karne mein madad karega.

                    Pipe Tops Ka Structure
                    Pipe Tops pattern mein pehli candle ek strong bullish candle hoti hai jo uptrend ko continue karti hai. Ye candle aksar market mein buyers ki strength ko highlight karti hai. Iske baad doosri candle bearish hoti hai, jo almost pehli candle ke high ke barabar open hoti hai, lekin phir niche close hoti hai. Ye bearish candle sellers ki strength ko dikhati hai aur ye signal deti hai ke uptrend ab khatam hone wala hai.

                    Is pattern ka khas structure kuch is tarah hota hai:
                    • Pehli Candle: Strong bullish candle, jo uptrend ko extend karti hai.
                    • Doosri Candle: Bearish candle, jo pehli candle ke high ke kareeb open hoti hai aur niche close hoti hai.
                    • Highs: Dono candles ke highs almost equal hote hain, jo pattern ko "pipes" ka appearance dete hain.
                    Pipe Bottoms Ka Structure
                    Pipe Bottoms pattern mein pehli candle ek strong bearish candle hoti hai jo downtrend ko continue karti hai. Ye candle market mein sellers ki strength ko dikhati hai. Iske baad doosri candle bullish hoti hai, jo almost pehli candle ke low ke barabar open hoti hai, lekin phir upar close hoti hai. Ye bullish candle buyers ki strength ko highlight karti hai aur ye signal deti hai ke downtrend ab khatam hone wala hai.

                    Is pattern ka khas structure kuch is tarah hota hai:
                    • Pehli Candle: Strong bearish candle, jo downtrend ko extend karti hai.
                    • Doosri Candle: Bullish candle, jo pehli candle ke low ke kareeb open hoti hai aur upar close hoti hai.
                    • Lows: Dono candles ke lows almost equal hote hain, jo pattern ko "pipes" ka appearance dete hain.
                    Pipe Tops Aur Pipe Bottoms Ki Psychology
                    Candlestick patterns ke peeche chhupi psychology ko samajhna trader ke liye bohot zaroori hai. Pipe Tops aur Pipe Bottoms ke patterns market participants ki psychology ko reflect karte hain, aur ye batate hain ke kis tarah buyers aur sellers apni positions adjust kar rahe hain.

                    Pipe Tops Ki Psychology
                    Pipe Tops pattern tab form hota hai jab market uptrend mein hoti hai aur buyers dominate kar rahe hote hain. Pehli bullish candle ke formation ke waqt, market mein optimism hota hai aur log ye samajhte hain ke prices aur barhengi. Lekin doosri candle ke formation ke waqt, market mein unexpected selling pressure shuru ho jata hai. Ye selling pressure itna zyada hota hai ke doosri candle bearish ban jati hai aur pehli candle ke close se niche close hoti hai.

                    Is pattern ke banne se ye signal milta hai ke buyers ab weak pad rahe hain aur sellers strong ho rahe hain. Ye pattern aksar overbought market mein form hota hai, jahan prices pehle hi bohot zyada barh chuki hoti hain aur market mein profit-taking ya trend reversal ki expectation hoti hai.

                    Pipe Bottoms Ki Psychology
                    Pipe Bottoms pattern tab form hota hai jab market downtrend mein hoti hai aur sellers dominate kar rahe hote hain. Pehli bearish candle ke formation ke waqt, market mein pessimism hota hai aur log ye samajhte hain ke prices aur girengi. Lekin doosri candle ke formation ke waqt, market mein unexpected buying pressure shuru ho jata hai. Ye buying pressure itna zyada hota hai ke doosri candle bullish ban jati hai aur pehli candle ke close se upar close hoti hai.

                    Is pattern ke banne se ye signal milta hai ke sellers ab weak pad rahe hain aur buyers strong ho rahe hain. Ye pattern aksar oversold market mein form hota hai, jahan prices pehle hi bohot zyada gir chuki hoti hain aur market mein short-covering ya trend reversal ki expectation hoti hai.

                    Pipe Tops Aur Pipe Bottoms Ki Formation Ke Elements
                    Pipe Tops aur Pipe Bottoms patterns ki formation ke liye kuch khas elements ki zaroorat hoti hai. In elements ka hona pattern ki tasdeeq karta hai aur trading decisions lene mein madadgar sabit hota hai.

                    Trend Ka Hona
                    Pipe Tops aur Pipe Bottoms patterns sirf tab form hote hain jab market mein koi strong trend chal raha ho. Pipe Tops ke liye, uptrend ka hona zaroori hai, jab ke Pipe Bottoms ke liye downtrend ka hona zaroori hai. Agar market mein koi clear trend nahi hai, to ye patterns unreliable ho sakte hain.

                    Candle Ki Size Aur Structure
                    Ye patterns tab zyada reliable hote hain jab pehli candle ka size kaafi bara ho aur doosri candle uske against ho. Iska matlab ye hai ke pehli candle buyers ya sellers ki strong momentum ko dikhati hai, lekin doosri candle us momentum ko reverse kar deti hai. Pehli candle ke high ya low par doosri candle ka close hona bohot zaroori hai, taake pattern ki formation clear ho sake.

                    Volume Ka Analysis
                    Volume bhi in patterns ki confirmation mein bohot ahm hota hai. Jab Pipe Tops ya Pipe Bottoms pattern form ho raha hota hai, to doosri candle ke waqt volume ka zyada hona pattern ki reliability ko badhata hai. High volume ka matlab ye hota hai ke market participants ne apni positions ko actively adjust kiya hai, jo ke trend reversal ka strong signal hai.

                    Pipe Tops Aur Pipe Bottoms Patterns Ko Trade Karne Ki Strategies
                    Pipe Tops aur Pipe Bottoms patterns ko effectively trade karne ke liye kuch specific strategies ka istemal kiya ja sakta hai. Ye strategies aapko market mein entry aur exit points identify karne mein madad karti hain.

                    Pipe Tops Pattern Ko Trade Karna
                    1. Entry Point: Pipe Tops pattern mein entry ka best point us waqt hota hai jab doosri bearish candle close ho jaye. Aap bearish entry lay sakte hain jab doosri candle pehli candle ke close se niche close ho.
                    2. Stop Loss Placement: Stop loss ko pehli candle ke high ke upar place karna chahiye. Agar price pattern ke baad wahan tak wapas jati hai, to iska matlab hai ke pattern fail ho gaya hai, aur aapko apni position se exit kar lena chahiye.
                    3. Profit Target: Profit target set karte waqt aap previous support levels ka analysis kar sakte hain. Price aksar previous support levels tak jati hai agar Pipe Tops pattern valid ho. Aap trailing stop loss ka bhi istemal kar sakte hain taake trend ke continuation ka fayda uthaya ja sake.
                    Pipe Bottoms Pattern Ko Trade Karna
                    1. Entry Point: Pipe Bottoms pattern mein entry ka best point us waqt hota hai jab doosri bullish candle close ho jaye. Aap bullish entry lay sakte hain jab doosri candle pehli candle ke close se upar close ho.
                    2. Stop Loss Placement: Stop loss ko pehli candle ke low ke niche place karna chahiye. Agar price pattern ke baad wahan tak wapas jati hai, to iska matlab hai ke pattern fail ho gaya hai, aur aapko apni position se exit kar lena chahiye.
                    3. Profit Target: Profit target set karte waqt aap previous resistance levels ka analysis kar sakte hain. Price aksar previous resistance levels tak jati hai agar Pipe Bottoms pattern valid ho. Aap trailing stop loss ka bhi istemal kar sakte hain taake trend ke continuation ka fayda uthaya ja sake.
                    Pipe Tops Aur Pipe Bottoms Ki Limitations
                    Har trading pattern ki tarah, Pipe Tops aur Pipe Bottoms patterns ki bhi kuch limitations hoti hain. In limitations ko samajhna zaroori hai taake aap apni trading strategy ko inke mutabiq adjust kar sakein.
                    1. False Signals: Ye patterns kabhi kabhi false signals bhi de sakte hain, khas tor par jab market mein koi clear trend na ho. Isliye, in patterns ko confirm karne ke liye doosre technical indicators ka istemal karna zaroori hota hai.
                    2. Market Conditions: Ye patterns har market condition mein effective nahi hote. Volatile ya choppy markets mein in patterns ka analysis karna mushkil ho sakta hai, aur is waqt in patterns par sirf reliance karna risky ho sakta hai.
                    3. Short-term Reversals: Pipe Tops aur Pipe Bottoms patterns aksar short-term trend reversals ko indicate karte hain. Long-term trend ke liye ye patterns hamesha reliable nahi hote. Isliye, agar aap long-term trends ko trade kar rahe hain, to aapko doosre indicators ka bhi analysis karna chahiye.
                    4. News aur Economic Events: Kabhi kabhi market mein unexpected news ya economic events ki wajah se ye patterns fail bhi ho sakte hain. Market sentiments jaldi se badal sakte hain, jo in patterns ko invalidate kar sakte hain.


                    Real-World Application of Pipe Tops Aur Pipe Bottoms Patterns
                    Ab hum kuch real-world examples aur practical applications ko dekhte hain jahan Pipe Tops aur Pipe Bottoms patterns trading mein useful sabit hotay hain.

                    Stock Market
                    Stock market mein Pipe Tops aur Pipe Bottoms patterns kaafi common hain. Yeh patterns aksar major news announcements ya earnings reports ke baad dekhne ko milte hain. Agar kisi stock mein pehle se ek trend chal raha ho aur phir earnings report ke baad Pipe Tops ya Pipe Bottoms pattern form ho, to yeh strong indication hoti hai ke trend reverse ho sakta hai.

                    Forex Market
                    Forex market mein bhi ye patterns kaafi useful hote hain, khas tor par jab central banks monetary policy changes announce karte hain. Forex pairs mein volatility bohot hoti hai, aur is wajah se ye patterns aksar short-term trend reversals ko accurately predict karte hain.

                    Commodities Market
                    Commodities market mein, jaise ke oil, gold, aur silver, Pipe Tops aur Pipe Bottoms patterns dekhne ko milte hain. Ye patterns aksar geopolitical tensions ya major economic data releases ke baad form hote hain, aur yeh market participants ko trend reversal ke liye tayar karte hain.

                    Pipe Tops aur Pipe Bottoms candlestick patterns trading mein significant role ada karte hain. Ye patterns market mein trend reversals ko identify karne mein madadgar hote hain, aur agar inko sahi tareeke se samajh kar apply kiya jaye to ye profitable trading opportunities provide kar sakte hain. Lekin, in patterns ko independently use karne ke bajaye, aapko doosre technical indicators ka bhi analysis karna chahiye, aur market conditions ka bhi khayal rakhna chahiye. Trading mein success ka raaz ye hai ke aap apni strategies ko market ke mutabiq adjust karein, aur hamesha disciplined approach rakhein. Trading ek complex aur challenging field hai, lekin agar aap technical analysis ko sahi tareeke se seekh lein, to aap market mein profitable opportunities ko pehchan kar sakte hain aur apne trading goals ko achieve kar sakte hain. Pipe Tops aur Pipe Bottoms patterns aapko is raaste par ek extra edge de sakte hain.
                    Believe in yourself and your abilities. When you fight for your dreams, you can achieve anything.

                    اب آن لائن

                    Working...
                    X