Island Reversal Pattern
No announcement yet.
X
  • وقت
  • دکھائیں
Clear All
new posts
  • #16 Collapse


    Island Reversal Pattern


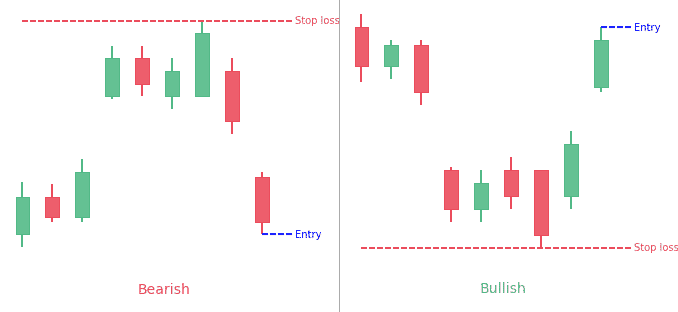
    The Island Reversal Pattern is a technical analysis chart pattern used in stock trading to indicate a potential reversal in the direction of a trend. It is characterized by a gap in price action that isolates a small trading range, resembling an "island."

    Here’s how it works:
    1. Uptrend or Downtrend: The pattern forms after a significant uptrend (bullish island reversal) or downtrend (bearish island reversal).
    2. Gap: A gap forms, where the price moves sharply higher (or lower) from the previous day's closing price, creating an island of price bars isolated from the preceding price action.
    3. Consolidation: The price then trades within a narrow range for a period, forming the island.
    4. Reversal Gap: Another gap occurs in the opposite direction of the initial gap, indicating a reversal in trend.

    The appearance of the second gap, often accompanied by high trading volume, confirms the pattern and suggests a strong potential for a trend reversal.

    Example of a Bullish Island Reversal Pattern:
    • An uptrend pauses with a gap up, followed by a period of consolidation.
    • A gap down follows, signaling the end of the uptrend and the start of a downtrend.

    Example of a Bearish Island Reversal Pattern:
    • A downtrend pauses with a gap down, followed by a period of consolidation.
    • A gap up follows, signaling the end of the downtrend and the start of an uptrend.

    This pattern is considered more significant when it occurs after a prolonged trend and is often used by traders to anticipate potential changes in market direction.
    Sure, let's dive into more detail about the Island Reversal Pattern.
    Characteristics of the Island Reversal Pattern
    1. Trend: The pattern typically forms after a sustained trend, either bullish or bearish. The strength and duration of the preceding trend can affect the reliability of the pattern.
    2. Gap Up (or Down):
      • Bullish Island Reversal: In a downtrend, the market gaps down, creating a significant price difference between the previous day’s close and the current day’s open.
      • Bearish Island Reversal: In an uptrend, the market gaps up, creating a significant price difference between the previous day’s close and the current day’s open.
    3. Trading Range: After the gap, the price consolidates within a narrow range, forming the "island." This range can last for a few days or even weeks, but the key is that it remains relatively narrow and stable.
    4. Reversal Gap:
      • Bullish Island Reversal: After the consolidation, the market gaps up, leaving the isolated "island" behind and indicating a reversal from the downtrend to an uptrend.
      • Bearish Island Reversal: After the consolidation, the market gaps down, leaving the isolated "island" behind and indicating a reversal from the uptrend to a downtrend.
    5. Volume: The volume is often higher during the formation of the gaps, particularly the reversal gap, which adds to the pattern’s reliability. Increased volume indicates strong interest and conviction in the new trend direction.
    Example of a Bullish Island Reversal Pattern
    1. Downtrend: The stock has been in a downtrend, with prices consistently falling.
    2. Gap Down: The price gaps down sharply, creating a significant drop from the previous close.
    3. Consolidation: After the gap down, the price consolidates within a narrow range, forming the "island."
    4. Gap Up: The price then gaps up sharply, breaking above the consolidation range and indicating a reversal to an uptrend.
    5. Confirmation: The pattern is confirmed by an increase in trading volume during the gap up, reinforcing the bullish signal.
    Example of a Bearish Island Reversal Pattern
    1. Uptrend: The stock has been in an uptrend, with prices consistently rising.
    2. Gap Up: The price gaps up sharply, creating a significant rise from the previous close.
    3. Consolidation: After the gap up, the price consolidates within a narrow range, forming the "island."
    4. Gap Down: The price then gaps down sharply, breaking below the consolidation range and indicating a reversal to a downtrend.
    5. Confirmation: The pattern is confirmed by an increase in trading volume during the gap down, reinforcing the bearish signal.
    Key Points to Remember
    • Gaps: The gaps are crucial to the island reversal pattern. Without clear gaps, the pattern may not be reliable.
    • Volume: Higher volume during the gaps, especially the reversal gap, strengthens the pattern's signal.
    • Trend: The preceding trend must be well-defined. A weak or short trend may reduce the pattern's effectiveness.
    • Time Frame: The island can form over various time frames, but it’s more significant when observed over daily or weekly charts.
    Practical Application
    • Entry Point: Traders often enter a position when the reversal gap forms, confirming the pattern. For a bullish island reversal, this would be entering a long position; for a bearish island reversal, entering a short position.
    • Stop-Loss: Setting a stop-loss just below the low of the island for a bullish pattern, or above the high of the island for a bearish pattern, can help manage risk.
    • Target: The price target can be set based on the height of the preceding trend or other technical indicators such as moving averages or previous support/resistance levels.

    By understanding and identifying the Island Reversal Pattern, traders can make more informed decisions about potential trend reversals in the market.


     
    • <a href="https://www.instaforex.org/ru/?x=ruforum">InstaForex</a>
    • #17 Collapse


      Island Reversal Pattern


      The Island Reversal Pattern is a technical analysis chart pattern used in stock trading to indicate a potential reversal in the direction of a trend. It is characterized by a gap in price action that isolates a small trading range, resembling an "island."

      Here’s how it works:
      1. Uptrend or Downtrend: The pattern forms after a significant uptrend (bullish island reversal) or downtrend (bearish island reversal).
      2. Gap: A gap forms, where the price moves sharply higher (or lower) from the previous day's closing price, creating an island of price bars isolated from the preceding price action.
      3. Consolidation: The price then trades within a narrow range for a period, forming the island.
      4. Reversal Gap: Another gap occurs in the opposite direction of the initial gap, indicating a reversal in trend.

      The appearance of the second gap, often accompanied by high trading volume, confirms the pattern and suggests a strong potential for a trend reversal.

      Example of a Bullish Island Reversal Pattern:
      • An uptrend pauses with a gap up, followed by a period of consolidation.
      • A gap down follows, signaling the end of the uptrend and the start of a downtrend.

      Example of a Bearish Island Reversal Pattern:
      • A downtrend pauses with a gap down, followed by a period of consolidation.
      • A gap up follows, signaling the end of the downtrend and the start of an uptrend.

      This pattern is considered more significant when it occurs after a prolonged trend and is often used by traders to anticipate potential changes in market direction.
      Sure, let's dive into more detail about the Island Reversal Pattern.
      Characteristics of the Island Reversal Pattern
      1. Trend: The pattern typically forms after a sustained trend, either bullish or bearish. The strength and duration of the preceding trend can affect the reliability of the pattern.
      2. Gap Up (or Down):
        • Bullish Island Reversal: In a downtrend, the market gaps down, creating a significant price difference between the previous day’s close and the current day’s open.
        • Bearish Island Reversal: In an uptrend, the market gaps up, creating a significant price difference between the previous day’s close and the current day’s open.
      3. Trading Range: After the gap, the price consolidates within a narrow range, forming the "island." This range can last for a few days or even weeks, but the key is that it remains relatively narrow and stable.
      4. Reversal Gap:
        • Bullish Island Reversal: After the consolidation, the market gaps up, leaving the isolated "island" behind and indicating a reversal from the downtrend to an uptrend.
        • Bearish Island Reversal: After the consolidation, the market gaps down, leaving the isolated "island" behind and indicating a reversal from the uptrend to a downtrend.
      5. Volume: The volume is often higher during the formation of the gaps, particularly the reversal gap, which adds to the pattern’s reliability. Increased volume indicates strong interest and conviction in the new trend direction.
      Example of a Bullish Island Reversal Pattern
      1. Downtrend: The stock has been in a downtrend, with prices consistently falling.
      2. Gap Down: The price gaps down sharply, creating a significant drop from the previous close.
      3. Consolidation: After the gap down, the price consolidates within a narrow range, forming the "island."
      4. Gap Up: The price then gaps up sharply, breaking above the consolidation range and indicating a reversal to an uptrend.
      5. Confirmation: The pattern is confirmed by an increase in trading volume during the gap up, reinforcing the bullish signal.
      Example of a Bearish Island Reversal Pattern
      1. Uptrend: The stock has been in an uptrend, with prices consistently rising.
      2. Gap Up: The price gaps up sharply, creating a significant rise from the previous close.
      3. Consolidation: After the gap up, the price consolidates within a narrow range, forming the "island."
      4. Gap Down: The price then gaps down sharply, breaking below the consolidation range and indicating a reversal to a downtrend.
      5. Confirmation: The pattern is confirmed by an increase in trading volume during the gap down, reinforcing the bearish signal.
      Key Points to Remember
      • Gaps: The gaps are crucial to the island reversal pattern. Without clear gaps, the pattern may not be reliable.
      • Volume: Higher volume during the gaps, especially the reversal gap, strengthens the pattern's signal.
      • Trend: The preceding trend must be well-defined. A weak or short trend may reduce the pattern's effectiveness.
      • Time Frame: The island can form over various time frames, but it’s more significant when observed over daily or weekly charts.
      Practical Application
      • Entry Point: Traders often enter a position when the reversal gap forms, confirming the pattern. For a bullish island reversal, this would be entering a long position; for a bearish island reversal, entering a short position.
      • Stop-Loss: Setting a stop-loss just below the low of the island for a bullish pattern, or above the high of the island for a bearish pattern, can help manage risk.
      • Target: The price target can be set based on the height of the preceding trend or other technical indicators such as moving averages or previous support/resistance levels.

      By understanding and identifying the Island Reversal Pattern, traders can make more informed decisions about potential trend reversals in the marke


      • #18 Collapse


        Island Reversal Pattern


        The Island Reversal Pattern is a technical analysis chart pattern used in stock trading to indicate a potential reversal in the direction of a trend. It is characterized by a gap in price action that isolates a small trading range, resembling an "island."

        Here’s how it works:
        1. Uptrend or Downtrend: The pattern forms after a significant uptrend (bullish island reversal) or downtrend (bearish island reversal).
        2. Gap: A gap forms, where the price moves sharply higher (or lower) from the previous day's closing price, creating an island of price bars isolated from the preceding price action.
        3. Consolidation: The price then trades within a narrow range for a period, forming the island.
        4. Reversal Gap: Another gap occurs in the opposite direction of the initial gap, indicating a reversal in trend.

        The appearance of the second gap, often accompanied by high trading volume, confirms the pattern and suggests a strong potential for a trend reversal.

        Example of a Bullish Island Reversal Pattern:
        • An uptrend pauses with a gap up, followed by a period of consolidation.
        • A gap down follows, signaling the end of the uptrend and the start of a downtrend.

        Example of a Bearish Island Reversal Pattern:
        • A downtrend pauses with a gap down, followed by a period of consolidation.
        • A gap up follows, signaling the end of the downtrend and the start of an uptrend.

        This pattern is considered more significant when it occurs after a prolonged trend and is often used by traders to anticipate potential changes in market direction
        Sure, let's dive into more detail about the Island Reversal Pattern.
        Characteristics of the Island Reversal Pattern
        1. Trend: The pattern typically forms after a sustained trend, either bullish or bearish. The strength and duration of the preceding trend can affect the reliability of the pattern.
        2. Gap Up (or Down):
          • Bullish Island Reversal: In a downtrend, the market gaps down, creating a significant price difference between the previous day’s close and the current day’s open.
          • Bearish Island Reversal: In an uptrend, the market gaps up, creating a significant price difference between the previous day’s close and the current day’s open.
        3. Trading Range: After the gap, the price consolidates within a narrow range, forming the "island." This range can last for a few days or even weeks, but the key is that it remains relatively narrow and stable.
        4. Reversal Gap:
          • Bullish Island Reversal: After the consolidation, the market gaps up, leaving the isolated "island" behind and indicating a reversal from the downtrend to an uptrend.
          • Bearish Island Reversal: After the consolidation, the market gaps down, leaving the isolated "island" behind and indicating a reversal from the uptrend to a downtrend.
        5. Volume: The volume is often higher during the formation of the gaps, particularly the reversal gap, which adds to the pattern’s reliability. Increased volume indicates strong interest and conviction in the new trend direction.
        Example of a Bullish Island Reversal Pattern
        1. Downtrend: The stock has been in a downtrend, with prices consistently falling.
        2. Gap Down: The price gaps down sharply, creating a significant drop from the previous close.
        3. Consolidation: After the gap down, the price consolidates within a narrow range, forming the "island."
        4. Gap Up: The price then gaps up sharply, breaking above the consolidation range and indicating a reversal to an uptrend.
        5. Confirmation: The pattern is confirmed by an increase in trading volume during the gap up, reinforcing the bullish signal.
        Example of a Bearish Island Reversal Pattern
        1. Uptrend: The stock has been in an uptrend, with prices consistently rising.
        2. Gap Up: The price gaps up sharply, creating a significant rise from the previous close.
        3. Consolidation: After the gap up, the price consolidates within a narrow range, forming the "island."
        4. Gap Down: The price then gaps down sharply, breaking below the consolidation range and indicating a reversal to a downtrend.
        5. Confirmation: The pattern is confirmed by an increase in trading volume during the gap down, reinforcing the bearish signal.
        Key Points to Remember
        • Gaps: The gaps are crucial to the island reversal pattern. Without clear gaps, the pattern may not be reliable.
        • Volume: Higher volume during the gaps, especially the reversal gap, strengthens the pattern's signal.
        • Trend: The preceding trend must be well-defined. A weak or short trend may reduce the pattern's effectiveness.
        • Time Frame: The island can form over various time frames, but it’s more significant when observed over daily or weekly charts.
        Practical Application
        • Entry Point: Traders often enter a position when the reversal gap forms, confirming the pattern. For a bullish island reversal, this would be entering a long position; for a bearish island reversal, entering a short position.
        • Stop-Loss: Setting a stop-loss just below the low of the island for a bullish pattern, or above the high of the island for a bearish pattern, can help manage risk.
        • Target: The price target can be set based on the height of the preceding trend or other technical indicators such as moving averages or previous support/resistance levels.

        By understanding and identifying the Island Reversal Pattern, traders can make more informed decisions about potential trend reversals in the market.


        • #19 Collapse

          Island Reversal Pattern?


          **Island Reversal Pattern (جزیرہ اُلٹاؤ پیٹرن)**
          Island Reversal Pattern ek technical analysis pattern hai jo candlestick charts par dekhne ko milta hai aur yeh trend reversal indicate karta hai. Yeh pattern typically ek price gap ke baad dekha jata hai jahan market ek chhota cluster ya group of candles form karta hai, jise hum "island" kehte hain, phir ek aur gap ke baad price direction reverse hota hai.

          **Island Reversal Pattern ki Tashreeh:**

          1. **Formation**: Island reversal pattern formation mein do gaps hote hain:
          - **Upar ka Gap**: Pehla gap upar ki taraf hota hai, jo price ek sudden jump karta hai. Yeh gap bullish market sentiment ko indicate karta hai.
          - **Niche ka Gap**: Dusra gap neeche ki taraf hota hai, jo ek sudden downward movement ko show karta hai. Yeh gap bearish reversal ki shuruwat indicate karta hai.

          2. **Island**: Gaps ke beech mein ek chhota cluster ya group of candles hota hai jise hum island kehte hain. Yeh island doji, spinning top, ya kisi aur short-term reversal candlesticks se bhi form ho sakta hai.

          3. **Volume**: Island reversal pattern mein volume ki bhi importance hoti hai. Pehle gap ke samay volume usually increase hota hai, indicating strong buying or selling pressure. Island ke dauran volume generally low hota hai, indicating lack of participation ya consolidation phase.

          4. **Confirmation**: Island reversal pattern ko confirm karne ke liye traders typically next few candles ka price action dekhte hain. Agar price usi direction mein continue karta hai jisme ki second gap hua tha (upar ka gap ke baad neeche jaana ya niche ka gap ke baad upar jaana), toh yeh pattern confirm hota hai.

          5. **Trading Implications**: Jab island reversal pattern confirm hota hai, toh traders uske based par apne trading decisions lenge:
          - **Short Positions**: Agar pattern bearish hai (upar ka gap ke baad neeche jaana), toh traders sell positions le sakte hain expecting further downward movement.
          - **Long Positions**: Agar pattern bullish hai (niche ka gap ke baad upar jaana), toh traders buy positions le sakte hain expecting upward movement.

          Island reversal pattern ek powerful indicator hai market sentiment aur trend reversal ke liye, lekin isko correctly identify karna aur confirm karna zaroori hai. Traders ko yeh pattern samajhne ke liye practice aur experience ki zaroorat hoti hai taake sahi time par entries aur exits kar sakein.

          • #20 Collapse

            **Island Reversal Pattern**
            Island reversal pattern forex aur stock markets mein ek pramukh technical analysis pattern hai jo price trends ke reversals ko identify karne mein madad karta hai. Ye pattern traders ke liye important hota hai kyunki isse market ke direction ke changes ko samajhna aur trading decisions lena aasan ho jata hai.

            **Kaise Kaam Karta Hai?**

            Island reversal pattern tab hota hai jab price ek gap ke baad upar ya neeche move karta hai, phir ek aur gap ke baad opposite direction mein move karta hai, jisse price ek 'island' create karta hai jisme ek gap hota hai. Ye pattern usually short-term reversals ko indicate karta hai aur price movement ke sudden changes ko highlight karta hai. Island reversal pattern ka effect tab hota hai jab price gaps ke through move karta hai, jisse previous trend ka reversal signal samajha jata hai.

            **Characteristics**

            Island reversal pattern ke kuch mukhya gun hain:

            - **Gaps:** Is pattern mein price ke around gaps hote hain jo ki previous price action se alag hote hain.

            - **Island Formation:** Price movement se ek island shape ban jata hai jisme ek gap hota hai jo previous aur future price action se alag hota hai.

            - **Volume:** Island reversal pattern ko confirm karne ke liye traders volume ko bhi dekhte hain. Agar reversal pattern ke dauran volume increase hota hai, to ye pattern stronger consider hota hai.

            **Types**

            Island reversal pattern ke do prakar hote hain:

            1. **Bearish Island Reversal:** Jab price ek gap ke baad upar move karta hai, phir ek gap ke baad neeche move karta hai, tab bearish island reversal pattern samjha jata hai. Isse market ke bearish trend ka indication hota hai.

            2. **Bullish Island Reversal:** Jab price ek gap ke baad neeche move karta hai, phir ek gap ke baad upar move karta hai, tab bullish island reversal pattern samjha jata hai. Isse market ke bullish trend ka indication hota hai.

            **Trading Strategy**

            Island reversal pattern ko samajhne ke baad traders iska istemal karke trading strategies develop karte hain:

            - **Confirmation:** Island reversal pattern ko confirm karne ke liye traders volume aur other technical indicators ka istemal karte hain.

            - **Entry and Exit Points:** Jab price gap ke baad move karta hai, tab traders entry aur exit points determine karte hain based on trend reversal expectations.

            **Conclusion**

            Island reversal pattern ek important technical analysis tool hai jo traders ko price trends ke reversals ko detect karne mein madad karta hai. Iska sahi istemal karke traders apne trading decisions ko improve kar sakte hain aur market mein successful trading karne ke chances ko badha sakte hain. Island reversal pattern ki understanding aur uska sahi istemal karna traders ke liye zaroori hai jo market mein consistent aur profitable trading karna chahte hain.
            • #21 Collapse

              Island Reversal Pattern ek candlestick chart pattern hai jo trading aur technical analysis mein use hota hai. Yeh pattern market ke trend mein ek sudden aur sharp reversal ko indicate karta hai. Yeh pattern do types ka hota hai: Island Top Reversal aur Island Bottom Reversal. Dono patterns mein ek chhoti si consolidation ya gap formation hoti hai jo market ke direction ko abruptly change kar deti hai.

              Island Top Reversal pattern tab banta hai jab ek uptrend chal raha hota hai aur suddenly ek gap up opening ke baad ek chhoti si consolidation phase hoti hai. Uske baad, ek gap down opening hoti hai jo prices ko previous consolidation ke neeche le jati hai. Is pattern ka matlab hota hai ke buyers ab weak ho gaye hain aur sellers market control mein aa gaye hain. Is pattern ka paida hone ke baad, market usually downtrend mein chali jati hai.

              Island Bottom Reversal pattern bhi kuch aise hi kaam karta hai, magar ulta. Yeh pattern tab banta hai jab ek downtrend chal raha hota hai aur suddenly ek gap down opening ke baad ek chhoti si consolidation phase hoti hai. Uske baad, ek gap up opening hoti hai jo prices ko previous consolidation ke upar le jati hai. Iska matlab hota hai ke sellers weak ho gaye hain aur buyers market control mein aa gaye hain. Is pattern ka paida hone ke baad, market usually uptrend mein chali jati hai.

              Island Reversal Patterns ko identify karna technical analysis ka ek important part hai, kyun ke yeh patterns market ke trend ko effectively predict kar sakte hain. In patterns ko dekh kar traders apni trading strategies ko adjust kar sakte hain aur potential profits ko maximize kar sakte hain.

              Yeh patterns aksar high volume ke sath associated hote hain, jo inki reliability ko aur bhi enhance karta hai. High volume ka matlab hota hai ke market participants ne aggressively trade kiya hai, jo ek strong signal hota hai ke trend reversal ka chance zyada hai.

              Island Reversal Pattern ko dekh kar traders kuch specific trading strategies adopt kar sakte hain. For example, ek Island Top Reversal pattern dekh kar trader short position le sakta hai, ya apni existing long positions ko close kar sakta hai. Isi tarah, ek Island Bottom Reversal pattern dekh kar trader long position le sakta hai, ya apni existing short positions ko close kar sakta hai.

              Yeh pattern aksar important support aur resistance levels ke kareeb banta hai, jo iski significance ko aur bhi badha deta hai. Isliye, traders ko yeh patterns identify karte waqt support aur resistance levels ko bhi dhyan mein rakhna chahiye.

              Technical indicators jaise ke moving averages, relative strength index (RSI), aur volume analysis ko bhi Island Reversal Pattern ke sath use kiya ja sakta hai taake signal ki accuracy ko enhance kiya ja sake. Yeh indicators help karte hain trend strength aur momentum ko assess karne mein, jo trading decisions ko aur bhi solid banata hai.

              In conclusion, Island Reversal Pattern ek powerful tool hai jo market trends ko effectively predict kar sakta hai. Is pattern ko accurately identify karna aur appropriate trading strategies ko implement karna traders ko significant profits earn karne mein madad kar sakta hai. Yeh pattern market psychology aur participant behavior ko bhi reflect karta hai, jo iski importance ko aur bhi badha deta hai. Isliye, traders ko is pattern ko apne technical analysis toolkit mein zaroor include karna chahiye
              • <a href="https://www.instaforex.org/ru/?x=ruforum">InstaForex</a>
              • #22 Collapse


                Island Reversal Pattern?


                **Island Reversal Pattern (جزیرہ اُلٹاؤ پیٹرن)**
                Island Reversal Pattern ek technical analysis pattern hai jo candlestick charts par dekhne ko milta hai aur yeh trend reversal indicate karta hai. Yeh pattern typically ek price gap ke baad dekha jata hai jahan market ek chhota cluster ya group of candles form karta hai, jise hum "island" kehte hain, phir ek aur gap ke baad price direction reverse hota hai.

                **Island Reversal Pattern ki Tashreeh:**

                1. **Formation**: Island reversal pattern formation mein do gaps hote hain:
                - **Upar ka Gap**: Pehla gap upar ki taraf hota hai, jo price ek sudden jump karta hai. Yeh gap bullish market sentiment ko indicate karta hai.
                - **Niche ka Gap**: Dusra gap neeche ki taraf hota hai, jo ek sudden downward movement ko show karta hai. Yeh gap bearish reversal ki shuruwat indicate karta hai.

                2. **Island**: Gaps ke beech mein ek chhota cluster ya group of candles hota hai jise hum island kehte hain. Yeh island doji, spinning top, ya kisi aur short-term reversal candlesticks se bhi form ho sakta hai.

                3. **Volume**: Island reversal pattern mein volume ki bhi importance hoti hai. Pehle gap ke samay volume usually increase hota hai, indicating strong buying or selling pressure. Island ke dauran volume generally low hota hai, indicating lack of participation ya consolidation phase.

                4. **Confirmation**: Island reversal pattern ko confirm karne ke liye traders typically next few candles ka price action dekhte hain. Agar price usi direction mein continue karta hai jisme ki second gap hua tha (upar ka gap ke baad neeche jaana ya niche ka gap ke baad upar jaana), toh yeh pattern confirm hota hai.

                5. **Trading Implications**: Jab island reversal pattern confirm hota hai, toh traders uske based par apne trading decisions lenge:
                - **Short Positions**: Agar pattern bearish hai (upar ka gap ke baad neeche jaana), toh traders sell positions le sakte hain expecting further downward movement.
                - **Long Positions**: Agar pattern bullish hai (niche ka gap ke baad upar jaana), toh traders buy positions le sakte hain expecting upward movement.

                Island reversal pattern ek powerful indicator hai market sentiment aur trend reversal ke liye, lekin isko correctly identify karna aur confirm karna zaroori hai.


                **Island Reversal Pattern**
                Island reversal pattern forex aur stock markets mein ek pramukh technical analysis pattern hai jo price trends ke reversals ko identify karne mein madad karta hai. Ye pattern traders ke liye important hota hai kyunki isse market ke direction ke changes ko samajhna aur trading decisions lena aasan ho jata hai.

                **Kaise Kaam Karta Hai?**

                Island reversal pattern tab hota hai jab price ek gap ke baad upar ya neeche move karta hai, phir ek aur gap ke baad opposite direction mein move karta hai, jisse price ek 'island' create karta hai jisme ek gap hota hai. Ye pattern usually short-term reversals ko indicate karta hai aur price movement ke sudden changes ko highlight karta hai. Island reversal pattern ka effect tab hota hai jab price gaps ke through move karta hai, jisse previous trend ka reversal signal samajha jata hai.

                **Characteristics**

                Island reversal pattern ke kuch mukhya gun hain:

                - **Gaps:** Is pattern mein price ke around gaps hote hain jo ki previous price action se alag hote hain.

                - **Island Formation:** Price movement se ek island shape ban jata hai jisme ek gap hota hai jo previous aur future price action se alag hota hai.

                - **Volume:** Island reversal pattern ko confirm karne ke liye traders volume ko bhi dekhte hain. Agar reversal pattern ke dauran volume increase hota hai, to ye pattern stronger consider hota hai.

                **Types**

                Island reversal pattern ke do prakar hote hain:

                1. **Bearish Island Reversal:** Jab price ek gap ke baad upar move karta hai, phir ek gap ke baad neeche move karta hai, tab bearish island reversal pattern samjha jata hai. Isse market ke bearish trend ka indication hota hai.

                2. **Bullish Island Reversal:** Jab price ek gap ke baad neeche move karta hai, phir ek gap ke baad upar move karta hai, tab bullish island reversal pattern samjha jata hai. Isse market ke bullish trend ka indication hota hai.

                **Trading Strategy**

                Island reversal pattern ko samajhne ke baad traders iska istemal karke trading strategies develop karte hain:

                - **Confirmation:** Island reversal pattern ko confirm karne ke liye traders volume aur other technical indicators ka istemal karte hain.

                - **Entry and Exit Points:** Jab price gap ke baad move karta hai, tab traders entry aur exit points determine karte hain based on trend reversal expectations.

                **Conclusion**

                Island reversal pattern ek important technical analysis tool hai jo traders ko price trends ke reversals ko detect karne mein madad karta hai. Iska sahi istemal karke traders apne trading decisions ko improve kar sakte hain aur market mein successful trading karne ke chances ko badha sakte hain. Island reversal pattern ki understanding aur uska sahi istemal karna traders ke liye zaroori hai jo market mein consistent aur profitable trading karna chahte hai

                اب آن لائن

                Working...
                X