Island Reversal Pattern
The Island Reversal Pattern is a technical analysis chart pattern used in stock trading to indicate a potential reversal in the direction of a trend. It is characterized by a gap in price action that isolates a small trading range, resembling an "island."
Here’s how it works:
- Uptrend or Downtrend: The pattern forms after a significant uptrend (bullish island reversal) or downtrend (bearish island reversal).
- Gap: A gap forms, where the price moves sharply higher (or lower) from the previous day's closing price, creating an island of price bars isolated from the preceding price action.
- Consolidation: The price then trades within a narrow range for a period, forming the island.
- Reversal Gap: Another gap occurs in the opposite direction of the initial gap, indicating a reversal in trend.
The appearance of the second gap, often accompanied by high trading volume, confirms the pattern and suggests a strong potential for a trend reversal.
Example of a Bullish Island Reversal Pattern:
- An uptrend pauses with a gap up, followed by a period of consolidation.
- A gap down follows, signaling the end of the uptrend and the start of a downtrend.
Example of a Bearish Island Reversal Pattern:
- A downtrend pauses with a gap down, followed by a period of consolidation.
- A gap up follows, signaling the end of the downtrend and the start of an uptrend.
This pattern is considered more significant when it occurs after a prolonged trend and is often used by traders to anticipate potential changes in market direction.
Sure, let's dive into more detail about the Island Reversal Pattern.
Characteristics of the Island Reversal Pattern
- Trend: The pattern typically forms after a sustained trend, either bullish or bearish. The strength and duration of the preceding trend can affect the reliability of the pattern.
- Gap Up (or Down):
- Bullish Island Reversal: In a downtrend, the market gaps down, creating a significant price difference between the previous day’s close and the current day’s open.
- Bearish Island Reversal: In an uptrend, the market gaps up, creating a significant price difference between the previous day’s close and the current day’s open.
- Trading Range: After the gap, the price consolidates within a narrow range, forming the "island." This range can last for a few days or even weeks, but the key is that it remains relatively narrow and stable.
- Reversal Gap:
- Bullish Island Reversal: After the consolidation, the market gaps up, leaving the isolated "island" behind and indicating a reversal from the downtrend to an uptrend.
- Bearish Island Reversal: After the consolidation, the market gaps down, leaving the isolated "island" behind and indicating a reversal from the uptrend to a downtrend.
- Volume: The volume is often higher during the formation of the gaps, particularly the reversal gap, which adds to the pattern’s reliability. Increased volume indicates strong interest and conviction in the new trend direction.
- Downtrend: The stock has been in a downtrend, with prices consistently falling.
- Gap Down: The price gaps down sharply, creating a significant drop from the previous close.
- Consolidation: After the gap down, the price consolidates within a narrow range, forming the "island."
- Gap Up: The price then gaps up sharply, breaking above the consolidation range and indicating a reversal to an uptrend.
- Confirmation: The pattern is confirmed by an increase in trading volume during the gap up, reinforcing the bullish signal.
- Uptrend: The stock has been in an uptrend, with prices consistently rising.
- Gap Up: The price gaps up sharply, creating a significant rise from the previous close.
- Consolidation: After the gap up, the price consolidates within a narrow range, forming the "island."
- Gap Down: The price then gaps down sharply, breaking below the consolidation range and indicating a reversal to a downtrend.
- Confirmation: The pattern is confirmed by an increase in trading volume during the gap down, reinforcing the bearish signal.
- Gaps: The gaps are crucial to the island reversal pattern. Without clear gaps, the pattern may not be reliable.
- Volume: Higher volume during the gaps, especially the reversal gap, strengthens the pattern's signal.
- Trend: The preceding trend must be well-defined. A weak or short trend may reduce the pattern's effectiveness.
- Time Frame: The island can form over various time frames, but it’s more significant when observed over daily or weekly charts.
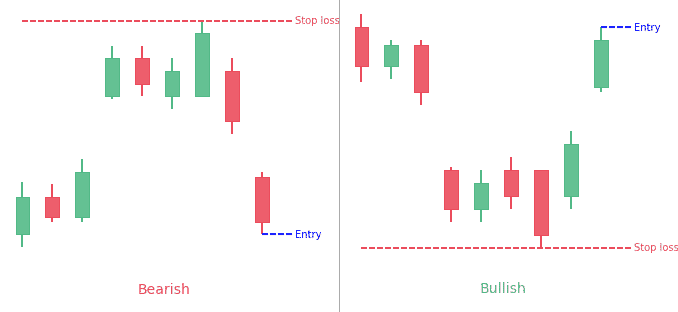
- Entry Point: Traders often enter a position when the reversal gap forms, confirming the pattern. For a bullish island reversal, this would be entering a long position; for a bearish island reversal, entering a short position.
- Stop-Loss: Setting a stop-loss just below the low of the island for a bullish pattern, or above the high of the island for a bearish pattern, can help manage risk.
- Target: The price target can be set based on the height of the preceding trend or other technical indicators such as moving averages or previous support/resistance levels.
By understanding and identifying the Island Reversal Pattern, traders can make more informed decisions about potential trend reversals in the market.


تبصرہ
Расширенный режим Обычный режим