Pennant Chart Pattern
No announcement yet.
X
  • وقت
  • دکھائیں
Clear All
new posts
  • #16 Collapse

    Pennant Chart Pattern details

    Pennant chart pattern bhi ek technical analysis pattern hai jo trading mein istemal hota hai taake potential continuation signals ko pehchana ja sakein. Yeh pattern, flag pattern ki tarah, ek strong price movement ke baad aata hai, lekin pennant pattern mein consolidation phase ek symmetrical triangle shape mein hoti hai. Pennant chart pattern ko continuation pattern mana jata hai aur yeh bullish aur bearish dono trends mein mil sakta hai.
    Pennant Pattern ke Ajza

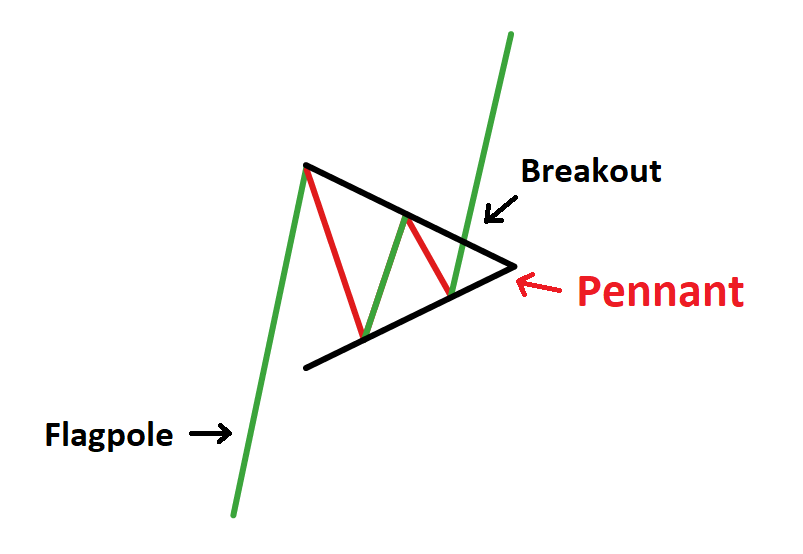
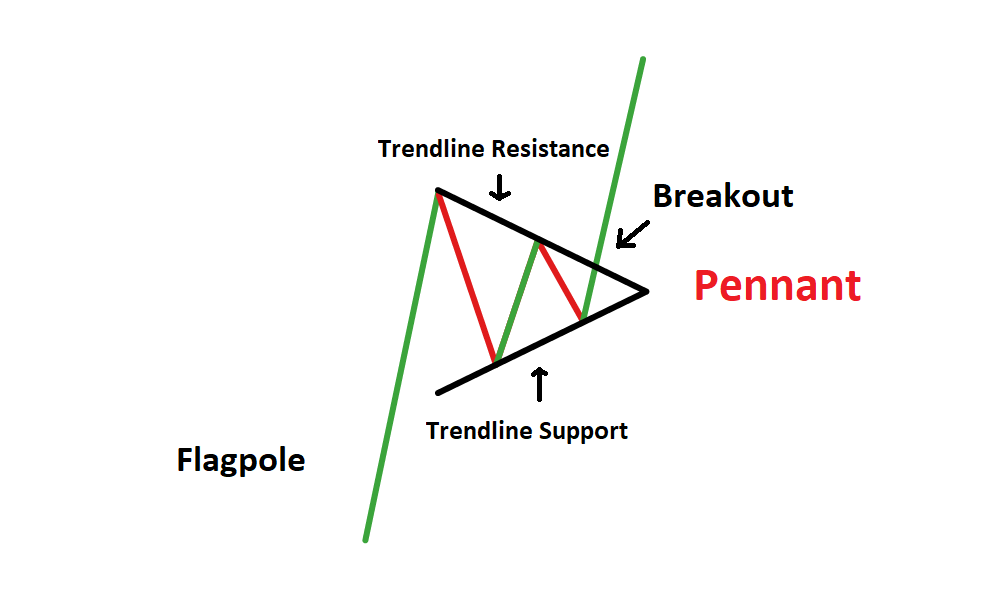
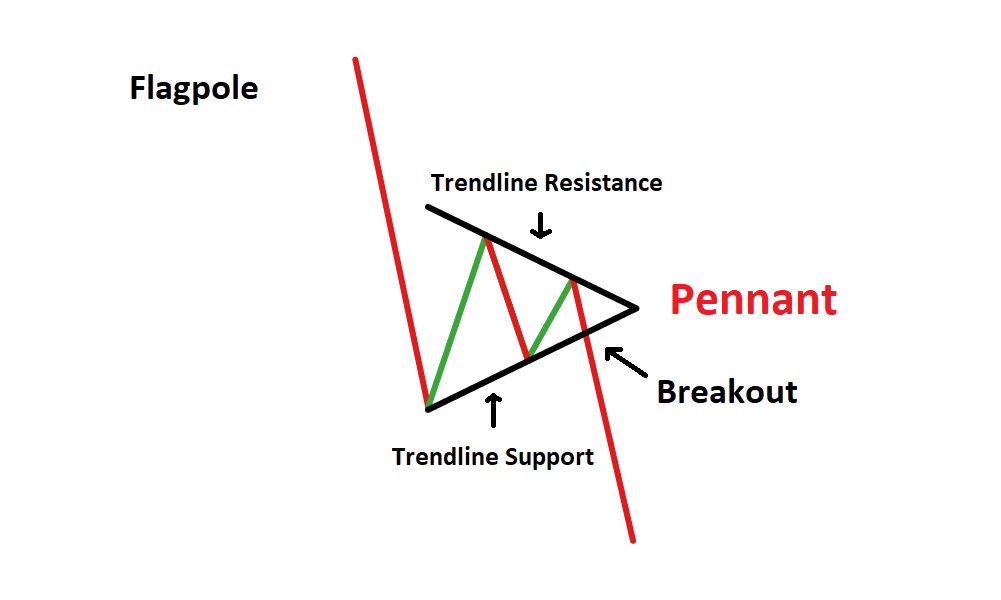
    Flagpole: Ek strong aur sharp price movement jo ya to upward ya downward hoti hai.

    Pennant

    Ek symmetrical triangle-shaped consolidation phase jo flagpole ke baad aati hai. Yeh generally horizontal hoti hai.
    Breakout: Woh nuqta jahan price pennant se nikal kar ek nayi movement shuru karti hai, jo pehle wale trend ke continuation ko indicate karti hai.
    Pennant Pattern ko Pehchanne ke Tips

    Trend Direction

    Pennant pattern ek strong trend ke baad form hota hai, jaise ke ek strong upward ya downward move (flagpole).
    Consolidation: Pennant ek symmetrical triangle shape mein form hota hai jahan price ek narrow range mein move karti hai.
    Volume: Flagpole ke dauran volume zyada hota hai aur pennant ke consolidation phase mein volume kam ho jata hai.

    Breakout Confirmation

    Pennant ke breakout ke baad, volume phir se increase hota hai jo continuation ka signal deta hai.
    Pennant Pattern ka Use

    Bullish Pennant:

    Jab price upward movekar rahi ho (flagpole) aur phir symmetrical triangle-shaped consolidation phase create kare (pennant), aur phir breakout upward ho.
    Bearish Pennant: Jab price downward move kar rahi ho (flagpole) aur phir symmetrical triangle-shaped consolidation phase create kare (pennant), aur phir breakout downward ho.
    • <a href="https://www.instaforex.org/ru/?x=ruforum">InstaForex</a>
    • #17 Collapse

      Pennant Chart Pattern

      Pennant chart pattern ek technical analysis ka term hai jo financial markets mein short-term continuation pattern ko describe karta hai. Ye pattern typically strong price movement ke baad banta hai aur trend continuation ka indication deta hai.
      Yahan ek paragraph mein Pennant chart pattern ke baare mein kuch aham points hain

      Pennant chart pattern ek continuation pattern hai jo financial markets mein dekha jaata hai aur strong price movement ke baad banta hai. Ye pattern ek triangle ke shape mein hota hai jahan price action ek narrowing range mein consolidate hoti hai. Pennant pattern ka structure ek mast (flagpole) aur ek pennant (triangle) ka combination hota hai. Flagpole initial strong price movement ko represent karta hai aur pennant consolidation period ko dikhata hai. Pennant ke formation ke baad, price typically previous trend ko continue karta hai. Is pattern ko identify karne ke liye, traders flagpole ke length aur pennant ke breakout direction ko closely monitor karte hain. Confirmation ke liye volume analysis aur doosre technical indicators ka bhi istemal kiya jata hai. Pennant chart pattern generally short-term trading strategies ke liye useful hota hai aur traders is pattern ka use karke trend continuation ko predict karte hain aur apne trading decisions ko accordingly adjust karte hain.

      Pennant chart pattern ke baare mein kuch ahem points hain

      Continuation Pattern

      Pennant chart pattern ek continuation pattern hai jo strong price movement ke baad banta hai aur trend continuation ka indication deta hai.

      Structure

      Pennant pattern ka structure ek mast (flagpole) aur ek pennant (triangle) ka combination hota hai. Flagpole initial strong price movement ko represent karta hai aur pennant consolidation period ko dikhata hai.

      Triangle Shape

      Pennant ek triangular shape mein hota hai jahan price action ek narrowing range mein consolidate hoti hai, yani price range chhoti hoti jaati hai.

      Breakout

      Pennant ke formation ke baad, price typically previous trend ko continue karta hai. Breakout pennant ke consolidation phase ke baad hota hai aur ussi direction mein hota hai jisme initial price movement tha.

      Volume

      Volume ka analysis bhi important hota hai. Flagpole ke doran volume increase hota hai, pennant formation ke doran decrease hota hai, aur breakout ke doran phir se increase hota hai.

      • #18 Collapse

        Pennant chart pattern?

        Pennant chart pattern aik common technical analysis tool hai jo trading aur investing mein istimaal hota hai. Ye pattern typically continuation pattern hota hai, jo yeh signal deta hai ke market trend apni pehli direction mein continue karega. Pennant chart pattern do main parts par mushtmil hota hai: ek mast aur ek pennant.

        Mast wo vertical price movement hota hai jo ek strong trend ko represent karta hai. Jab market ek sharp move karta hai, toh ye ek mast banata hai. Yeh mast high volume ke sath form hota hai aur investors aur traders ko yeh indicate karta hai ke market mein strong momentum hai.

        Is ke baad, price action consolidate hone lagta hai aur ek symmetrical triangle shape form hoti hai. Ye triangle pennant kehlata hai. Pennant typically lower volume ke sath form hota hai aur yeh indicate karta hai ke market temporarily pause le raha hai, magar overall trend change nahi hua.

        Jab price pennant ke narrow end se breakout karta hai, toh ye signal hota hai ke previous trend continue hone wala hai. Is breakout ko usually high volume ke sath dekhna hota hai, jo confirmation provide karta hai ke trend strong hai. Agar pennant ek upward trend ke baad form hota hai, toh breakout bhi usually upwards hota hai. Agar downward trend ke baad form hota hai, toh breakout downward hota hai.

        Pennant chart pattern ko traders aur investors kaafi reliable samajhte hain kyun ke yeh clear entry aur exit points provide karta hai. Entry point wo hota hai jab price pennant se breakout karta hai, aur exit point wo hota hai jab trend weaken hona shuru hota hai ya specific profit target achieve hota hai.

        Pennant chart pattern ka advantage yeh hai ke yeh choti timeframes par bhi kaam kar sakta hai aur longer timeframes par bhi. Is pattern ko intraday trading, swing trading, aur long-term investing ke liye use kiya ja sakta hai. Magar, jese ke har technical analysis tool ke sath hota hai, pennant chart pattern bhi kabhi kabhi false signals generate kar sakta hai. Is liye, traders aur investors ko doosre indicators, like volume analysis aur trend strength indicators, ke sath combine karke use karna chahiye.

        Pennant chart pattern ek valuable tool hai jo market trends ko understand karne aur profitable trading decisions lene mein madadgar hota hai. Is pattern ko samajhna aur effectively use karna trading aur investing skills ko enhance kar sakta hai, aur market opportunities ko identify karne mein help kar sakta hai.
        • #19 Collapse

          ### Pennant Chart Pattern Ka Taaruf
          1. **Pennant Chart Pattern**
          - Pennant Chart Pattern ek technical analysis tool hai jo price consolidation aur trend continuation ko indicate karta hai. Yeh pattern price ke strong movement ke baad consolidation phase dikhata hai aur phir trend ki continuation ko suggest karta hai.

          2. **Pattern Formation**
          - **Initial Strong Move**: Pennant pattern ek sharp price movement ke baad banta hai, jo usually ek trend ke dauran hota hai. Yeh initial move trend ki direction ko establish karta hai.
          - **Consolidation Phase**: Initial move ke baad price consolidation phase mein chali jaati hai aur ek small symmetrical triangle banaati hai, jo "pennant" shape ka hota hai.
          - **Breakout**: Consolidation ke baad, price pattern ke boundary se breakout karti hai, jo trend ki continuation ko indicate karta hai.

          3. **Key Features**
          - **Shape**: Pennant pattern ek small symmetrical triangle ke shape mein hota hai, jahan trend ke direction ke saath convergence hoti hai.
          - **Volume**: Pattern ke formation ke dauran volume gradually decrease hoti hai. Breakout ke waqt volume increase hoti hai, jo pattern ke validity ko confirm karta hai.

          4. **Types of Pennants**
          - **Bullish Pennant**: Uptrend ke baad banta hai aur price ke upward continuation ko indicate karta hai. Ismein price consolidation ke baad higher breakout hoti hai.
          - **Bearish Pennant**: Downtrend ke baad banta hai aur price ke downward continuation ko indicate karta hai. Ismein price consolidation ke baad lower breakout hoti hai.

          5. **Trading Signals**
          - **Entry Point**: Pennant pattern ke breakout point ko entry point ke roop mein use kiya jata hai. Bullish pennant ke case mein breakout ke baad buy position open ki jati hai, aur bearish pennant ke case mein sell position open ki jati hai.
          - **Stop Loss**: Stop loss ko pattern ke opposite side ke nearest level par set kiya jata hai taake unexpected price movements se protection mil sake.
          - **Target Price**: Target price calculate karne ke liye pattern ke initial move ke height ko breakout point se add ya subtract kiya jata hai, depending on trend direction.

          6. **Pattern Validation**
          - **Volume Confirmation**: Volume analysis pattern ki validity ko confirm karne mein madad karta hai. Breakout ke waqt volume increase hona pattern ke strong continuation signal ko indicate karta hai.
          - **Trend Analysis**: Overall market trend aur other technical indicators ko consider karna zaroori hai pattern ki accuracy aur effectiveness ko validate karne ke liye.

          7. **Benefits**
          - **Trend Continuation**: Pennant pattern trend continuation ko accurately predict karta hai aur clear trading signals provide karta hai.
          - **Strategic Trading**: Pattern ka use strategic trading decisions mein hota hai, jo effective entry aur exit points ko identify karne mein madad karta hai.

          8. **Summary**
          - Pennant Chart Pattern ek important technical analysis tool hai jo price consolidation aur trend continuation ko indicate karta hai. Iska formation aur breakout trend ki direction ko confirm karta hai aur clear trading signals provide karta hai. Volume analysis aur overall trend ko consider karna zaroori hai pattern ki effectiveness ko validate karne ke liye.
          • #20 Collapse

            What is pennant chrt Pattern in Forex Trading?

            Click image for larger version

Name:	65423178.jpeg
Views:	0
Size:	10.4 کلوبائٹ
ID:	13091517

            Pennant chrt pattern forex trading mai ek mukhtalif type ka technical analysis pattern hey. Ye pattern ek temporary pause ya consolidation period ko represent karta hey, usually ek strong trend ke doran dekha jata hey. Is pattern mai price ek flag ya pennant ke andar converge hota hey, jo ke ek chhoti si triangular shape mai hota hey.
            Pennant pattern typically do tarah ke hote hein:

            Bullish Pennant (Uper Ki Taraf Jhanda):

            Bullish pennant ek uptrend ke doran dekha jata hey.
            Is pattern mai price ek chhoti si triangular consolidation phase mai hoti hey, jise ek flag ya pennant kehte hein.
            Jab ye pattern complete hota hey, toh price usually uptrend ki taraf continue karta hey.
            Bearish Pennant (Neeche Ki Taraf Jhanda):

            Bearish pennant ek downtrend ke doran dekha jata hey.
            Is pattern mai price ek chhoti si triangular consolidation phase mai hoti hey, jise ek flag ya pennant kehte hein.
            Jab ye pattern complete hota hey, toh price usually downtrend ki taraf continue karta hey.
            Pennant pattern ko samajh kar, traders aur investors market ke potential future movements ka andaza lagate hein aur trading decisions lete hein. Lekin, hr pattern ki tarah, ye bhi kabhi-kabhi accurate nahi hota aur dusri factors ko bhi consider karna zaroori hota hey.

            Pennant pattern ka breakout usually flagpole ke direction mai hota hey, yani ke trend continuation ke taraf. Traders pennant pattern ke breakout ke baad entry points aur stop loss levels tay karte hein, taki unhe trend ke sath chalne ka faida ho sake.

            • #21 Collapse

              Topic : Pennant Chart Pattern

              Introduction
              Pennant chart pattern ek mashhoor continuation pattern hai jo traders ke liye market ke next move ka andaza lagane mein madadgar hota hai. Yeh pattern usually strong price movement ke baad form hota hai aur is se signal milta hai ke market trend aage bhi continue hoga. Pennant pattern ko samajhna aur is se faida uthana trading mein bohat important hai, kyun ke yeh aapko profitable trading opportunities de sakta hai.

              Pennant Pattern Kya Hai?
              Pennant pattern do key components par mushtamil hota hai: ek strong price movement (jo ke "flagpole" kehlata hai) aur uske baad consolidation phase (jo ke pennant ka shape banata hai). Is pattern mein price ek triangle jese shape mein narrow hota hai, jahan buyers aur sellers ke darmiyan temporary equilibrium hoti hai. Pennant pattern tab complete hota hai jab price is consolidation phase se breakout kar ke apni pehli direction mein movement continue karta hai.

              Types of Pennant Patterns
              Pennant patterns do types ke hotay hain:

              1. Bullish Pennant
              Bullish pennant tab form hota hai jab market mein ek strong upward movement hoti hai, jise flagpole kehte hain, aur phir price consolidation phase mein chala jata hai. Yeh phase triangle shape mein narrow hota hai. Jab price is consolidation se upar ki taraf breakout karta hai, toh yeh ek bullish signal hota hai ke market mein uptrend continue hoga. Is signal par traders usually buy orders place karte hain.

              2. Bearish Pennant
              Bearish pennant tab form hota hai jab market mein ek strong downward movement hoti hai aur phir price consolidation mein jata hai, jo ek triangle ki shakal ikhtiyar karta hai. Jab price is consolidation se neeche ki taraf breakout karta hai, toh yeh ek bearish signal hota hai ke market mein downtrend continue hoga. Is signal par traders usually sell orders place karte hain.

              Trading Pennant Pattern
              Pennant pattern ko effectively trade karne ke liye kuch ahem points ko yaad rakhna zaroori hai:

              1. Identify the Pattern
              Pehle aapko pattern ko sahi tareeke se identify karna hoga. Dekhein ke market mein ek strong price movement hui hai, aur uske baad price consolidate ho raha hai ek narrow triangle ki shakal mein. Yeh consolidation phase usually short-term hota hai aur market ka volume iss dauran reduce hota hai.

              2. Wait for Breakout
              Pattern identify karne ke baad, aapko breakout ka intezar karna hoga. Bullish pennant mein upar ki taraf aur bearish pennant mein neeche ki taraf breakout ka signal milta hai. Yeh breakout high volume ke sath hota hai, jo signal ko aur zyada reliable banata hai.

              3. Enter the Trade
              Breakout hone ke baad, aap market mein entry kar sakte hain. Bullish pennant mein aap buy position le sakte hain, aur bearish pennant mein sell position. Apna entry point breakout point ke qareeb hona chahiye, taake aap maximum profit le sakein.

              4. Set Stop-Loss and Take-Profit
              Risk management ke liye stop-loss set karna bohat zaroori hai. Stop-loss apni position ke opposite side par pennant ke consolidation range ke bahar set karein. Iske ilawa, take-profit target flagpole ke height ke barabar set karein. Yeh aapko potential profit ke liye realistic expectation set karne mein madad karega.

              Conclusion
              Pennant chart pattern ek reliable continuation pattern hai jo traders ko strong trends mein enter aur exit karne ka mauqa deta hai. Is pattern ko sahi tareeke se samajhna aur trade karna aapki trading performance ko behtar kar sakta hai. Lekin, hamesha yaad rakhein ke risk management bohat ahem hai aur koi bhi trade karne se pehle market conditions ka tehqeeq karna zaroori hai. Agar aap discipline aur strategy ke sath Pennant pattern ko use karte hain, toh aap profitable trading opportunities ka faida utha sakte hain.
              • <a href="https://www.instaforex.org/ru/?x=ruforum">InstaForex</a>
              • #22 Collapse

                ### Pennant Chart Pattern
                Pennant chart pattern trading mein ek maamooli aur faida mand strategy hai jo market ki continuation trends ko identify karti hai. Yeh pattern ek flag pole aur ek pennant ke combination se mil kar banta hai. Is pattern ka istemal aksar short-term aur medium-term trading strategies mein kiya jata hai. Yahan hum is pattern ke formation aur trading ke tareeqay ko detail se samjhenge.

                **Formation**

                Pennant pattern ke do main components hote hain: flag pole aur pennant. Flag pole tab banta hai jab price ek sharp aur rapid movement ke sath upar ya neeche jaati hai. Yeh movement ek strong trend ko dikhati hai jo pattern ke formation ke liye base provide karti hai.

                Pennant, flag pole ke upar chhoti aur converging trend lines ke saath banta hai. Yeh trend lines ek triangular shape ka pattern banati hain jo consolidation phase ko dikhata hai. Consolidation phase ke dauran, price range mein move karti hai, lekin trend ki direction clear nahi hoti. Yeh phase ek temporary pause hota hai jo trend ke continuation ki confirmation ke liye hota hai.

                **Identification**

                Pennant pattern ko identify karna relatively simple hai agar aap trend lines aur consolidation phases ko samajh lein. Jab price flag pole ke baad consolidate hoti hai aur trend lines ek triangle shape banati hain, toh aap ek pennant pattern dekh rahe hain. Important baat yeh hai ke pennant ka volume decreasing hota hai jaisay yeh pattern complete hota hai, aur volume tab increase hota hai jab price pattern se breakout karti hai.

                **Trading Strategy**

                Pennant pattern trading ke liye, aapko kuch key steps follow karne chahiye:

                1. **Pattern Confirmation**: Pehle, ensure karen ke aapke paas clear flag pole aur pennant formation hai. Yeh check karen ke pennant ke sides converging hain aur price consolidation phase ke dauran hai.

                2. **Breakout Point**: Pennant pattern se trade karne ka common approach yeh hota hai ke aap breakout point par entry karen. Jab price pennant ke upper ya lower trend line se breakout karti hai, yeh signal hota hai ke trend continue hoga.

                3. **Volume Confirmation**: Breakout ke sath volume ka increase hona bhi zaroori hai. Volume ki increase trend ki strength ko confirm karti hai aur aapke trade ko zyada reliable banati hai.

                4. **Stop-Loss and Target**: Trading karte waqt, aapko stop-loss set karna chahiye jo pattern ke opposite side par ho, taake agar market aapke against move kare toh loss minimize ho. Target ko flag pole ke length ke barabar rakha jata hai jo aapke breakout point se calculate kiya jata hai.

                **Example**

                Agar ek stock ne ek strong bullish trend ke sath 100 se 150 tak movement ki, aur uske baad pennant formation start hoti hai, toh aap dekhenge ke price consolidation phase mein move karti hai. Jab price pennant ke upper trend line se breakout karti hai aur volume increase hota hai, toh yeh bullish signal hai. Aap apne entry point ko breakout point ke pass rakhenge aur stop-loss ko pennant ke opposite side par set karenge. Target ko flag pole ki length ke hisaab se set karenge, jo ki is case mein 50 points ke barabar hoga.

                **Conclusion**

                Pennant chart pattern ek powerful tool hai jo trend continuation ko identify karne mein madad karta hai. Is pattern ko sahi se identify aur trade karne se aap market trends ka faida utha sakte hain. Hamesha ensure karen ke aap volume aur trend confirmation ko consider karen aur risk management strategies ko implement karen taake trading decisions zyada informed aur reliable ho.

                اب آن لائن

                Working...
                X