Dark cloud cover pattern keya hai?

No announcement yet.
`
X
  • وقت
  • دکھائیں
Clear All
new posts
  • #1 Collapse

    Dark cloud cover pattern keya hai?
    Dark Cloud Cover Pattern Kya Hai?

    Dark Cloud Cover Pattern ek technical analysis ka concept hai jo ke stock market mein istemal hota hai. Yeh ek bearish reversal pattern hai jo indicate karta hai ke stock ke bullish trend ka khatra hai aur ab prices mein neeche ki taraf move expected hai.

    Dark Cloud Cover Pattern Ka Tareeqa Amal

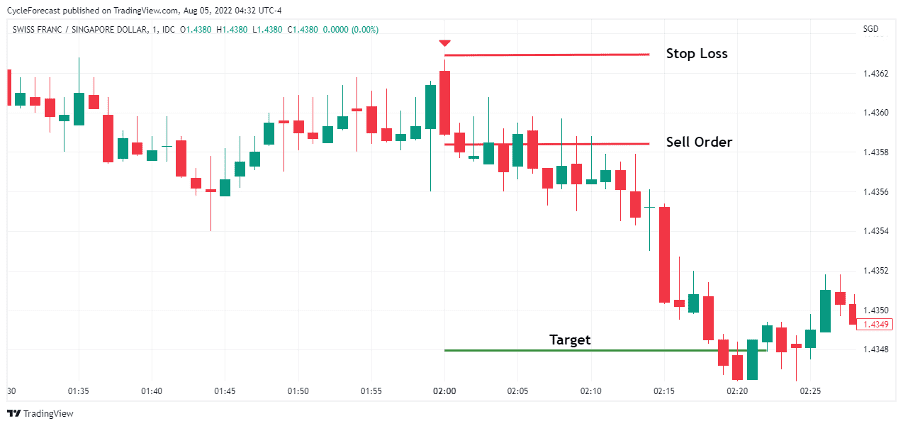
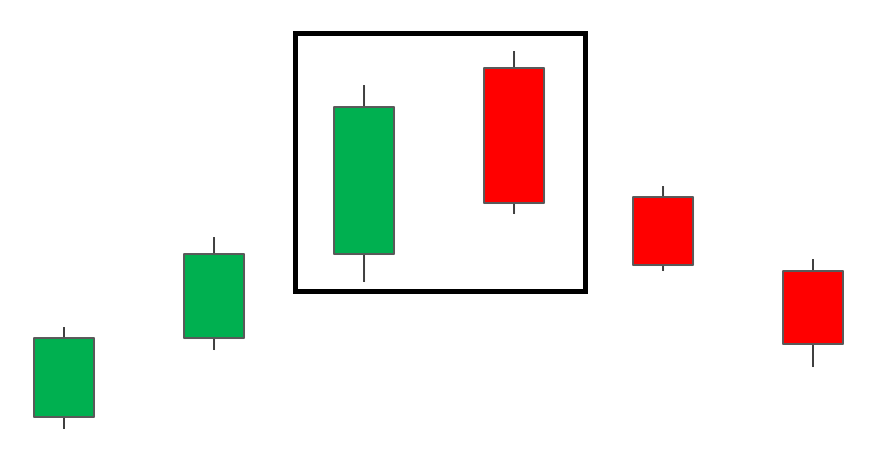
    Dark Cloud Cover Pattern ko identify karne ke liye do candlesticks ki zaroorat hoti hai. Pehla candlestick ek long green candle hota hai jo bullish trend ko represent karta hai aur doosra candlestick ek long red candle hota hai jo pehle candlestick ke upper half mein open hota hai aur neeche ki taraf close hota hai. Yeh red candle previous green candle ke kuch hisse ko cover karta hai, isliye isse "dark cloud" kaha jata hai.

    Dark Cloud Cover Pattern Ki Tashkhis

    Dark Cloud Cover Pattern ko tashkhis karne ke liye kuch factors ka khayal rakha jata hai:
    1. Size: Pehli candle ka size zyada hona chahiye aur doosri candle ka size pehli candle ke upper half mein open hona chahiye.
    2. Volume: Volume ki taraqqi doosri candle ke sath honi chahiye, yani ki trading activity zyada honi chahiye.
    3. Confirmation: Dark Cloud Cover Pattern ko confirm karne ke liye traders doosri candle ke neeche ki ek breakdown ka wait karte hain. Agar price doosri candle ke neeche move karta hai, toh yeh bearish signal ko confirm karta hai.

    Dark Cloud Cover Pattern Ka Istemal

    Dark Cloud Cover Pattern ka istemal bearish reversal ko anticipate karne ke liye kiya jata hai. Agar yeh pattern sahi taur par identify kiya jata hai aur confirm hota hai, toh traders neeche ki taraf move karne ki umeed rakhte hain aur iske mutabiq apne trades ko adjust karte hain.

    Dark Cloud Cover Pattern Ki Limitations

    Dark Cloud Cover Pattern ke istemal mein kuch limitations bhi hain:
    1. False Signals: Kabhi-kabhi yeh pattern false signals bhi generate kar sakta hai, jiski wajah se traders galat trades execute kar sakte hain.
    2. Confirmation: Is pattern ko confirm karne ke liye price ke neeche ki breakdown ki zaroorat hoti hai, jo kabhi-kabhi missing ho sakti hai ya late ho sakti hai.
    3. Market Context: Dark Cloud Cover Pattern ko sirf market ke specific context mein hi consider kiya ja sakta hai. Agar overall market bullish hai toh yeh pattern kam effective ho sakta hai.

    Dark Cloud Cover Pattern: A Conclusion

    Dark Cloud Cover Pattern ek useful tool hai bearish reversal ko anticipate karne ke liye, lekin iska istemal karte waqt traders ko cautious rehna chahiye aur dusre technical indicators aur market context ko bhi consider karna chahiye. Is pattern ka istemal karne se pehle thorough research aur analysis ki zaroorat hoti hai.
  • <a href="https://www.instaforex.org/ru/?x=ruforum">InstaForex</a>
  • #2 Collapse

    what is Dark Cloud Cover Pattern?

    forex market mein aik strong kesam ka candlestick pattern hota hey trader yahan par forex market kay reversal trend ko he indicate kar sakta hey reward ke ratio kay ley saz gar risk frahm ho sakta hey or es ko talash karna kafee zyada assan ho jata hey but trader ko mel kar dark cloud cover candlestick pattern ko daikhnay ke zaroorat hote hey pattern start hotay he trade say graiz karna chihay

    Understanding Dark Cloud Cover Pattern

    forex market mein dark cloud cover candlestick pattern aik kesam ka nayab pattern hota hey jo keh forex market mein he zahair hota rehta hey yeh forex market mein up trend kay sab say oper zahair hota hey es kesam kay chart pattern mein aik bare green candle stick pay jate hey or es kay bad forex market mein aik bare red candlestick ban jate hey jo keh forex market mein nechay janay say pehlay close ho jate hey or forex market mein aik new highs bana sakte hey
    Click image for larger version

Name:	dark-cloud-cover_body_Darkcloudcoverexplained.png
Views:	53
Size:	13.8 کلوبائٹ
ID:	12942926
    forex market mein candlestick ke yeh tashkeel agerchay bohut he melte julte hote hey laken bearrish engulfing candlestick pattern say olajhna nahi chihay pattern mumkana trend kay reversal janay ka eshara karta hey laken forex market mein dark cloud bearish candlestick pattern say reversal janay say pehlay es bat ke taraf eshara kar dayta hey bearish candlestick kay zyada close honay ke wajah por kashesh entry level frahm kar sakta hey or bearish engulfing kay sath analysis keya jata hey

    Trade with Dark Cloud cover pattern

    forex market mein dark cloud cover candlestick pattern aik kesam ka pattern hota hey jes mein higher highs or higher lows ka wajod hota hey or forex market mein trend kay sath paish keya jata hey
    orex chart par koi es bat ka analysis kar sakta hey keh market nay aik side par barhna start kar deya hey oper ke taza tareen movement start mein aik taraf movement kar jate hey jab yeh forex market mein oper ke taraf barhte hey to yeh start mein itni he bullish movement nahi kar sakte hey jaisa keh forex market mein oper daikha geya forex market mein RSI overbought area mein chala geya hey yeh forex market mein es tarah he open ho ge jes tarah yh guzashta close ho gay the
    red bearish candlestick mid point say nechay ke taraf barhte jate hey or close ho jate hey jes say zahair hota hey bear es level par bulls say zyada strong ho jatay hein
    jare candlestick ke confirmation agle he candlestick say ho jate hey es kay bad anay wale candle or es kay bad anay wal he candlestick he nazar aa jate hein or fore market kamyaby kay sath reversal chale gay the or nechay ka trend kaim ho geya tha
    Click image for larger version

Name:	dark-cloud-cover_body_Trading_using_dark_cloud_cover_gbpusd.png
Views:	41
Size:	18.0 کلوبائٹ
ID:	12942927

    range market ke example

    es tarah ke strategy forex market ke range market mein he hote hey or yeh support or resistance kay darmean mein bounce ho jate hey zail ke mesal mein GBP/USD kay stable period ko he zahair kar sakte hey or forex market mein aik kesam ka short signal frahm kar sakta hey or es raftar kafee zyada hoto yeh breakout pattern mein tabdel ho jata hey jaisa keh nechay ke mesal mein hova hey
    Click image for larger version

Name:	dark-cloud-cover_body_how_to_trade_using_dark_cloud_cover_pattern_gbpusd.png
Views:	44
Size:	21.3 کلوبائٹ
ID:	12942928
    bhali kay badlay bhali
    • #3 Collapse

      Dark Cloud Cover pattern ek bearish reversal candlestick pattern hai jo ke technical analysis mein istemal hota hai. Ye pattern typically uptrend ke doran develop hota hai aur bullish momentum ko indicate karta hai jo ke bearish reversal ki shuruaat ko dikhata hai.

      Dark Cloud Cover Pattern ka Tareeqa:
      1. Uptrend mein Shuruaat: Dark Cloud Cover pattern ek uptrend ke doran shuru hota hai jab market mein bullish momentum hota hai. Is phase mein, pehla candle ek lamba bullish candle hota hai jo ke uptrend ko darust karta hai.
      2. Doosra Candle: Doosra candle, jo ke bearish hota hai, pehle candle ke oopar open hota hai aur phir neeche jaata hai. Ye candle pehle candle ke aik hisse se shuru hota hai aur phir neeche ki taraf chala jaata hai.
      3. Confirmation: Dark Cloud Cover pattern ka confirmation tab hota hai jab doosre candle ke close price pehle candle ke 50% ke oopar hota hai. Agar ye condition meet hoti hai, to ye pattern zyada reliable mana jata hai.
      Click image for larger version

Name:	download (1).jpeg
Views:	47
Size:	12.6 کلوبائٹ
ID:	12943025Click image for larger version

Name:	download.png
Views:	131
Size:	11.4 کلوبائٹ
ID:	12943024
      Dark Cloud Cover Pattern ke Tafsilaat:

      Dark Cloud Cover pattern ek powerful bearish reversal signal hai jo ke traders ko downtrend ke shuru hone ki nishani deta hai. Ye pattern typically strong uptrends ke baad develop hota hai aur bearish reversal ki possibility ko darust karta hai.

      Dark Cloud Cover Pattern ke Istemal:

      Traders Dark Cloud Cover pattern ka istemal karte hain takay wo bearish reversal ke signs ko pehchan sakein aur apni trading strategies ko uske mutabiq adjust kar sakein. Agar ye pattern ek strong uptrend ke doran develop hota hai aur confirm ho jaata hai, to traders short positions lete hain ya existing long positions ko close karke profit book karte hain.

      Dark Cloud Cover Pattern ka Istemal aur Strategy:

      Dark Cloud Cover pattern ko istemal karte waqt, traders ko zyada saavdhaan aur tawajju mein rehna chahiye. Is pattern ki sahi pehchan aur confirm hone ke baad, traders ko entry aur exit points ko carefully plan karna chahiye taake unka exposure aur risk kam ho.
      Click image for larger version

Name:	images (2).jpeg
Views:	45
Size:	12.3 کلوبائٹ
ID:	12943028Click image for larger version

Name:	images.jpeg
Views:	47
Size:	22.4 کلوبائٹ
ID:	12943027Click image for larger version

Name:	download (1).png
Views:	49
Size:	5.9 کلوبائٹ
ID:	12943026
      Conclusion:

      Dark Cloud Cover pattern ek ahem bearish reversal pattern hai jo ke uptrend ke doran develop hota hai aur bearish reversal ki shuruaat ko indicate karta hai. Traders ko is pattern ko samajhna aur uske istemal ke liye sahi tareeqe se tayyar rehna chahiye takay wo market ke changing dynamics ko samajh kar successful trading decisions le sakein.
      • #4 Collapse


        Dark cloud cover pattern keya hai?

        Forex trading mein "Dark Cloud Cover" ek mumtaz candlestick pattern hai jo price reversal ka indication deta hai. Is pattern ka istemal traders price movements ko predict karne ke liye karte hain. Is article mein hum "Dark Cloud Cover" pattern ke baray mein roman Urdu mein tafseel se baat karenge.

        Click image for larger version

Name:	A19.jpg
Views:	44
Size:	14.2 کلوبائٹ
ID:	12943069

        Dark Cloud Cover Pattern


        Dark Cloud Cover ek bearish reversal pattern hai jo do candlesticks se bana hota hai. Ye pattern bullish trend ke baad aksar dekha jata hai aur downward price movement ka indication deta hai. Dark Cloud Cover pattern ko samajhne ke liye neeche di gayi steps follow ki ja sakti hain:

        1. Pehla Candlestick (Bullish):
        • Dark Cloud Cover pattern ki shuruaat ek lambi bullish (umeedi) candlestick se hoti hai jo upward trend ko indicate karta hai.
        • Is candlestick ka range generally bara hota hai aur iski closing price peechli candlestick ke closing price se ooncha hota hai.

        2. Dusra Candlestick (Bearish):
        • Dusra candlestick pehle candlestick ke oopar open hoti hai lekin phir se niche jaati hai.
        • Is bearish candlestick ka range pehli candlestick ke range mein shamil hota hai, lekin iska closing price pehli candlestick ke 50% se zyada neeche hota hai.
        Dark Cloud Cover Pattern Ki Tafsilaat

        Dark Cloud Cover pattern ki tafsilaat yeh hoti hain:
        • Dark Cloud Cover pattern bullish trend ke baad hota hai aur downward reversal ka signal deta hai.
        • Is pattern mein pehli candlestick bullish hoti hai, jo upward movement ko reflect karta hai.
        • Dusra candlestick pehli candlestick ke oopar open hoti hai lekin phir se neeche jaati hai aur iska closing price pehli candlestick ke 50% se zyada neeche hota hai.
        • Dark Cloud Cover pattern ki effectiveness ko confirm karne ke liye, traders volume aur other technical indicators ko bhi dekhte hain.

        Dark Cloud Cover Pattern Ka Istemal

        Dark Cloud Cover pattern ka istemal traders price reversals ko identify karne aur trading opportunities dhundne ke liye karte hain. Is pattern ko samajhne aur istemal karne ke kuch ahem points yeh hain:

        1. Confirmation:
        • Dark Cloud Cover pattern ki effectiveness ko confirm karne ke liye, traders ko dusri technical indicators jese ki volume, RSI (Relative Strength Index), aur moving averages ka istemal karte hain.

        2. Stop Loss Aur Target:
        • Dark Cloud Cover pattern ko trade karte waqt stop loss aur target levels ko mukhtar taur par set karna zaroori hai. Stop loss ko pattern ki high price ke thoda oopar aur target ko support level ke qareeb set kiya ja sakta hai.

        3. Risk Management:
        • Dark Cloud Cover pattern ko istemal karte waqt risk management ka khayal rakhna zaroori hai. Traders ko apni investment aur position size ko control mein rakhna chahiye.

        Dark Cloud Cover Pattern Ki Limitations

        Dark Cloud Cover pattern ke kuch limitations yeh hain:
        • Ye pattern bilkul 100% effective nahi hota aur kabhi kabhi false signals bhi generate kar sakta hai.
        • Is pattern ki effectiveness ko confirm karne ke liye additional technical analysis ki zaroorat hoti hai jese ki volume aur trend indicators.
        Aakhri Kehna

        Dark Cloud Cover pattern forex trading mein ek ahem candlestick pattern hai jo price reversals ko predict karne mein madadgar sabit ho sakta hai. Is pattern ko samajhne ke liye traders ko candlestick analysis aur technical indicators ka istemal karna zaroori hai. Dark Cloud Cover pattern ko effectively istemal karne ke liye, traders ko proper risk management aur confirmation ke liye additional analysis ka bhi istemal karna chahiye.


        • #5 Collapse

          Dark cloud cover pattern keya hai?
          Click image for larger version

Name:	download (1).jpeg
Views:	72
Size:	12.6 کلوبائٹ
ID:	12943129
          **Dark Cloud Cover Pattern: Ek Bearish Reversal Pattern**
          **1. Tanazur (Definition):**

          Dark Cloud Cover Pattern ek bearish reversal pattern hai jo candlestick charts par dekha jata hai. Is pattern mein do consecutive candlesticks shamil hote hain. Pehla candlestick uptrend ke doran appear hota hai aur doosra candlestick ise follow karta hai, lekin iska opening price pehle candlestick ke closing price se higher hota hai. Doosra candlestick ka closing price pehle candlestick ke middle point ke neeche hota hai, is tarah se ek dark cloud ki tarah dikhta hai.

          **2. Tawil (Interpretation):**

          Dark Cloud Cover pattern bearish sentiment ki taraf ishara karta hai. Pehle candlestick mein uptrend ki strength dikhayi jati hai, lekin doosre candlestick mein price neeche aata hai, indicating ke bearish pressure barh raha hai. Ye bearish reversal ka indication hai aur uptrend ka khatra darust hota hai.

          **3. Tasdeeq (Confirmation):**

          Dark Cloud Cover pattern ki tasdeeq ke liye, traders ko dusre technical indicators aur price action ko bhi madah karna chahiye. Jese ke volume increase aur kisi aur bearish reversal pattern ke sath milte julte, jaise ke bearish engulfing ya descending triangle.

          **4. Trading Strategy:**

          Dark Cloud Cover pattern ko samajh kar traders bearish reversal trades ke liye strategies tay kar sakte hain. Ek common approach hai ke traders apne positions ko short sell karte hain jab ye pattern confirm ho jata hai. Stop-loss orders ka istemal karna bhi zaroori hota hai taake loss ko minimize kiya ja sake.

          **5. Had (Limitations):**

          Dark Cloud Cover pattern ki bhi kuch limitations hoti hain. Kabhi kabar ye pattern false signals bhi de sakta hai, is liye iski tasdeeq ke liye aur confirmation ke liye dusre technical indicators ka istemal zaroori hota hai.

          Dark Cloud Cover pattern ek ahem bearish reversal pattern hai jo traders ko market ke potential reversals ke baare mein alert karta hai. Isko samajh kar aur sahi tajziya ke sath, traders apne trading strategies ko improve kar sakte hain.
          • #6 Collapse

            Dark Cloud Cover Pattern (Andhera Badal Dhakan Pattern)

            Click image for larger version

Name:	download (22).png
Views:	48
Size:	11.3 کلوبائٹ
ID:	12943194


            Sarhad: Dark Cloud Cover Pattern ek bearish reversal pattern hai jo ke candlestick chart analysis mein istemal hota hai. Yeh pattern bullish trend ke baad ek potential trend reversal ko darust karta hai. Is mukhtasar maqale mein, hum Dark Cloud Cover Pattern ke tafseelat par ghoor karenge aur iske fawaid aur nuqsanat par bhi baat karenge.

            Dark Cloud Cover Pattern Ki Tafseelat:
            1. Pehla Candle (Bullish): Dark Cloud Cover Pattern ka pehla candle ek lamba bullish candle hota hai jo ke existing uptrend ko darust karta hai. Is candle mein buying pressure zahir hoti hai aur market upar ki taraf ja rahi hoti hai.
            2. Doosra Candle (Bearish): Doosra candle pehle candle ke upper gap up ke saath shuru hota hai. Yeh candle bhi lamba hota hai aur iski opening pehle candle ke upper hoti hai. Lekin, is candle ki closing pehli candle ke body ke andar ya us se neeche hoti hai.

            Dark Cloud Cover Pattern Ke Fawaid:
            1. Bearish Reversal Signal: Dark Cloud Cover Pattern ek bearish reversal signal hai. Jab yeh pattern sahi taur par confirm ho jata hai, toh traders ko bullish trend ka khatma aur bearish trend ka aghaz hone ka andaza lagaya ja sakta hai.
            2. High Probability Pattern: Is pattern ka istemal kar ke traders ko high probability trades mil sakti hain. Agar yeh pattern sahi taur par confirm ho jaye, toh traders apni positions ko short karke potential profits hasil kar sakte hain.
            3. Confirmation Ke Liye: Dark Cloud Cover pattern ko confirm karne ke liye, traders doosri technical indicators aur patterns ka istemal bhi kar sakte hain. Jaise ke volume analysis aur trend indicators.

            Dark Cloud Cover Pattern Ke Nuqsanat:
            1. False Signals: Kabhi kabhi, Dark Cloud Cover pattern false signals bhi de sakta hai. Isliye, traders ko is pattern ko confirm karne ke liye doosri technical analysis ka istemal karna zaroori hota hai.
            2. Market Conditions Ka Asar: Market conditions ka asar bhi is pattern ke fayde ko nuqsan mein badal sakta hai. Agar market mein low volatility ya choppy trading hai, toh is pattern ka asar kam ho sakta hai.
            3. Over sold Conditions: Agar market already over sold conditions mein hai, toh Dark Cloud Cover pattern ke signals ki value kam ho sakti hai. Isliye, traders ko market ki overall conditions ka bhi dhyaan rakhna chahiye.

            Muqadama:

            Dark Cloud Cover Pattern ek ahem bearish reversal pattern hai jo ke traders ko bearish trend ka aghaz hone ka andaza lagane mein madad deta hai. Is pattern ko samajhna aur sahi taur par istemal karna, traders ke liye mufeed ho sakta hai. Lekin, traders ko false signals se bachne ke liye is pattern ko confirm karne ke liye doosri technical analysis ka bhi istemal karna chahiye.
            • #7 Collapse

              Dark cloud cover pattern keya hai?

              Click image for larger version

Name:	download (30).png
Views:	37
Size:	4.7 کلوبائٹ
ID:	12943336


              Title: Dark Cloud Cover Pattern: Ek Bearish Reversal Signal
              Dark Cloud Cover pattern ek bearish reversal signal hai jo candlestick charting mein istemal hota hai. Yeh pattern typically uptrend ke baad aata hai aur bearish trend ka indication deta hai. Dark Cloud Cover pattern ko pehchanne ke liye traders ko do consecutive candles ka dhyan dena hota hai jo ek particular sequence mein aati hain.

              1. **First Candle (Bullish):** Pehli candle ek uptrend ke doran aati hai aur bullish hoti hai, jiska body lamba hota hai aur upper side pe close hota hai.
              2. **Second Candle (Bearish):** Doosri candle ek downtrend ki shuruaat karti hai aur bearish hoti hai. Iski opening price pehli candle ke upper side mein hoti hai lekin iski closing price pehli candle ke body ke neeche close hoti hai, iska matlab hai ke doosri candle pehli candle ki kuch hisse ko cover kar deti hai.

              Dark Cloud Cover pattern ka hona ek bearish reversal ka indication deta hai. Pehli candle ki upward movement ko follow karte hue doosri candle market mein bearish momentum ko indicate karta hai, aur bearish trend ka shuruaat hota hai.

              Dark Cloud Cover pattern ko samajhne ke liye, traders ko candle ka shape, size, aur surrounding candles ka bhi dhyan dena zaroori hai. Is pattern ka sahi istemal karne ke liye, traders ko dusre technical indicators ke saath bhi combine karna chahiye.

              Dark Cloud Cover pattern ka opposite pattern Piercing Line pattern hota hai, jo bullish reversal ko darust karta hai. Ismein bhi do consecutive candles shamil hote hain, lekin downtrend ke baad aata hai aur bullish reversal ko darust karta hai.

              Dark Cloud Cover pattern ka istemal karke traders aur investors market ke future movement ka andaza lagate hain aur trading decisions lete hain. Yeh ek important tool hai jo market analysis mein madad karta hai aur trend changes ko anticipate karne mein help karta hai. Lekin, is pattern ko samajhne ke liye thorough research aur technical analysis ki zaroorat hoti hai.
              • #8 Collapse

                Introduction
                Dark cloud cover pattern forex trading mein aik significant bearish reversal pattern hai, jo yeh indicate karta hai ke market ka trend uptrend se downtrend mein shift ho sakta hai. Yeh candlestick patterns mein se aik hai jo technical analysts market movements ko forecast karne ke liye use karte hain. Iss pattern ko samajhna un traders ke liye zaroori hai jo price reversals ko anticipate karna aur informed trading decisions lena chahte hain. Dark cloud cover pattern candlestick charts par identify kiya jata hai, jo currency pairs ki price movements ko specific periods ke liye represent karti hain. Yeh pattern do candlesticks par mushtamil hota hai: pehla candlestick bullish usually white ya green hota hai, aur doosra candlestick bearish usually black ya red hota hai. Pehla candlestick current uptrend ke continuation ko signify karta hai jab ke uska closing price apne high ke kareeb hota hai. Doosra candlestick pehle candlestick ke high ke upar open hota hai, jo potential continuation of bullish trend ka ishara hota hai. Magar, dark cloud cover pattern ka crucial aspect yeh hai ke doosra candlestick pehle candlestick ke midpoint se neeche close hota hai, jo yeh indicate karta hai ke market sentiment mein bullish se bearish ki significant shift hui hai.


                Validity Conditions
                Dark cloud cover pattern ko valid samajhne ke liye kuch conditions ka hona zaroori hai. Pehle, market mein aik discernible uptrend hona chahiye, kyunki yeh pattern iss trend ke potential reversal ko signal karta hai. Doosra, doosra candlestick pehle candlestick ke high ke upar open hona chahiye, creating a gap up. Yeh gap up aksar traders ko yeh sochne par majboor karta hai ke bullish trend continue rahega. Magar, jab doosra candlestick pehle candlestick ke midpoint ke neeche close hota hai, toh yeh indicate karta hai ke bears ne control hasil kar liya hai, jo market sentiment mein shift ka ishara hai. Doosre candlestick ka pehle candlestick mein jitna zyada penetration hoga, reversal signal utna hi strong hoga. Dark cloud cover pattern ke peeche psychology market sentiment aur buying aur selling pressure ke dynamics mein rooted hai. Uptrend ke doran, bulls control mein hotay hain, jo prices ko higher drive karte hain. Aik strong bullish candlestick ka appearance iss sentiment ko reaffirm karta hai. Jab next trading period gap up ke sath open hota hai, toh yeh initially yeh suggest karta hai ke bullish momentum continue hoga. Magar, jab price girti hai aur significantly pehle bullish candlestick ke midpoint ke neeche close hoti hai, toh yeh signal hota hai ke selling pressure barh gaya hai aur bears strength hasil kar rahe hain. Yeh shift bullish se bearish sentiment mein dark cloud cover pattern create karta hai, jo traders ko potential trend reversal ke liye warn karta hai.

                Confirmation with Other Technical Indicators
                Traders dark cloud cover pattern ko doosre technical indicators ke sath use karte hain taake iski validity confirm kar saken aur apni trading strategies ko enhance kar saken. Misal ke taur par, Relative Strength Index (RSI) overbought market ko determine karne mein madad kar sakta hai, jo dark cloud cover ke bearish reversal signal ko mazid weight deta hai. Iske ilawa, volume analysis reversal ki strength ke baray mein insights provide kar sakti hai. Bearish candlestick par higher volume, bullish candlestick ke muqable mein, market sentiment mein substantial shift ko indicate kar sakti hai. Moving averages aur doosre trend indicators bhi prevailing trend ko identify karne aur dark cloud cover pattern ke signal ko validate karne mein madadgar ho sakte hain. Dark cloud cover pattern ko forex trading mein implement karne ke liye disciplined approach aur proper risk management zaroori hai. Traders ko yeh pattern doosre technical signals ke sath dekhna chahiye aur ensure karna chahiye ke market conditions potential reversal ke liye appropriate hain. Jab pattern identify ho jaye aur confirm ho jaye, traders short positions enter karne ya existing long positions close karne par consider kar sakte hain taake potential losses ko mitigate kar saken. Stop-loss orders ko bearish candlestick ke high ke upar set karna risk manage karne mein madadgar ho sakta hai, kyunki yeh clear exit point provide karta hai agar reversal materialize na ho.

                Risk Management with Dark Cloud Cover Pattern
                Mazid yeh ke dark cloud cover pattern foolproof nahi hai aur kuch waqt false signals bhi produce kar sakta hai, especially volatile markets mein. Yeh zaroori hai ke broader market context aur doosre technical factors ko consider kiya jaye pehle trading decisions lene se jo is pattern par based hon. Misal ke taur par, significant economic announcements ya geopolitical events ke doran market volatility barh sakti hai, jo unexpected price movements ko lead kar sakti hai aur pattern ko invalidate kar sakti hai. Isliye, fundamental factors se ba-khabar rehna aur technical analysis ke sath unhe combine karna trading decisions ki reliability ko behtar bana sakta hai. Experienced traders aksar dark cloud cover pattern ko broader trading strategy ka hissa banate hain, instead of relying on it in isolation. Iss pattern ko doosre technical tools ke sath integrate karke, jaise ke support aur resistance levels, trend lines, aur Fibonacci retracements, traders apni ability ko high-probability trade setups ko identify karne mein enhance kar sakte hain. Misal ke taur par, agar dark cloud cover pattern aik significant resistance level ke kareeb form ho, toh yeh bearish signal ko reinforce kar sakta hai aur successful trade ki likelihood ko barha sakta hai.

                Backtesting the Dark Cloud Cover Pattern
                Backtesting aik aur essential practice hai traders ke liye jo dark cloud cover pattern use karte hain. Historical price data ko analyze karke aur instances ko identify karke jahan pattern appear hua, traders iski effectiveness ko assess kar sakte hain aur apni trading strategies ko refine kar sakte hain. Yeh process pattern ki success rate ko samajhne aur iski behavior ko different market conditions mein samajhne mein madad karta hai. Iske ilawa, backtesting traders ko pattern criteria mein potential modifications ko identify karne mein madad karta hai, jaise ke doosre candlestick ke penetration level ko adjust karna ya additional filters incorporate karna taake false signals ko reduce kiya ja sake. Traders ko yeh bhi consider karna chahiye ke woh kis time frame mein trading kar rahe hain jab dark cloud cover pattern ko use karte hain. Yeh pattern different time frames par appear ho sakta hai, minute charts se lekar daily ya weekly charts tak. Pattern ki significance aur reliability time frame ke mutabiq vary kar sakti hai. Misal ke taur par, daily chart par dark cloud cover pattern zyada weight carry kar sakta hai as compared to shorter time frame, due to increased number of market participants aur longer duration of price action considered. Traders ko aik time frame choose karna chahiye jo unki trading style aur strategy ke sath align karta ho.


                Managing Existing Trades
                Individual trade setups ke ilawa, dark cloud cover pattern existing trades ko manage karne ke liye bhi useful ho sakta hai. Misal ke taur par, agar aik trader ke pass aik long position uptrend mein hai aur dark cloud cover pattern identify hota hai, toh yeh warning ke tor par kaam kar sakta hai ke stop-loss orders ko tighten kar lein ya partial profits le lein. Yeh proactive approach gains ko preserve karne aur risk ko effectively manage karne mein madadgar hoti hai. Education aur continuous learning traders ke liye crucial hain jo dark cloud cover pattern use karte hain. Technical analysis mein latest developments se ba-khabar rehna, successful traders ke experiences ko study karna, aur trading performance ko regularly review karna traders ko apni skills improve karne aur changing market conditions ke sath adapt karne mein madad karta hai. Online resources, courses, aur trading communities ke zariye valuable insights aur support mil sakti hai traders ko jo candlestick patterns aur doosre technical analysis tools ko deeply samajhna chahte hain.

                Dark cloud cover pattern aik aisa powerful tool hai ju forex traders ke liye jo uptrend mein potential bearish reversals ko identify karna chahte hain. Iss pattern ki formation, underlying psychology, aur appropriate confirmation methods ko samajh kar, traders apni ability ko market movements ko anticipate karne aur informed trading decisions lene mein enhance kar sakte hain. Iss pattern ko comprehensive trading strategy mein integrate karna, proper risk management ke sath, aur continuous learning, significantly trading performance ko improve kar sakti hai aur forex market mein success ki likelihood ko barha sakti hai.

                ​​​​​​​
                Believe in yourself and your abilities. When you fight for your dreams, you can achieve anything.
                • #9 Collapse

                  Dark Cloud Cover Pattern Keya Hai? Forex Trade Ke Liye Guide


                  1. Dark Cloud Cover Pattern Ka Ta'aruf


                  Dark Cloud Cover Pattern ek reversal candlestick pattern hai jo ke bullish trend ke baad aata hai aur bearish trend ki nishani hota hai. Yeh pattern forex trading mein bohot ahemiyat rakhta hai kyunki yeh market sentiment ke badlav ka clear signal deta hai. Is pattern ke dikhai dene par traders ko alert ho jana chahiye aur apne trading strategies ko accordingly adjust karna chahiye. Dark Cloud Cover Pattern ko samajhna aur use karna trading success ke liye bohot zaroori hai.


                  2. Pattern Ka Ban'nay Ka Tareeqa


                  Dark Cloud Cover Pattern tab banta hai jab ek strong bullish candle ke baad ek bearish candle aati hai jo pehli candle ke body ka zyada hissa cover karti hai. Yeh reversal pattern tab aur bhi significant hota hai jab yeh key resistance level ke kareeb banta hai. Pattern ke ban'nay ka process kuch is tarah hota hai:
                  1. Pehli bullish candle market mein strong buying pressure ko dikhati hai aur iska closing price high hota hai.
                  1. Doosri bearish candle ussi din ya agle din open hoti hai jo pehli candle ke high se upar hoti hai, lekin closing price pehli candle ke body ke midpoint se niche hota hai.
                  1. Yeh pattern tabhi valid hota hai jab bearish candle ke closing price pehli candle ke body ke midpoint se niche hota hai, jo ke selling pressure ko indicate karta hai.


                  3. Pattern Ki Pehli Candle


                  Pehli candle bullish hoti hai aur iska body bara hota hai, jo market ke bullish sentiment ko dikhata hai. Is candle ki length aur shadow market ke buying pressure ko reflect karti hai. Pehli candle ke high aur low market ke sentiment ke bare mein ahem information dete hain. Jab yeh candle banti hai toh traders ko yeh samajhna chahiye ke market mein buyers dominate kar rahe hain aur trend upar ja raha hai.


                  4. Pattern Ki Doosri Candle


                  Doosri candle bearish hoti hai aur yeh pehli candle ke body ko cover kar leti hai. Is candle ki opening price pehli candle ke closing price se upar hoti hai, lekin yeh candle closing price ke saath niche band hoti hai, jo selling pressure ko indicate karti hai. Yeh bearish candle buyers ki weakness aur sellers ki strength ko dikhata hai. Doosri candle ka size aur shadow bhi market ke sentiment ko reflect karte hain.


                  5. Dark Cloud Cover Ke Liye Shartain


                  Dark Cloud Cover Pattern ko valid banane ke liye kuch shartein hain jo traders ko dhyaan mein rakhni chahiye:
                  1. Pehli candle bullish aur strong honi chahiye.
                  1. Doosri candle bearish honi chahiye aur pehli candle ke body ka zyada hissa cover karni chahiye.
                  1. Doosri candle ka closing price pehli candle ke body ke midpoint se niche hona chahiye.
                  1. Yeh pattern high volume aur volatility wale market mein zyada reliable hota hai.


                  6. Market Ki Halat


                  Dark Cloud Cover Pattern aksar high volatility aur high volume market mein paaya jata hai. High volatility market mein price movements tezi se hoti hain, jo is pattern ke signal ko aur bhi reliable banata hai. High volume market mein zyada traders is pattern ko dekh rahe hote hain aur apne trades ko accordingly adjust kar rahe hote hain, jo pattern ki effectiveness ko barhata hai.


                  7. Pattern Ki Ahmiyat


                  Dark Cloud Cover Pattern market mein trend reversal ka ahem signal hota hai. Yeh pattern traders ko bearish trend ke bare mein agahi deta hai aur unhe apni trading strategy ko accordingly adjust karne ka moka deta hai. Is pattern ki ahmiyat is baat mein bhi hai ke yeh market ke sentiment ko reflect karta hai aur traders ko market ke movement ke bare mein agahi deta hai.


                  8. Pattern Ko Pehchan'ne Ka Tareeqa


                  Dark Cloud Cover Pattern ko pehchan'ne ke liye trader ko candles ke colors aur unki positions ko dhyaan se dekhna hota hai. Pehli candle ka bullish aur doosri candle ka bearish hona zaroori hai. Doosri candle ka pehli candle ke body ko cover karna bhi zaroori hai. Yeh pattern tabhi valid hota hai jab yeh shartein poori ho jati hain.
                  1. Pehli candle ka closing price uski opening price se zyada hona chahiye.
                  1. Doosri candle ka opening price pehli candle ke closing price se upar hona chahiye.
                  1. Doosri candle ka closing price pehli candle ke midpoint se niche hona chahiye.


                  9. Dark Cloud Cover Aur Piercing Pattern Mein Farq

                  Dark Cloud Cover Pattern aur Piercing Pattern dono reversal patterns hain, lekin in dono mein kuch farq hai. Dark Cloud Cover Pattern bearish reversal pattern hai jo bullish trend ke baad aata hai, jab ke Piercing Pattern bullish reversal pattern hai jo bearish trend ke baad aata hai. Dono patterns ka ban'nay ka tareeqa bhi mukhtalif hai:
                  1. Dark Cloud Cover Pattern mein pehli candle bullish aur doosri bearish hoti hai, jab ke Piercing Pattern mein pehli candle bearish aur doosri bullish hoti hai.
                  1. Dark Cloud Cover Pattern bearish trend reversal ka signal deta hai, jab ke Piercing Pattern bullish trend reversal ka signal deta hai.


                  10. Entry Aur Exit Points

                  Jab Dark Cloud Cover Pattern confirm ho jaye toh trader apne positions ko accordingly adjust kar sakta hai. Entry point tab hota hai jab bearish candle complete ho jaye aur market mein bearish sentiment dikhayi dene lage. Exit point ka tayun bhi zaroori hai taake losses ko minimize kiya ja sake.
                  1. Entry Point: Jab bearish candle close ho jaye aur market neechay ki taraf move karne lage, tab short position enter karna chahiye.
                  1. Exit Point: Exit points ka tayun support levels ke mutabiq karna chahiye. Jahan par market pehle support dikhata hai, wahan exit karna theek hota hai.


                  11. Risk Management

                  Risk ko manage karne ke liye stop loss aur take profit levels ka tayun karna zaroori hai. Dark Cloud Cover Pattern ke sath trading karte waqt stop loss levels ko pehli candle ke high ke upar rakhna chahiye. Take profit levels ko market ke support aur resistance levels ke mutabiq adjust karna chahiye.
                  1. Stop Loss: Stop loss ko pehli candle ke high se thoda upar rakhna chahiye taake unexpected price movements se bach sakein.
                  1. Take Profit: Take profit levels ko market ke previous support levels ke kareeb rakhna chahiye.


                  12. Pattern Ki Confirmations

                  Is pattern ko aur bhi indicators ke sath combine karke trade ki tasdiq ki ja sakti hai. Moving averages, RSI, aur MACD jaise indicators ko use karke pattern ki confirmation hasil ki ja sakti hai. Yeh indicators market ke trend aur momentum ke bare mein agahi dete hain jo ke pattern ki reliability ko barhata hai.
                  1. Moving Averages: Moving averages se trend ka direction aur strength pata chalti hai. Agar moving averages downtrend dikhati hain toh pattern ki confirmation milti hai.
                  1. RSI (Relative Strength Index): RSI se market ke overbought ya oversold hone ka pata chalta hai. Agar RSI overbought level dikhaye aur Dark Cloud Cover pattern bane toh yeh strong bearish signal hota hai.
                  1. MACD (Moving Average Convergence Divergence): MACD se trend ka momentum pata chalta hai. Agar MACD bearish crossover dikhaye aur Dark Cloud Cover pattern bane toh yeh pattern ki confirmation hoti hai.


                  13. Psychology of Traders

                  Dark Cloud Cover Pattern market ke sentiment ko bhi reflect karta hai jo ke buyers aur sellers ki psychology ko dikhata hai. Jab yeh pattern banta hai, toh iska matlab hota hai ke buyers ki strength kam ho rahi hai aur sellers market ko control kar rahe hain. Yeh pattern traders ke decision making process mein bhi ahm role ada karta hai.
                  1. Buyers ki Psychology: Jab pehli bullish candle banti hai, toh buyers confident hote hain ke market upar jayega. Lekin jab doosri bearish candle banti hai, toh buyers ka confidence toot jata hai.
                  1. Sellers ki Psychology: Doosri bearish candle ke banne se sellers confident hote hain ke market niche jayega aur woh aggressively sell karte hain.


                  14. Historical Performance

                  Yeh pattern historically kafi effective sabit hua hai trend reversals ko predict karne mein. Past data ko dekh kar yeh pattern kai dafa successful trend reversals ko dikhata hai. Yeh historical performance traders ko is pattern par reliance ka confidence deti hai.
                  1. Historical Data Analysis: Historical charts ko dekh kar yeh pata lagaya ja sakta hai ke Dark Cloud Cover pattern kitni dafa market ke trend reversal ko accurately predict kar chuka hai.
                  1. Backtesting: Backtesting tools ka istemal karke traders apni strategies ko historical data par test kar sakte hain aur pattern ki reliability ko samajh sakte hain.


                  15. Learning and Practice

                  Is pattern ko sahi se samajhne aur practice karne ke liye demo accounts aur backtesting tools ka istemal karna chaahiye. Demo accounts se traders ko bina real money ke risk ke trading ki practice karne ka moka milta hai. Backtesting tools se traders past data ka analysis karke pattern ki effectiveness ko samajh sakte hain.
                  1. Demo Accounts: Demo accounts mein virtual money se trading karke real market conditions ko experience kiya ja sakta hai. Yeh practice traders ko market ke behavior ko samajhne aur apne skills ko improve karne ka moka deti hai.
                  1. Backtesting Tools: Backtesting tools se past data ka analysis karke trading strategies ko test kiya ja sakta hai. Yeh tools traders ko yeh samajhne mein madad karte hain ke kaun si strategies effective hain aur kaun si nahin.

                  Conclusion

                  Dark Cloud Cover Pattern ek powerful tool hai forex trading mein jo ke traders ko trend reversal ke bare mein signal de sakta hai. Is pattern ko sahi tarike se samajh kar aur use karke, traders apni trading strategies ko enhance kar sakte hain aur profitable trades execute kar sakte hain. Is pattern ke sath trading karte waqt risk management aur market analysis ka dhyaan rakhna bhi zaroori hai taake successful trading ki ja sake. Dark Cloud Cover Pattern ko samajhne aur practice karne se traders apne trading skills ko improve kar sakte hain aur market mein confident aur informed decisions le sakte hain.
                  • #10 Collapse

                    Dark cloud cover pattern keya hai?


                    Click image for larger version

Name:	download (12).jfif
Views:	28
Size:	12.6 کلوبائٹ
ID:	12963257


                    Dark Cloud Cover ek candlestick pattern hai jo Forex aur stock market mein ek bearish reversal ko indicate karta hai. Yeh pattern bullish trend ke baad aata hai aur yeh signal deta hai ke market ki trend ab downwards hone wali hai.


                    Iska Structure


                    First Candlestick
                    Pehli candlestick ek lambi bullish (white/green) candlestick hoti hai.
                    Yeh candlestick strong upward movement ko show karti hai.


                    Second Candlestick


                    Doosri candlestick ek bearish (black/red) candlestick hoti hai.
                    Yeh candlestick pehli candlestick ke high se open hoti hai lekin iski closing price pehli candlestick ke body ke midpoint se neeche hoti hai.
                    Matlab, doosri candlestick pehli candlestick ko "cover" kar rahi hoti hai, magar poori tarah se nahi, isliye isay dark cloud cover kehtay hain.


                    Conditions


                    Existing Uptrend: Dark Cloud Cover tabhi valid hota hai jab market already ek uptrend mein ho.
                    Gap Up: Doosri candlestick gap up ke saath open hoti hai, yeh bull’s ko trap karne ka kaam karti hai.
                    Midpoint Breach: Doosri candlestick pehli candlestick ke midpoint ko breach karti hai, jo ke ek strong bearish signal hai.


                    Importance


                    Trend Reversal: Yeh pattern usually indicate karta hai ke uptrend khatam ho raha hai aur ab market mein downtrend shuru hone wala hai.
                    Trader’s Decision: Forex traders is pattern ko identify karke apne positions adjust kar sakte hain, jaise ke profit book karna ya phir short selling ka plan banana.


                    Example


                    Scenario:


                    Suppose karo ek currency pair (e.g., EUR/USD) consistently upar ja raha hai.
                    Pehli candlestick ek strong bullish movement ko show karti hai, lekin agle din doosri candlestick gap up ke saath open hoti hai lekin market bearish turn le leta hai aur closing pehli candlestick ke midpoint se neeche hoti hai.


                    Interpretation:


                    Yeh indicate karta hai ke bullish momentum ab weak ho gaya hai aur bears ne market control mein le liya hai.
                    Yeh aapko hint de sakta hai ke aap apne long positions ko close karen aur shayad short position lene ka sochen.


                    Conclusion


                    Dark Cloud Cover pattern ek valuable tool hai Forex trading mein jo aapko market ke trends ko samajhne aur accordingly trade karne mein madad kar sakta hai. Is pattern ko samajhne aur effectively use karne se aap apne trading strategies ko improve kar sakte hain.


                    • #11 Collapse

                      Dark Cloud Cover Pattern Keya Hai? In Forex Trade

                      Forex trading mein technical analysis bohot zaroori hoti hai. Is analysis ke zariye traders market trends aur price movements ko samajhne ki koshish karte hain. Technical indicators aur candlestick patterns in movements ko analyze karne ke liye istimaal hote hain. Aaj hum ek important candlestick pattern, Dark Cloud Cover, ke baare mein baat karenge.


                      1. Dark Cloud Cover Pattern Ki Definition

                      Dark Cloud Cover ek bearish reversal candlestick pattern hai jo ke bull market ke end aur bear market ke start ki nishani hota hai. Yeh pattern jab banta hai toh yeh indicate karta hai ke bullish momentum khatam ho raha hai aur bearish momentum shuru ho gaya hai. Yeh pattern specially un markets mein use hota hai jo pehle se hi uptrend mein hoon.

                      Dark Cloud Cover ka name isliye hai kyunki yeh pattern ek dark cloud ke tarah hota hai jo ki bullish trend ko cover kar leta hai aur bearish trend ki shuruaat ko dikhata hai.


                      2. Yeh Pattern Banta Kaisay Hai?

                      Yeh pattern tab banta hai jab ek strong bullish candle ke baad ek bearish candle close hoti hai jo pehli candle ke body ke midpoint ke niche hoti hai. Pehli candle strong bullish honi chahiye, matlab iski closing high par hoti hai. Doosri candle tab banti hai jab market open hota hai pehli candle ke high par ya uske paas, lekin close karta hai lower half of the previous candle’s body ke neeche.

                      Is pattern ko samajhne ke liye, traders ko pehli candle ki bullish momentum aur doosri candle ki bearish reversal ko observe karna hota hai. Agar doosri candle pehli candle ki high level par open hoti hai aur neeche close hoti hai, toh yeh bearish reversal ka strong indication hai.


                      3. Pattern Ki Shakal

                      Pehli candle white ya green hoti hai jo bullish trend ko show karti hai. Doosri candle black ya red hoti hai jo ke bearish trend ki shuruaat ko show karti hai. Pehli candle ka high level bohot significant hota hai, kyun ke doosri candle usi level par open hoti hai lekin close previous candle ke midpoint ke neeche hoti hai.

                      Dark Cloud Cover pattern ki shape ek upside-down umbrella jaisi hoti hai, jahan pe pehli candle bullish trend ko represent karta hai aur doosri candle bearish reversal ko dikhata hai.


                      4. Important Components

                      Is pattern mein do candles shamil hoti hain: pehli bullish aur doosri bearish. Doosri candle pehli candle ke midpoint ko cross karti hai. Pehli candle ka strong bullish hona zaroori hai, aur doosri candle ka strong bearish hona. Yeh pattern jab tab banta hai jab market ka sentiment change hota hai.

                      Traders ko pehli candle ki length aur range ko analyze karna hota hai taki woh determine kar sakein ke bullish momentum kitna strong hai. Doosri candle ki size bhi important hai, kyun ke larger size indicate karta hai ke bearish reversal zyada powerful hai.


                      5. Pattern Ki Shartain

                      Doosri candle ki opening price pehli candle ki closing price se upar hoti hai, lekin closing price pehli candle ke body ke midpoint se niche hoti hai. Yeh condition bohot zaroori hoti hai kyun ke yeh pattern ka bearish nature ko confirm karti hai. Agar yeh condition na ho toh pattern ka bearish signal weak ya invalid ho sakta hai.

                      Traders ko is shart ko dhyan mein rakhna chahiye aur doosri candle ka close pehli candle ke low level ke paas ya usse neeche dekhna chahiye, taaki pattern ka bearish reversal confirm ho sake.


                      6. Volume Ki Importance

                      High volume par agar yeh pattern bane toh yeh signal aur zyada strong hota hai. High volume indicate karta hai ke market participants ne apni positions change ki hain aur market ka sentiment shift hua hai. Low volume par yeh pattern utna strong signal nahi deta kyun ke uss waqt market participants ka confidence low hota hai.

                      Volume ki analysis karke traders yeh determine kar sakte hain ke pattern ki validity kya hai. Agar volume high hai toh pattern ka bearish reversal confirmation milta hai, lekin agar volume low hai toh traders ko cautious rehna chahiye kyun ke pattern ka signal weak ho sakta hai.


                      7. Confirmation Indicators

                      Is pattern ko confirm karne ke liye doosri candle ke baad ek aur bearish candle ka form hona zaroori hai. Confirmation ke liye doosre technical indicators jaise moving averages, RSI, ya MACD ko bhi use kiya ja sakta hai. Confirmation ke baad hi traders apni bearish positions open karte hain.

                      Traders ko doosri candle ke baad market ka reaction observe karna chahiye. Agar market doosri candle ke baad bhi bearish trend mein continue hota hai toh yeh Dark Cloud Cover pattern ka confirmatory signal hota hai.


                      8. Risk Management

                      Is pattern ko trade karte waqt risk management strategies ka istimaal karna bohot zaroori hota hai, jaise ke stop-loss ka set karna. Risk management se aap apne potential losses ko minimize kar sakte hain. Stop-loss usually us level par set hota hai jo pehli candle ke high ke thoda upar ho.

                      Traders ko apne risk tolerance ke hisab se stop-loss level decide karna chahiye. Agar market opposite direction mein move karta hai toh stop-loss order execute hota hai aur traders ko apni losses control karne ka mauka milta hai.


                      9. Entry Points

                      Yeh pattern dekh kar traders usually bearish positions lete hain jab doosri candle close hoti hai. Entry point wo hota hai jab doosri bearish candle previous bullish candle ke midpoint se neeche close hoti hai. Is point par enter karne se traders bearish trend se profit generate karne ki koshish karte hain.

                      Traders ko entry point par enter karte waqt price action aur volume ko closely monitor karna chahiye. Agar price action aur volume dono bearish signals dete hain toh entry point par enter karna advisable hota hai.


                      10. Exit Points

                      Profit book karne ke liye support levels aur price targets ko dhyan mein rakha jata hai. Exit points wo levels hain jahan traders apni positions ko close karke profit book karte hain. Support levels aur previous lows ko identify karke exit points set kiye jate hain. Traders apne exit points ko technical analysis aur price action ke basis par set karte hain.

                      Agar market mein strong support level ya previous low level observed hota hai, toh woh ek potential exit point ban sakta hai. Traders ko apne profit targets ko achieve karne ke liye exit points ko strategically set karna chahiye.


                      11. Time Frames

                      Yeh pattern different time frames par ban sakta hai, lekin higher time frames par iska signal zyada reliable hota hai. Shorter time frames par yeh pattern false signals de sakta hai. Isliye, daily, weekly, aur monthly charts par yeh pattern dekhna zyada useful hota hai.

                      Traders ko time frame ka selection carefully karna chahiye, kyun ki different time frames par pattern ki interpretation alag ho sakti hai. Longer time frames par Dark Cloud Cover pattern ka signal strong hota hai aur traders ko accurate reversal indications milte hain.


                      12. Combination with Other Indicators

                      Dark Cloud Cover ko doosre indicators ke saath combine karke signal ki reliability ko enhance kiya ja sakta hai. Indicators jaise Moving Averages, RSI (Relative Strength Index), aur MACD (Moving Average Convergence Divergence) ko use karke pattern ka confirmation le sakte hain. Yeh indicators market ka overall trend aur momentum show karte hain.

                      Traders ko multiple indicators ka istemal karke confirmatory signals ko validate karna chahiye. Agar doosre indicators bhi bearish signals show karte hain toh pattern ka reversal potential aur zyada strong hota hai.


                      13. Historical Performance

                      Past market data ko dekh kar yeh pattern kaise perform karta hai yeh samajhna helpful hota hai. Historical performance analysis se traders ko yeh pata chalta hai ke kitne dafa yeh pattern accurate signal diya aur kitne dafa false signal. Yeh analysis trading strategy ko improve karne mein madad karta hai.

                      Traders ko backtesting aur historical data analysis ke through pattern ka performance evaluate karna chahiye. Isse traders ka confidence increase hota hai aur woh pattern ka sahi istemal karke apne trading strategies ko optimize kar sakte hain.


                      14. Common Mistakes

                      Traders kehte hain ke beginners aksar is pattern ko galat pehchaan lete hain, is liye practice aur experience zaroori hai. Common mistakes mein pattern ko incomplete dekhna, low volume par trade lena, aur confirmation ke bina trade lena shamil hain. In mistakes ko avoid karna bohot zaroori hai successful trading ke liye.

                      Traders ko proper education aur training lena chahiye taki woh Dark Cloud Cover pattern ko sahi se identify aur interpret kar sakein. Common mistakes se bachne ke liye traders ko patience aur discipline maintain karna chahiye.


                      15. Conclusion

                      Dark Cloud Cover ek effective bearish reversal pattern hai jo forex trading mein kaafi madadgar sabit ho sakta hai. Is pattern ko samajh kar aur theek se apply karke traders apni trading strategies ko improve kar sakte hain. Forex market ki volatility aur uncertainty ko samajhna mushkil hota hai, lekin candlestick patterns jaise Dark Cloud Cover traders ko market trends aur price movements ka behtareen andaza lagane mein madad karte hain.

                      Dark Cloud Cover pattern ko forex trading mein successfully use karne ke liye in sab points ko samajhna aur apply karna zaroori hai. Har ek heading ke neeche diye gaye points se yeh pattern aur iski application ke baare mein detailed understanding milti hai. Forex trading mein success hasil karne ke liye continuous learning aur practice bohot important hai. Har trader ko yeh pattern apni trading strategy mein shamil karna chahiye taake market movements ko accurately predict kar sake aur profitable trades execute kar sake.
                      • #12 Collapse

                        ## Dark Cloud Cover Pattern: Ek Mukammal Jaiza
                        Forex trading mein candlestick patterns market ke potential reversals aur trends ko identify karne ke liye kaafi important hote hain. Dark Cloud Cover pattern bhi ek aisa pattern hai jo bearish reversal ka signal deta hai. Is pattern ko samajhkar, traders apne trading decisions ko behtar bana sakte hain aur market trends ko accurately predict kar sakte hain. Aaj hum Dark Cloud Cover pattern ki definition, formation, aur trading strategies ko detail mein discuss karenge.

                        ### 1. Dark Cloud Cover Pattern Ki Definition

                        **Definition**: Dark Cloud Cover ek bearish reversal pattern hai jo uptrend ke baad banta hai. Yeh pattern do candlesticks ke combination se mil kar banta hai: pehli candlestick bullish (green) aur doosri candlestick bearish (red) hoti hai. Doosri candlestick pehli candlestick ki body ke upar open hoti hai aur phir pehli candlestick ke closing price ke neeche close hoti hai. Yeh pattern market ke top ke paas ban kar bearish trend ka signal deta hai.

                        **Formation**:
                        - **Pehli Candlestick**: Pehli candlestick ek strong bullish candle hoti hai jo uptrend ko indicate karti hai. Is candle ki body lambi hoti hai aur yeh market ke positive momentum ko reflect karti hai.
                        - **Doosri Candlestick**: Doosri candlestick ek bearish candle hoti hai jo pehli candlestick ke body ke upar open hoti hai. Yeh candle pehli candlestick ke closing price ke neeche close hoti hai, jo bearish reversal ka signal deti hai.

                        ### 2. Dark Cloud Cover Pattern Ki Significance

                        **Bearish Reversal**: Dark Cloud Cover pattern market ke uptrend ke baad bearish reversal ko indicate karta hai. Jab yeh pattern ban jata hai, to yeh sign hota hai ke buying pressure kam ho raha hai aur selling pressure increase ho raha hai.

                        **Market Sentiment**: Yeh pattern market sentiment ko reflect karta hai. Pehli bullish candle ke baad agar doosri bearish candle strong closing ke sath form hoti hai, to yeh buying interest aur positive sentiment ke opposite market sentiment ko indicate karta hai.

                        **Trend Reversal Confirmation**: Dark Cloud Cover pattern trend reversal ke indication ke sath aata hai. Lekin is pattern ki effectiveness ko confirm karne ke liye, additional technical indicators aur patterns ko bhi consider karna chahiye.

                        ### 3. Trading Strategies

                        **Entry Points**: Dark Cloud Cover pattern ke trading opportunities ko identify karne ke liye, traders ko doosri candlestick ke closing price ke neeche sell order place karna chahiye. Yeh signal market ke reversal aur bearish trend ke start ko indicate karta hai.

                        **Stop Loss Aur Take Profit**: Effective risk management ke liye, stop loss aur take profit levels ko define karna zaroori hai. Stop loss ko pehli candlestick ke high ke upar set karna chahiye, jabke take profit levels ko previous support areas ya target price levels ke hisaab se set kiya jata hai.

                        **Pattern Confirmation**: Dark Cloud Cover pattern ke signals ko confirm karne ke liye, other technical indicators jaise moving averages, RSI (Relative Strength Index), aur MACD (Moving Average Convergence Divergence) ka use karna chahiye. In indicators se pattern ke signals ko validate kar sakte hain aur trading decisions ko refine kar sakte hain.

                        ### 4. Limitations Aur Considerations

                        **False Signals**: Dark Cloud Cover pattern kabhi-kabhi false signals bhi generate kar sakta hai. Market conditions aur price movements ke basis par, yeh pattern reversal ko accurately predict nahi kar sakta.

                        **Pattern Confirmation**: Is pattern ki effectiveness ko enhance karne ke liye, pattern ke confirmation ke liye additional indicators aur analysis tools ka use karna chahiye. Pattern ke signals ko confirm karne se accurate trading decisions milte hain.

                        **Market Conditions**: Market conditions aur volatility bhi pattern ke signals ko impact kar sakti hain. High volatility periods mein pattern ke signals ko carefully analyze karna zaroori hai.

                        ### Conclusion

                        Dark Cloud Cover pattern forex trading mein bearish reversal aur market trends ko identify karne ke liye ek valuable tool hai. Is pattern ke signals ko effective trading strategies aur risk management ke sath combine karke, traders market trends aur trading opportunities ko better understand kar sakte hain. Pattern ki limitations aur false signals ko consider karte hue, traders ko additional technical tools aur indicators ka use karna chahiye taake accurate aur informed trading decisions le sakein.
                        • #13 Collapse

                          Dark Cloud Cover Pattern Kya Hai?


                          Dark Cloud Cover Pattern ek technical analysis ka pattern hai jo stocks, forex, aur other financial markets mein trend reversal ki indication deta hai. Yeh pattern do candlesticks ke combination se bana hota hai: ek long bullish candlestick aur ek bearish candlestick jo pehle ki candle ke upar khuli hoti hai. Is pattern ka use traders aur investors market ke future direction ko predict karne ke liye karte hain.

                          Pattern Ka Formation

                          Dark Cloud Cover pattern tab banta hai jab ek long bullish candlestick, jo pehle ki trend ki continuation ko dikhati hai, ke baad ek bearish candlestick form hoti hai. Yeh bearish candlestick pehli candle ke close se upar open hoti hai aur phir isi candle ke end tak, pehli candle ke body ke half ya zyada part ko cover karti hai. Is pattern ki confirmation tab hoti hai jab bearish candle pehli candle ki body ke 50% ya zyada ko cover karti hai.

                          Is Pattern Ki Significance

                          Dark Cloud Cover pattern ek potential trend reversal signal hota hai. Jab yeh pattern form hota hai, to yeh indicate karta hai ke market ki bullish momentum khatam ho sakti hai aur bearish trend shuru ho sakta hai. Traders is pattern ko bearish trend ka signal samajhte hain aur apni trades ko accordingly adjust karte hain. Lekin, yeh zaroori nahi ke yeh pattern hamesha successful ho. Market conditions aur other technical indicators bhi is pattern ke signal ko confirm karne mein madadgar hote hain.

                          Trading Strategy

                          Jab Dark Cloud Cover pattern identify kiya jata hai, to traders aksar is pattern ko confirm karne ke liye additional indicators ka use karte hain, jaise Moving Averages, RSI, ya MACD. Is pattern ke signal ko strong banane ke liye, traders dekhte hain ke bearish candlestick ki closing price, previous bullish candlestick ke half ya zyada part ko cover karti hai. Iske sath, volume analysis bhi important hota hai kyunki high volume confirm karta hai ke trend reversal genuine hai.

                          Conclusion

                          Dark Cloud Cover pattern ek useful tool hai jo market ke trend reversals ko identify karne mein madad karta hai. Is pattern ka samajh hona traders ko better trading decisions lene mein madadgar hota hai. Lekin, is pattern ko market ke overall trend aur additional indicators ke saath combine karke analysis karna zaroori hota hai taake trading strategies ko optimize kiya ja sake aur risks ko minimize kiya ja sake. Isliye, hamesha market ke broader context ko samajhna aur comprehensive analysis karna important hai.
                          ⚡ "Profit is the reward for patience, loss is the fee for learning." 💡
                          • #14 Collapse

                            Dark Cloud Cover Pattern ek bearish reversal candlestick pattern hai jo technical analysis me use hota hai. Yeh pattern do candlesticks se milkar banta hai:

                            Pehli Candlestick: Ek strong bullish (white or green) candle hoti hai jo uptrend ko indicate karti hai.

                            Doosri Candlestick: Ek bearish (black or red) candle hoti hai jo pehli candle ke body ke beech me open hoti hai aur pehli candle ke midpoint se neeche close hoti hai.

                            Click image for larger version

Name:	image.png
Views:	16
Size:	22.2 کلوبائٹ
ID:	13075937

                            Yeh pattern tab banta hai jab ek uptrend ke baad ek significant bearish reversal aata hai, jo indicate karta hai ke price neeche ja sakti hai.


                            Dark Cloud Cover Pattern ke mazeed details aur analysis yeh hain:

                            Formation:

                            First Candle: Ek long bullish candle hoti hai jo strong buying pressure ko represent karti hai.

                            Second Candle: Yeh candle gap up ke saath open hoti hai lekin closing first candle ke body ke midpoint ke neeche hoti hai.


                            Significance:

                            Trend Reversal: Yeh pattern indicate karta hai ke bullish trend weak ho raha hai aur bearish trend shuru ho sakta hai.

                            Confirmation: Yeh pattern usually tab confirm hota hai jab third candle bhi bearish hoti hai, jo selling pressure ko mazid confirm karti hai.


                            Trading Strategy:

                            Entry Point: Jab Dark Cloud Cover Pattern confirm hota hai, traders short positions initiate kar sakte hain ya existing long positions ko close kar sakte hain.

                            Stop Loss: Stop loss usually second candle ke high ke upar set kiya jata hai.

                            Target: Profit targets pichle support levels ya Fibonacci retracement levels ke base par set kiye ja sakte hain.


                            Volume Analysis:

                            Agar second bearish candle ke formation ke time par volume high ho, toh yeh pattern mazid significant ho jata hai kyunki yeh indicate karta hai ke selling pressure strong hai.

                            Yeh pattern usually daily or higher time frames par zyada reliable hota hai aur traders isse market sentiments ko samajhne ke liye use karte hain.
                            • <a href="https://www.instaforex.org/ru/?x=ruforum">InstaForex</a>
                            • #15 Collapse

                              Dark Cloud Cover Pattern Kya Hai?


                              Dark Cloud Cover Pattern Ka Ta'aruf

                              Dark Cloud Cover ek technical analysis ka pattern hai jo share market aur forex trading me price reversals ko identify karne ke liye istemal hota hai. Ye pattern do candlesticks ke combination se bana hota hai aur iska istemal trend reversal ko predict karne ke liye hota hai. Is pattern ko "Dark Cloud Cover" is liye kaha jata hai kyunki ye ek bearish signal provide karta hai jo bullish trend ko nishana banata hai.

                              Pattern Ka Dhancha

                              Dark Cloud Cover pattern ka tajziya karte hue, humein do mukhya candlesticks ka dhyan rakhna padta hai:
                              1. Pehla Candlestick: Ye candlestick ek lambi white (bullish) candlestick hoti hai jo ki ek uptrend ki indication hoti hai. Iska matlab hai ke market me buying pressure zyada hai aur price upar ja rahi hai.
                              2. Dusra Candlestick: Ye candlestick ek black (bearish) candlestick hoti hai jo ki pehle din ke closing price ke above open hoti hai lekin uske baad price neeche girti hai aur closing price pehli candlestick ki closing price se kam hoti hai. Ye bear market ki shuruaat ko indicate karta hai.

                              Pattern Ka Interpretation

                              Dark Cloud Cover pattern tab ban jata hai jab market me ek strong bullish trend ke baad, agle din ek bearish candle form hoti hai jo pehle din ki closing price se upar open hoti hai aur us din ke dauran price girti hai. Is pattern ka matlab hai ke buying pressure kam ho gaya hai aur selling pressure zyada ho gaya hai. Jab ye pattern ban jata hai, to ye ek bearish reversal ka signal hota hai jo market ke trend ko reverse kar sakta hai.

                              Pattern Ka Use

                              Dark Cloud Cover pattern ka istemal karte waqt, traders ko kuch cheezon ka khayal rakhna padta hai:
                              1. Confirmation: Ye pattern tab zyada reliable hota hai jab uske baad ek confirmatory bearish candle ban jati hai. Agar agle din bhi bearish movement continue hoti hai, to pattern ka signal zyada strong hota hai.
                              2. Volume Analysis: High trading volume bhi Dark Cloud Cover pattern ko confirm karne me madadgar hota hai. Jab pattern ke saath high volume hota hai, to iska matlab hai ke market me selling pressure zyada hai.
                              3. Support Levels: Traders ko pattern ke formation ke dauran key support levels ka bhi dhyan rakhna chahiye. Agar price support levels se break ho jati hai, to bearish trend zyada strong ho sakta hai.

                              Limitations Aur Precautions

                              Dark Cloud Cover pattern ko trade karte waqt kuch limitations aur precautions ka bhi dhyan rakhna zaroori hai:
                              1. False Signals: Kabhi kabhi ye pattern false signals bhi de sakta hai. Isliye traders ko pattern ke saath aur bhi technical indicators ka use karna chahiye taake zyada accurate predictions mil sakein.
                              2. Market Conditions: Market ki overall conditions aur news events bhi pattern ke effectiveness ko affect kar sakte hain. Isliye traders ko market ki broader conditions ka bhi analysis karna chahiye.

                              Nateejah

                              Dark Cloud Cover pattern ek important tool hai jo traders ko market ke trend reversal ko predict karne me madad karta hai. Lekin, is pattern ka istemal karte waqt confirmation signals aur market conditions ka bhi khayal rakhna zaroori hai taake accurate trading decisions liye ja sakein.

                              اب آن لائن

                              Working...
                              X