Ladder bottom pattern explained in forex
X
  • وقت
  • دکھائیں
Clear All
new posts
  • #1 Collapse

    Ladder bottom pattern explained in forex
    LADDER BOTTOM PATTERN EXPLAINED IN FOREX

    LADDER BOTTOM PATTERN DESCRIPTION

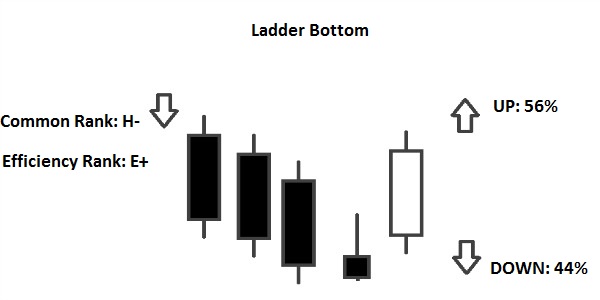
    Ladder bottom pattern ek candlestick chart pattern hai jo market mein trend reversal ko darust karti hai. Yeh pattern uptrend ke baad ata hai aur downward trend ki starting point hoti hai.Ladder bottom pattern forex mein ek candlestick chart pattern hai jo trend reversal ko darust karta hai. Is pattern ko uptrend ke baad dekha jata hai, jab market mein kuch downtrend candles aati hain, phir ek long bullish candle aati hai jo previous candles ki low levels se neeche nahi jaati. Yeh pattern uptrend ki shuruaat ko darust karta hai aur traders isay trend reversal ka indication samajhte hain.

    Click image for larger version

Name:	image_167816.png
Views:	39
Size:	6.4 کلوبائٹ
ID:	12932078

    UPTREND CONFIRMATION
    Is pattern ko confirm karne ke liye, traders dusre technical indicators ka bhi istemal karte hain. Ladder bottom pattern ko pehchanne ke liye, aapko pehle ek uptrend dekhna hai, phir market mein kuch downtrend candles aati hain aur phir ek long bullish candle aati hai jo previous candles ki low levels se neeche nahi jaati. Is pattern ki tashkhis karne ke liye, aapko dekhna hota hai ke kya previous downtrend candles ke baad ek long bullish candle aati hai jo aik naye uptrend ki shuruaat darust karti hai.

    Click image for larger version

Name:	image_167817.png
Views:	38
Size:	5.4 کلوبائٹ
ID:	12932079

    TRADING STRATEGY
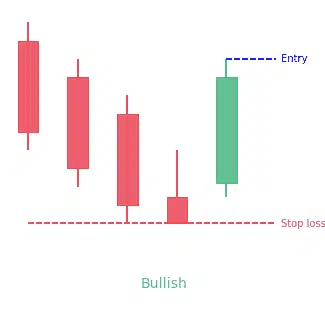
    Ladder bottom pattern ki trading strategy mein, traders usually buy positions lete hain jab yeh pattern confirm hota hai, aur stop-loss orders previous low ke neeche lagate hain.

    Click image for larger version

Name:	images (39).png
Views:	38
Size:	4.5 کلوبائٹ
ID:	12932080

    Ladder bottom pattern ek powerful trend reversal indicator hai jo traders ko market ke direction change ka pata lagane mein madad karta hai, lekin isay confirm karne ke liye dusre technical indicators ka bhi istemal kiya jata hai.
    Last edited by ; 30-04-2024, 07:50 PM.
  • <a href="https://www.instaforex.org/ru/?x=ruforum">InstaForex</a>
  • #2 Collapse

    Drawbacks of Ladder Bottem Pattern in Forex

    Introduction:

    Ladder bottom pattern ek forex trading mein aham chart pattern hai jo traders ko market ka direction samajhne mein madad karta hai. Lekin, is pattern ke bhi kuch drawbacks hain jo traders ko samajhne zaroori hain.Ladder bottom pattern ke drawbacks ko samajhna traders ke liye zaroori hai taake woh isko sahi tareeqe se istemal kar sakein. Is pattern ke sath sath, traders ko additional analysis aur risk management techniques ka bhi istemal karna chahiye taake woh market ke fluctuations ke sath sath apni trading performance ko bhi improve kar sakein.

    Click image for larger version  Name:	images (13).jpeg Views:	0 Size:	25.0 KB ID:	12932232

    1.Ghalat Signals

    Ladder bottom pattern kabhi-kabhi ghalat signals bhi generate kar sakta hai, jismein trader ko galat tajziya karne par majboor kar sakta hai, aur nuqsan uthana pade.

    2.False Breakouts

    Is pattern mein false breakouts ka khatra hota hai, jismein price ek particular level ko cross karke trend reversal ki ummeed dikhata hai, lekin baad mein wapas original direction mein chala jata hai.

    3.Lagging Indicator

    Ladder bottom pattern lagging indicator hai, matlab yeh price ke peechay chalta hai, is liye iske signals ko samajhna aur action lena waqt lagata hai, jiski wajah se traders nuqsan utha sakte hain.

    4.Low Accuracy

    Kuch maamoolan, ladder bottom pattern ki accuracy kam hoti hai, khas kar short time frames mein, jahan price ki volatility zyada hoti hai aur patterns ko samajhna mushkil ho jata hai.

    5. Subjectivity

    Is pattern ki interpretation mein subjectivity hoti hai, matlab har trader isko alag tareeqe se samajhta hai, jiski wajah se confusion ho sakti hai aur galat faislay ho sakte hain.

    6.Lack of Confirmation

    Ladder bottom pattern ke signals ko confirm karne ke liye additional indicators ki zaroorat hoti hai, jaise ki volume, trend lines, aur oscillators, jo traders ke liye extra complexity create kar sakte hain.

    Click image for larger version  Name:	images (13).jpeg Views:	0 Size:	25.0 KB ID:	12932233

    7.Market Noise

    Market mein noise ya phir false signals hone ki wajah se, ladder bottom pattern ki validity mein shak ho sakta hai, aur traders ko galat faislay karne par majboor kar sakta hai.

    8.Risk Management Challenges

    Is pattern ke istemal mein risk management kaafi mushkil ho sakti hai, kyun ke false signals aur volatility ki wajah se traders ka exposure badh sakta hai, jiski wajah se nuqsan uthane ka khatra bhi badh jata hai.

    Click image for larger version

Name:	images (5).png
Views:	34
Size:	8.2 کلوبائٹ
ID:	12932236

    9.Psychological Impact

    False signals aur nuqsan uthane ka khatra, traders ke zehni dabao ko bhi barha sakta hai, jiski wajah se unka confidence kam ho sakta hai aur trading performance par asar pad sakta hai.

    10.Limited Application

    Ladder bottom pattern ka istemal sirf specific market conditions mein hi mumkin hai aur har waqt kaam nahi karta, jiski wajah se traders ko multiple strategies aur tools ka istemal karna parta hai.

    • #3 Collapse

      Click image for larger version

Name:	Ladder bottom pattern explained in forex.png
Views:	39
Size:	3.3 کلوبائٹ
ID:	12932290

      "Ladder Bottom" pattern forex trading mein ek bullish reversal pattern hai jo price chart par dikhai deta hai. Yeh pattern typically downtrend ke baad form hota hai aur indicate karta hai ke market mein potential trend reversal hone wala hai. Neeche Ladder Bottom pattern ke mukamal points Roman Urdu mein diye gaye hain:


      Pattern Ki Tashkeel:

      Ladder Bottom pattern ek series of candlesticks se banta hai jo ek downtrend ke baad dikhai deta hai. Is pattern mein typically teen se chaar candlesticks shamil hote hain.

      Pehla Candlestick:

      Pehla candlestick ek long bearish candle hota hai jo downtrend ko represent karta hai. Is candlestick ka size bada hota hai aur sellers ke control ko indicate karta hai.

      Doosra Candlestick:

      Doosra candlestick ek short body wala candle hota hai jo pehle candlestick ke neeche open hota hai lekin uske neeche close hota hai. Is candlestick ko "hammer" ya "doji" ke roop mein bhi dekha ja sakta hai.

      Teesra Candlestick:

      Teesra candlestick ek long bullish candle hota hai jo doosre candlestick ke above open hota hai aur uske neeche close hota hai. Is candlestick ka size bada hota hai aur buyers ke control ko indicate karta hai.

      Volume:

      Ladder Bottom pattern ke formation ke samay volume ka bhi dhyan diya jaata hai. Ideal scenario mein, volume pehle candlestick ke time period mein increase hota hai, doosre candlestick ke time period mein decrease hota hai, aur teesre candlestick ke time period mein phir se increase hota hai.

      Confirmation:

      Ladder Bottom pattern ke confirmation ke liye traders price ke upar ki movement ka wait karte hain. Agar price teesre candlestick ke high ko break kar leta hai, toh yeh ek bullish confirmation signal ho sakta hai.

      Stop-loss aur Target:

      Traders apni positions ko manage karne ke liye stop-loss aur target levels set karte hain. Stop-loss typically pattern formation ke neeche set kiya jaata hai, jabki target level ko previous swing high ya resistance level ke aas paas set kiya ja sakta hai. Ladder Bottom pattern ek bullish reversal signal hai jo traders ko potential buying opportunities ke baare mein batata hai. Lekin, jaise har technical pattern ke saath hota hai, is pattern ke istemal se pehle confirmation aur risk management ka dhyan rakha jaana zaroori hai.
      • #4 Collapse

        Click image for larger version

Name:	Ladder.jpeg
Views:	39
Size:	24.7 کلوبائٹ
ID:	12932298

        Forex trading mein 'ladder bottom' pattern ek ahem bullish reversal pattern hai jo teen candlesticks se mil kar banta hai. Yeh aam tor par ek downtrend ke end par aata hai aur market ke rukh mein mukhtalif halaat ka ishaara deta hai. Yahan pattern aur iski ahmiyat ka tafseeli bayan hai:


        Banawat:

        Ladder bottom pattern teen musalsal candlesticks se bana hota hai: Pehla candlestick lamba bearish candle hota hai, jis mein zyada bechnay ki dabao ki nishaani hoti hai. Dusra candlestick chhota body wala hota hai jisme chhote se wicks hote hain, yeh market mein tajwez par shak hota hai. Teesra candlestick lamba bullish candle hota hai jo pehle candlestick ke high se upar band hota hai, yeh downtrend ka palatne ka ishaara deta hai.


        Tasavvur:

        Yeh pattern market ke jazbat mein tabdeeli ka numainda hai, bearish se bullish. Lambi bearish candlestick mazboot bechnay ki dabao ko darust karti hai, lekin doosri candlestick mein choti body ka hona dikhata hai ke bechnay walay hosla haar rahe hain. Aakhir mein lambi bullish candlestick dikhata hai ke kharidnay walay dobara control mein aagaye hain, keemat ko ooper lekar aur naye uptrend ko shuru karte hue.

        Tasdeeq:

        Jabki ladder bottom pattern dekhna bullish signal ho sakta hai, traders aksar trade mein dakhil hone se pehle mazeed tasdeeq talash karte hain. Yeh tasdeeq doosray technical indicators se bhi aa sakti hai jaise ke moving averages, trendlines, ya volume analysis. Masalan, traders price ko kisi ahem resistance level ke upar se guzarne ya moving average par bullish crossover ka intezar kar sakte hain ke palatne ka tasdeeq karain.

        Ahmiyat:

        Ladder bottom pattern forex traders ke liye ahem hai kyun ke yeh unhein mumkinah trend reversals ko pehchaanne mein madad karta hai jaldi, jo unhein faiday de sakta hai achay prices par trade karne ka mouqa. Is pattern ko pehchan kar, traders market sentiment ka palatne ka faida utha sakte hain aur khud ko mukhtalif currencies ki trading mein faiday ke liye position mein daal sakte hain jab price ooper lekar chalne lagti hai.

        Risk Management:

        Jesa ke har trading pattern mein hota hai, risk management ladder bottom pattern trading ke doran bhi ahem hai. Traders ko hamesha stop-loss orders ka istemal karna chahiye taake nuksan ko had se zyada na hone diya jaye agar palatne ki umeed puri na ho. Iske ilawa, traders ko mukhtalif market context, fundamental factors aur aane wale events ko bhi mad e nazar rakhna chahiye jo unke trading pair ko asar andaz ho sakti hain. Akhiri mein, ladder bottom pattern ek bullish reversal pattern hai forex trading mein jo ek downtrend ka khatma aur naye uptrend ki shuruwat ka ishaara karta hai. Jabke is pattern ko pehchanna ahem hai, traders ko hamesha doosray technical indicators se tasdeeq hasil karne aur sahi risk management ka amal karna chahiye taake unke kamyabi ke chances barh
        • #5 Collapse

          Click image for larger version

Name:	Ladder bottoms.png
Views:	30
Size:	1.1 کلوبائٹ
ID:	12932308Click image for larger version

Name:	Ladder bottom.gif
Views:	38
Size:	43 بائٹ
ID:	12932307

          Ladder bottom pattern forex mein ek aham chart pattern hai jo traders ke liye useful hota hai. Ye pattern downtrend ke baad ek possible trend reversal indicate karta hai. Yeh kuch tafseeli points ke sath samjha jaa sakta hai:


          Downtrend:

          Pehle toh dekha jaata hai ke price mein ek consistent downtrend hai. Yani ke prices continuously neeche ki taraf ja rahe hain.

          Price Decline:

          Downtrend ke doran, prices mein decline hota hai jo ki slow ya steady ho sakta hai.

          Volume:

          Jab price neeche jaata hai, volume mein bhi decline hoti hai. Yeh ek indication ho sakta hai ke selling pressure kam ho rahi hai.

          Consolidation:

          Ek point par, prices mein ek consolidation phase dikhai dene lagta hai. Yeh consolidation range mein hota hai, matlab ke prices mein koi significant change nahi hota.

          Uptick in Volume:

          Is consolidation phase mein volume mein izafa ho sakta hai, indicating ke traders mein interest phir se barh raha hai.

          Breakout:

          Jab consolidation complete hota hai, price ek upward breakout dikha sakta hai. Yeh breakout confirmation ke tor par dekha ja sakta hai agar price consolidation range ko break kar ke upar jaata hai.

          Reversal Confirmation:

          Agar price consolidation ke baad upar jaata hai aur volume bhi increase hoti hai, toh yeh ek reversal ka strong indication ho sakta hai. Yeh points mila kar ladder bottom pattern ko identify kiya ja sakta hai. Ye pattern traders ke liye helpful hota hai kyunki isse potential trend reversal ki indication milti hai, jo trading opportunities ko identify karne mein madad karta hai.


          • #6 Collapse

            Forex trading ek dynamic aur challenging field hai jahan traders ko constantly market ki harkaton ka tajziya karna parta hai. Chart patterns, jaise ke Ladder Bottom pattern, traders ko market trends aur possible reversals ka pata lagane mein madad karte hain. Iss article mein hum Ladder Bottom pattern ke tafseel se muta'alliq guftagu karenge, iske components, formation, aur trading strategies par tawajjo dene ke saath saath.

            1. Ladder Bottom Pattern: Introduction

            Ladder Bottom pattern ek bullish reversal pattern hai jo market ke downtrend ke baad ban sakta hai. Is pattern ka naam isliye hai kyunki jab yeh ban jata hai, toh chart par ladder ki shakal mein nazar aata hai, jismein multiple bottoms shamil hote hain. Traders ke liye yeh ek aham tool hai kyunki isse market mein hone wale changes ka pata lagaya ja sakta hai.

            2. Ladder Bottom Pattern: Components

            Ladder Bottom pattern ke kuch mukhya components hain jinhe samajhna zaroori hai:

            a. Multiple Bottoms: Ladder Bottom pattern mein market mein do ya zyada bottoms hote hain jo ek doosre ke barabar hote hain. Yeh bottoms horizontal line ke qareeb hote hain aur ek bullish reversal ka indication dete hain. In bottoms ki positioning aur strength pattern ki reliability ko affect karte hain.

            b. Volume: Jab Ladder Bottom pattern ban raha hota hai, toh volume bhi izafa hota hai. Volume ka izafa bullish reversal ki confirmation deta hai. Agar volume ke saath price bhi upar ja rahi hai, toh yeh bullish reversal ko confirm karta hai. Volume ki positioning aur trend ke saath ta'alluqat ko samajhna pattern ki validity ke liye zaroori hai.

            c. Price Action: Price action ki observation bhi ahem hai. Is pattern mein price ki movement ka tajziya kiya jata hai, khas karke bottoms ke darmiyan ke movement ka. Agar price bottoms ke darmiyan strong bullish movement dikhata hai, toh yeh pattern ki reliability ko barhata hai. Candlestick patterns aur price behavior ki analysis is component ko samajhne mein madadgar hoti hai.

            3. Ladder Bottom Pattern: Formation

            Ladder Bottom pattern ki formation, market ke downtrend ke baad hoti hai. Yeh pattern market ki bottoming process ke doran ban sakta hai, jab price horizontal level par stabilize hone lagti hai aur multiple bottoms formation shuru ho jate hain. Is phase mein, traders ko market sentiment aur price dynamics ko samajhne ki zaroorat hoti hai.

            4. Downtrend

            Ladder Bottom pattern ki formation ke pehle, market mein strong downtrend hota hai jahan price continuously neeche ki taraf ja rahi hoti hai. Yeh downtrend ki duration aur intensity pattern ki reliability par asar daal sakta hai. Downtrend ke characteristics aur trend reversal ke signs ko samajhna pattern ke samajhne mein madadgar hota hai.

            5. Bottoming Process

            Bottoming process mein market ki downtrend khatam hone lagti hai aur price horizontal level par stabilize hone lagti hai. Is doran, multiple bottoms formation shuru ho jate hain, jo Ladder Bottom pattern ki formation ka aham hissa hai. Bottoming process ke duration aur bottoms ki positioning ko samajhna pattern ke samajhne mein madadgar hota hai.

            6. Bottoms Formation

            Bottoming process ke doran, market mein do ya zyada bottoms formation shuru ho jate hain jo ek doosre ke barabar hote hain aur horizontal line ke qareeb hote hain. Bottoms ki strength aur unki positioning pattern ki reliability ko affect karte hain. In bottoms ki analysis ke liye traders ko price action ke sath-sath market depth bhi dekhna zaroori hai.

            7. Volume Confirmation

            Ladder Bottom pattern ke sath, volume bhi increase hota hai jo bullish reversal ko confirm karta hai. Volume ka izafa pattern ki validity ko barhata hai. Agar volume bottoms ki formation ke sath izafa kar raha hai, toh yeh bullish reversal ka indication hai. Volume ki analysis ke liye traders ko volume patterns aur price volume relationship ko dekhna chahiye.

            8. Price Action Confirmation

            Price action ki observation se bhi Ladder Bottom pattern ki confirmation hoti hai, jahan bottoms ke darmiyan ki movement ko dekha jata hai. Agar price bottoms ke darmiyan strong bullish movement dikhata hai, toh yeh pattern ki reliability ko barhata hai. Candlestick patterns aur price behavior ki analysis is component ko samajhne mein madadgar hoti hai.

            9. Entry Points

            Ladder Bottom pattern ko identify karne ke baad, traders entry points tay karte hain jahan wo trade enter karna chahte hain. Entry points ki positioning aur risk management pattern ke successful istemal par asar daal sakta hai. Entry points ki determination ke liye traders ko price levels aur market dynamics ka analysis karna chahiye.

            10. Stop Loss aur Target Levels

            Har trade mein stop loss aur target levels ko define karna zaroori hai. Ladder Bottom pattern ke case mein, stop loss neeche bottoms ke neeche aur target levels upar ki taraf set kiye jate hain. Stop loss aur target levels ki sahi positioning aur execution trading plan ko safalta se anjam dene mein madad karte hain. Stop loss aur target levels ki positioning ke liye traders ko risk reward ratio aur market volatility ko madhyaan mein rakhte hue tay karna chahiye.

            Nateeja

            Ladder Bottom pattern aik powerful bullish reversal pattern hai jo traders ko market ke trend ka pata lagane mein madad karta hai. Isko samajhna aur sahi tajziya karna traders ke liye ahem hai taake wo sahi waqt par trading decisions le sakein. Lekin, har pattern ki tarah, isko bhi mukammal understanding aur risk management ke saath istemal karna chahiye. Pattern ki reliability ko barhane ke liye, traders ko market ke mukhtalif aspects ko dhyan mein rakhna chahiye aur har trade ko carefully plan karna chahiye.

            • #7 Collapse

              Ladder bottom pattern
              Ladder bottom pattern ek candlestick pattern hai jo ke market mein dekha jata hai aur trend reversal ko indicate karta hai. Yeh pattern typically downtrend ke baad dekha jata hai aur bullish reversal ki possibility ko darust karta hai.Ladder bottom pattern ki khasiyat yeh hoti hai ke ismein ek series of candlesticks hoti hai jo ke neeche ki taraf ek staircase ya ladder ki tarah dikhti hai. Har ek candlestick ke low pehle se kam hota hai aur market mein selling pressure kamzor hoti ha


              Ladder Bottom Pattern


              Ladder bottom pattern ko samajhne ke liye, yeh points important hote hain:
              1. Appearance (Zahoor): Ladder bottom pattern ko dekhte hue, traders ko ek staircase ya ladder ki tarah dikhta hai jismein har ek step (candlestick) neeche ki taraf jata hai. Har ek candlestick ki body ke neeche ke shadow (lower wick) lambi hoti hai, jo ke ek potential reversal ko darust karta hai.
              2. Duration (Muddat): Ladder bottom pattern typically kuch din ya kuch weeks ke liye hota hai, lekin iski duration market conditions aur timeframe par depend karta hai.
              3. Volume (Hajm): Ladder bottom pattern ke doran volume typically decrease hota hai, indicating low selling pressure aur market mein bullish sentiment ka increase.
              4. Confirmation (Tasdiq): Ladder bottom pattern ko confirm karne ke liye, traders aur analysts doosre technical indicators aur price action ko bhi dekhte hain, jaise ke volume, trendlines, aur support/resistance levels. Agar price ek key support level se bounce karta hai aur fir se upar ki taraf move karta hai, toh yeh ladder bottom pattern ko confirm karta hai.
              5. Trading Strategy: Jab ladder bottom pattern dekha jata hai, traders ko bullish reversal ki possibility ka andaza hota hai. Traders is pattern ke confirmation ke saath long positions enter kar sakte hain ya short positions ko cover kar sakte hain. Stop-loss orders ko set karna aur profit targets ko determine karna important hota hai trading strategy ke hisab se.Yeh important hai ke kisi bhi candlestick pattern ke trading decisions ko lete waqt market context aur dusre factors ko bhi ghor se dekha jaye, aur sahi risk management ka istemal kiya jaye.

              • #8 Collapse

                Ladder bottom pattern explained in forex

                Click image for larger version

Name:	download (16).png
Views:	29
Size:	6.3 کلوبائٹ
ID:	12932667
                Forex mein trading karte waqt, traders aksar chart patterns ka istemal karte hain taake market trends ko samajh sakein aur sahi waqt par trades execute kar sakein. Ek aham aur common chart pattern jo traders ke liye useful hota hai woh "ladder bottom" pattern hai.

                Ladder bottom pattern typically bullish markets mein dekha jata hai aur yeh market ke trend ka reversal signal deta hai. Is pattern ko samajhne ke liye, traders ko price action aur volume ke movements ko closely observe karna hota hai.

                Is pattern ko recognize karne ke liye, pehle traders ko ek downtrend mein price movement ko dekhna hota hai, jahan market ki prices continuously neeche ja rahi hoti hain. Phir ek stage aata hai jab prices stabilize ho jaati hain aur phir slowly upward movement start hoti hai. Is movement ke dauran, traders ko multiple swing lows notice hote hain, jinme se kuch lows previous lows se higher hote hain.

                Jab yeh higher swing lows bante hain aur ek particular level par ek saath aate hain, jise "support level" kaha jata hai, tab ladder bottom pattern form hone lagta hai. Yeh indicate karta hai ke sellers ke power kam hoti ja rahi hai aur buyers ka dominance increase ho raha hai.

                Is pattern ke confirmation ke liye, traders ko volume ka bhi dhyan dena hota hai. Agar jab prices upar ja rahe hote hain aur volume bhi increase ho raha hota hai, toh yeh bullish reversal ke liye strong confirmation provide karta hai.

                Ladder bottom pattern ke mukhtalif components ko samajh kar, traders sahi waqt par trades enter kar sakte hain aur profits earn kar sakte hain. Lekin, hamesha yaad rahe ke kisi bhi chart pattern ki accuracy 100% nahi hoti, isliye risk management ko bhi dhyan mein rakhte hue trades execute karna zaroori hai.
                • #9 Collapse

                  Ladder bottom pattern explained in forex


                  Ladder bottom pattern kya hai?


                  Click image for larger version

Name:	IMG_0834.jpeg
Views:	32
Size:	13.6 کلوبائٹ
ID:	12932960


                  Ladder bottom pattern ek forex trading pattern hai jo bearish trend ke aakhir mein banta hai. Yah pattern do ya do se zyada consecutive lower lows aur horizontal support lines se banta hai. Lower lows ke beech ki distance takriban barabar hoti hai, aur horizontal support lines parallel hoti hain.

                  Ladder bottom pattern kaise banta hai?

                  Ladder bottom pattern tab banta hai jab sellers bazaar mein dominant hote hain. Sellers bazaar mein prices ko kam karte hain, aur lower lows banaate hain. Buyers bazaar mein enter karne ki koshish karte hain, lekin sellers unhen rokte hain. Is tarah, prices horizontal support levels par stuck ho jaate hain.

                  Ladder bottom pattern ka kya matlab hai?

                  Ladder bottom pattern ek potential trend reversal signal hai. Yah pattern is baat ka signal deta hai ki sellers ki taqat kam ho rahi hai, aur buyers ki taqat badh rahi hai. Isliye, yah potential bullish trend ki shuruaat ka signal ho sakta hai.

                  Ladder bottom pattern ka trade kaise karen?

                  Ladder bottom pattern ka trade karne ke liye, aapko horizontal support lines ko identify karna hoga. Entry pointhorizontal support level se thoda upar hona chahiye. Stop loss horizontal support level se thoda niche hona chahiye. Profit target previous resistance level ho sakta hai.

                  Ladder bottom pattern ke kuchh tips:
                  • Ladder bottom pattern ko confirm karne ke liye, volume mein increase hona chahiye.
                  • Ladder bottom pattern ko trade karne se pahle, market sentiment ka analysis karna chahiye.
                  • Ladder bottom pattern 100% sure trading signal nahi hai. Isliye, risk management karna bahut zaruri hai.
                  • Ladder bottom pattern forex trading mein ek common pattern hai.
                  • Ladder bottom pattern ko properly identify karne aur trade karne se aapka profit ho sakta hai.
                  • Ladder bottom pattern ko trade karne se pahle, risk management karna bahut zaruri hai.
                  • #10 Collapse


                    Ladder bottom pattern explained in forex


                    Forex trading ek jazbati duniya hai jahan har pal koi naya mazaq, har naye trend, aur har naye pattern aapko samnay ata hai. Ek aham tajziya jo traders ko madad karta hai, wo chart patterns hote hain. In patterns ko samajhna aur unka istemal karna trading ke liye bohot zaroori hai. Ek aham aur mufeed pattern jo traders ke liye faida mand sabit ho sakta hai, wo "Ladder Bottom" pattern hai.
                    Ladder Bottom Pattern Kya Hai?
                    Ladder Bottom pattern ek bullish reversal pattern hai, jo market ke neeche ke trend ke badalne ka pata lagane mein madad deta hai. Ye pattern typically downtrend ke doran develop hota hai aur ek reversal ki indication deta hai. Jab ye pattern develop hota hai, to ye ek signal hai ke market ka trend badalne wala hai aur bullish momentum shuru hone wala hai.
                    Ladder Bottom Pattern Ki Shanaakht Kaise Ki Jati Hai?
                    Ladder Bottom pattern ko pehchane ke liye, kuch key characteristics ko dekhna zaroori hai:
                    1. Multiple Bottoms: Is pattern mein typically 3 ya zyada bottoms hote hain jo horizontal ya near-horizontal hote hain.
                    2. Stair Step Shape: In bottoms ka shape ek ladder ki tarah hota hai, jahan har neeche ka bottom pehle se zyada uncha hota hai.
                    3. Volume: Bottoms ke sath sath, volume bhi dekha jata hai. Typically, jab price ne neeche ki taraf move kiya ho aur volume bhi increase ho raha ho, to ye ek bullish reversal indication hai.
                    4. Breakout Confirmation: Jab pattern complete ho jata hai, traders ek breakout ki confirmation ka wait karte hain. Breakout ke baad, price ka upward movement dekha jata hai jo bullish reversal ko confirm karta hai.


                    Ladder Bottom Pattern Ka Istemal Kaise Kiya Jaye?
                    Ladder Bottom pattern ka istemal karne ke liye, traders ko kuch points par ghor karna zaroori hai:
                    1. Pattern Ki Tafseel: Pehle to traders ko pattern ki tafseel samajhni zaroori hai. Iske liye, past charts par practice karna aur pattern ki pehchan karna zaroori hai.
                    2. Confirmation Signals: Pattern ko confirm karne ke liye, traders ko breakout ka wait karna chahiye. Breakout ke baad, agar price strong bullish movement dikhata hai to ye pattern ki confirmation hai.
                    3. Risk Management: Har trading strategy mein risk management ka ek crucial hissa hota hai. Ladder Bottom pattern ka istemal karte waqt bhi, traders ko apne stop loss aur take profit levels ko define karna zaroori hai.
                    4. Multiple Time Frame Analysis: Ek aur important tip ye hai ke traders ko multiple time frame analysis karna chahiye. Agar Ladder Bottom pattern daily chart par dikhta hai, to usko confirm karne ke liye lower time frames par bhi check karna zaroori hai.


                    Ladder Bottom Pattern Ka Istemal Karne Ke Fawaid
                    Ladder Bottom pattern ka istemal karne ke kai fawaid hote hain:
                    1. Early Reversal Signals: Ye pattern traders ko early reversal signals deta hai, jis se wo early entry kar ke potential profits earn kar sakte hain.
                    2. Defined Risk: Pattern ki confirmation ke baad, traders apna risk define kar sakte hain, jis se unka loss minimize ho sakta hai.
                    3. High Probability Trades: Ladder Bottom pattern typically high probability trades provide karta hai, agar sahi tafseel aur risk management ke saath istemal kiya jaye.
                    4. Confidence Boost: Agar traders ko pattern ko samajhne aur istemal karne ka tajurba ho, to unka confidence trading mein barh jata hai.


                    Ikhtitami Alfaz
                    Ladder Bottom pattern forex trading mein ek ahem tool hai jo traders ko bullish reversal signals provide karta hai. Is pattern ko samajhna aur istemal karna zaroori hai, lekin us se pehle traders ko sahi tafseel aur risk management ka ghor karna chahiye. Agar sahi tariqe se istemal kiya jaye, to Ladder Bottom pattern trading mein ek faida mand tool sabit ho sakta hai.


                    • #11 Collapse

                      Ladder bottom pattern explained in forex


                      Click image for larger version

Name:	download (2).jpg
Views:	32
Size:	13.6 کلوبائٹ
ID:	12933092

                      "Ladder bottom pattern" ya "Seedhiyon ka Nichla Pattern" forex trading mein ek makhsoos candlestick pattern hai jo market mein trend reversal ya trend continuation ko darust karne mein madadgar hota hai. Yeh pattern typically downtrend ke doran nazar ata hai aur market ke bottoming process ko darust karta hai.

                      Seedhiyon ka Nichla Pattern, jab market mein trend reversal hone ka pata lagta hai, tab dekha jata hai. Yeh pattern typically neeche batnay wali price movements ke doran nazar ata hai.

                      Is pattern ko pehchanne ke liye, kuch key features hain:
                      1. Multiple Candles (Mukhtalif Mombattiyan): Seedhiyon ka Nichla Pattern mukhtalif mombattiyon se bana hota hai jo ek sath neeche ja rahi hoti hain. Yeh pattern typically 3 se 5 mombattiyon mein dekha ja sakta hai.
                      2. Gradual Downward Movement (Darust Neeche Jaane Wala Harkat): Seedhiyon ka Nichla Pattern mein mombattiyon ki gradual downward movement hoti hai, lekin har ek mombatti ki body chhoti hoti hai.
                      3. Formation of "Steps" (Seedhiyon ki Bunyadi Banao): Is pattern mein, mombattiyon ki shapes ko dekhte hue lagta hai ke seedhiyon ko neeche se upar ki taraf utha diya gaya hai. Yeh "steps" ki tarah lagte hain, jis se is pattern ka naam bhi mila hai.
                      4. Volume Analysis (Hajum ki Tahlil): Seedhiyon ka Nichla Pattern ko confirm karne ke liye traders volume analysis bhi karte hain. Agar volume downtrend ke doran barh raha hai aur seedhiyon ka nichla pattern ban raha hai, to yeh trend reversal ki possibility ko barhata hai.

                      Jab traders Seedhiyon ka Nichla Pattern ko dekhte hain, to yeh ek potential trend reversal ya trend continuation ki nishani hoti hai. Lekin, hamesha yaad rakhein ke kisi bhi pattern ki guarantee nahi hoti aur isko confirm karne ke liye aur apni trading strategy ko validate karne ke liye aur technical analysis ke tools ka istemal karna zaroori hota hai.
                      • #12 Collapse

                        Forex Market Ladder Bottom Pattern*&*&*&*&*&

                        Forex Market mein "Ladder Bottom Pattern" ek price action pattern hai jo market ke trend reversal ko indicate karta hai. Ye typically downtrend ke baad dekha jata hai aur ye bullish reversal signal deta hai. "Ladder Bottom" ka naam isliye hai kyunki is pattern mein price ke successive low points, ek ladder ke steps ki tarah dikhate hain.

                        Forex Market Ladder Bottom Pattern Ke Features*&*&*&*&*&

                        Is pattern ko samajhne ke liye, kuch key features hain:
                        1. Downtrend: Pehle, market mein ek clear downtrend hona chahiye. Ye downtrend ladder bottom pattern ke hone ke liye zaroori hai.
                        2. Multiple Low Points: Ladder bottom pattern mein, price ek series of lows banata hai jo har ek low pe previous low se higher hota hai. Ye lows ek ladder ki steps ki tarah dikhte hain.
                        3. Increased Volume: Volume is pattern ko confirm karne ke liye important hai. Jab price downtrend se nikal kar upar jaata hai aur ladder bottom pattern form hota hai, tab volume increase hota hai, indicating buying pressure.
                        4. Breakout: Pattern ke formation ke baad, ek breakout hota hai jab price ek resistance level ko cross karta hai, confirming the reversal.
                        5. Confirmation: Is pattern ko validate karne ke liye, traders dusre indicators aur tools ka istemal karte hain jaise ki moving averages, RSI, ya Fibonacci levels.

                        Ladder Bottom Pattern, jaise ki sabhi technical analysis tools aur patterns, 100% perfect nahi hota. Isliye, traders ko is pattern ko samajhne aur us par rely karne se pehle proper risk management aur dusre confirmatory signals ka istemal karna chahiye.
                        • <a href="https://www.instaforex.org/ru/?x=ruforum">InstaForex</a>
                        • #13 Collapse


                          Ladder bottom pattern explained in forex

                          Ladder Bottom Pattern Kya Hai?

                          Ladder Bottom ek bullish reversal chart pattern hai jo forex trading mein price trend ki reversal ko indicate karta hai. Ye pattern downtrend ke baad market mein aam hota hai aur bullish trend ki shuruaat ko signify karta hai. Ladder Bottom pattern kisi bhi time frame par dekha ja sakta hai, lekin iski effectiveness higher time frames jese ke daily charts par zyada hoti hai.

                          Click image for larger version

Name:	A42.png
Views:	23
Size:	6.3 کلوبائٹ
ID:	12933503

                          Ladder Bottom Pattern Ki Characteristics:
                          1. Downtrend: Ladder Bottom pattern normaly downtrend ke baad dekha jata hai. Yani price pehle neeche ki taraf move kar rahi hoti hai.
                          2. Multiple Bottoms: Is pattern mein price multiple lows (yani bottom points) banata hai jahan se price bounce back karta hai.
                          3. Gradual Rise: Har bottom point pe price ka gradual rise hota hai jo bullish sentiment ko indicate karta hai.
                          4. Volume: Is pattern mein volume ki increase bhi dekhi ja sakti hai jab price bottoms form hotay hain.
                          5. Breakout: Jab price last bottom ko break karta hai aur ek higher high form karta hai, to ye bullish reversal ko confirm karta hai.
                          Ladder Bottom Pattern Ka Tafsili Tareeqa:

                          Step 1:

                          Downtrend (Neche Ki Taraf Movement):


                          Ladder Bottom pattern usually ek downtrend ke baad dekha jata hai. Price neeche ki taraf move kar rahi hoti hai aur downtrend ka part ban rahi hoti hai.

                          Step 2:

                          Multiple Bottoms (Mukhtalif Low Points):


                          Is pattern mein price multiple bottoms form karta hai. Yani price kuch martabah ek neeche ki taraf jaata hai aur har baar ek naya low form karta hai. Har bottom pe price ka bounce back hota hai, jo ek indication hai ke selling pressure kam ho rahi hai.

                          Step 3:

                          Gradual Rise (Tasalsulati Uper Ki Raftar):


                          Har bottom point pe price ka gradual rise hota hai. Iska matlab hai ke har naya low pe price higher level tak recover kar rahi hoti hai, jo bullish sentiment ko reflect karta hai.

                          Step 4:

                          Volume Ki Increase:


                          Is pattern mein volume bhi increase ho sakti hai jab price bottom formation karta hai. Volume ki increase bullish reversal ko support karta hai.

                          Step 5:

                          Breakout (Uper Ki Taraf Movement):


                          Jab price last bottom ko break karta hai aur ek higher high form karta hai, to ye bullish reversal ko confirm karta hai. Is waqt traders ko entry ka mauqa milta hai.

                          Ladder Bottom Pattern Ka Istemal:

                          Ladder Bottom pattern ka istemal kar ke traders bullish reversal ko identify kar sakte hain aur entry point dhoond sakte hain. Yahan kuch important points hain jo is pattern ke istemal mein madadgar ho sakte hain:
                          1. Confirmation: Ladder Bottom pattern ko confirm karne ke liye price ka breakout zaroori hai. Jab price last bottom ko break karta hai aur higher high banata hai, to ye bullish reversal ko confirm karta hai.
                          2. Entry Point: Traders usually breakout ke baad entry karte hain. Breakout ke baad entry karna traders ko potential uptrend ka hissa banne mein madad deta hai.
                          3. Stop Loss: Har trade ke liye stop loss set karna zaroori hai taake in case of reversal losses minimize kiya ja sake.
                          4. Target: Traders apne target levels ko set karte hain jahan se wo apne profits book kar sakte hain.
                          Ladder Bottom Pattern Ka Example:

                          Misaal ke taur par, agar price ek downtrend mein hai aur multiple bottoms form kar raha hai jahan se har baar price higher level tak recover kar rahi hai, aur jab price last bottom ko break karke ek higher high form karta hai, to ye ek potential ladder bottom pattern ko indicate karega. Is waqt traders entry kar sakte hain bullish reversal ke liye.

                          Conclusion:

                          Ladder Bottom pattern ek powerful chart pattern hai jo bullish reversal ko identify karne aur entry points dhoondne mein madadgar ho sakta hai. Is pattern ki samajh traders ko market ka direction samajhne aur trend changes ko capture karne mein madad deti hai. Is pattern ka istemal karne se pehle, traders ko price action aur trend analysis ki acchi understanding honi chahiye taake wo is pattern ko sahi tareeqe se interpret kar sakein.


                          اب آن لائن

                          Working...
                          X