Mat hold candlestick pattern trading formula.

No announcement yet.
`
X
  • وقت
  • دکھائیں
Clear All
new posts
  • #1 Collapse

    Mat hold candlestick pattern trading formula.
    Mat hold candlestick pattern main centre wali teen candles ko follow kerty huey reverse direction main trade open karni chahiye ky humein is tarah trade kerny per bara loss ho sakta hai jabky agar ham previous trend ky mutabiq trade continue karte hain tou hamein bahut achi earning hasil ho sakti hai.Mat hold candlestick pattern ka matlab hai ky jab market main aesa pattern creat ho jata hai toh uske baad market reverse direction main trend start nahi karti balky apny previous trend ko follow kerty huey hi market apni movement continue kerti hai isliye hamain mat hold candlestick pattern create hony per previous trend ko follow kerty huey trade continue karni chahiye

    Click image for larger version

Name:	mat-hold-pattern-bullish-green-red-round-bullish-continuation-japanese-candlestick-pattern-multiple-patterns-2M06KWM.jpg
Views:	30
Size:	96.2 کلوبائٹ
ID:	12929099

    TYPES OF MAT HOLD CANDLESTICK PATTERN

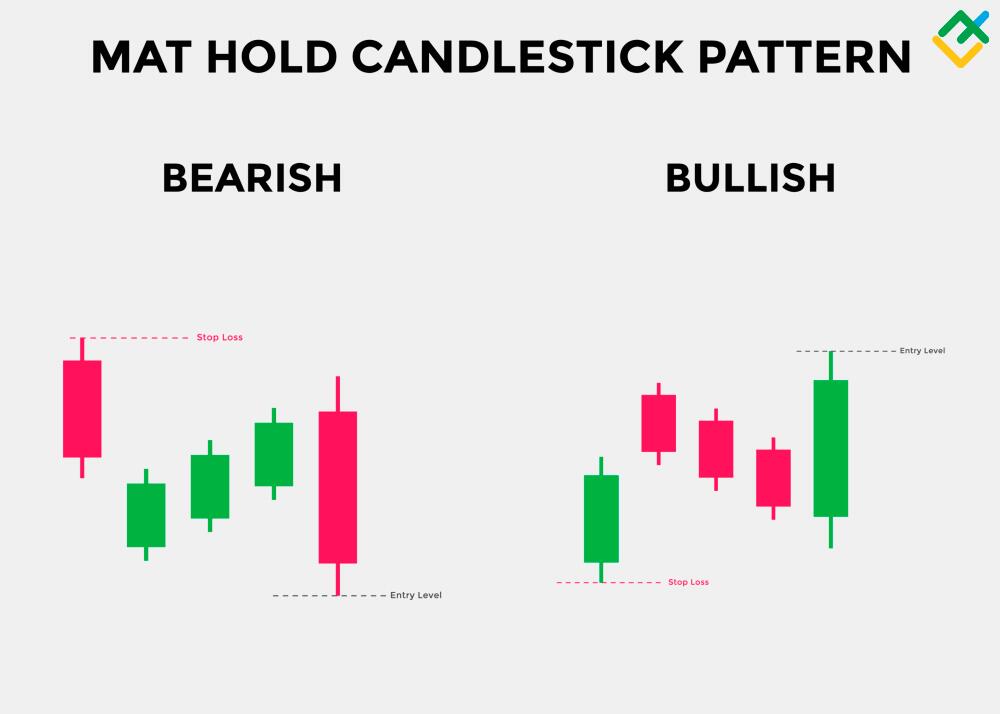
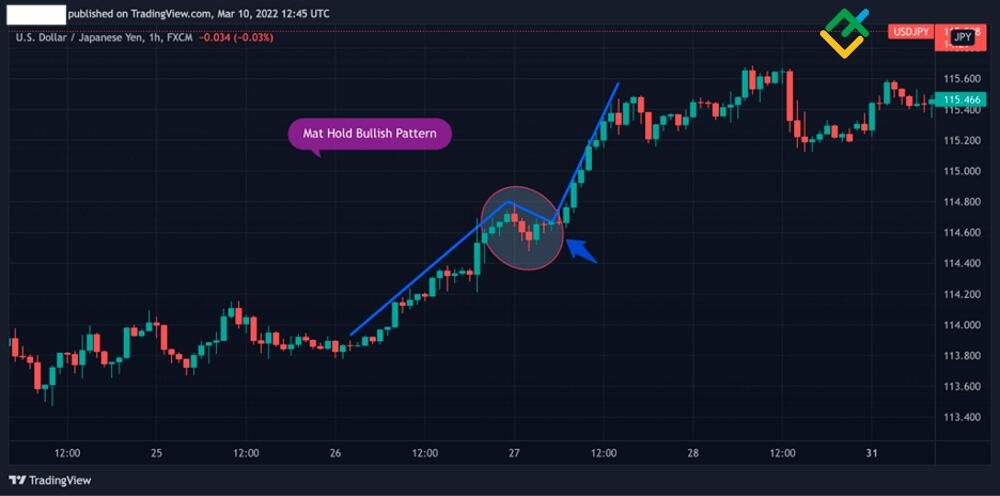
    Agar market continuously bullish trend main movement kerty huey aik bari candle create kerny ky bahd three candle bearish main create kerny ky bahd again bullish main candle create kerti hai tou same pattern bullish mat hold candlestick pattern hota hai jis ko follow kerty huey hamain buy ki trade enter karte hain ky market mat hold pattern create hony per previous trend ko continue rakhne ki confirmation deti hai jis ko follow kerty huey trade continue karni chahiye.Mat hold candlestick pattern ki bhi two types hoti hai bullish mat hold pattern aur bearish mat hold pattern jab market continuously downtrend main movement kerty huey aik bari candle creat kerti hai aur uske baad three candle bullish create kerny ky bahd again aik candle bearish create kerti hai tou easy main bearish mat hold candlestick pattern create hota hai jis per sell ki trade enter karna hota hai jabki


    BULLISH MAT HOLD PATTERN

    Mat hold candlestick pattern middle wali 3 small candlestick hoti hai wo small hoti hai sari previous yani first candle k nechy close hoti hai. Jo last candle hoti hai wo pattern k high point ko manage karny ma kamyab ho jati hai. is pattern ma pehle candlestick bullish or large body ki hoti hai or es k bad wali 3 candlesticks small hoti hai or bearish trend ma hoti hain jb k last candlestick phr sy bullish or large body ki hoti hai.

    Click image for larger version

Name:	bullish-and-bearish-mat-hold-candlestick-patterns-candlestick-chart-pattern-for-traders-powerful-bullish-and-bearish-candlestick-chart-for-forex-stock-cryptocurrency-vector.jpg
Views:	27
Size:	99.9 کلوبائٹ
ID:	12929100

    BEARISH MAT HOLD PATTERN

    Pehle candlestick pattern ma market over sold ho jati hai phr baki 3 candle market ko stable or correct karto hai or last candle ko strength provide karti hai k market phr mazeed down dip kar jati hai.Ye pattern bullish mat hold pattern k opposite banta hai es ma pehle candle bearish hoti hai or market ko down move karwany ma kamyabi ho jati hai.darmiyan wali 3 candle bullish hoti hain jo market ko stable kar deti hai or ye three candles pehle candle k high point sy up move kar jato hai but phr last candle bearish or tall banti hai or market ko ik bar phir sy down move karwany ma kamyab ho jati hai.
  • <a href="https://www.instaforex.org/ru/?x=ruforum">InstaForex</a>
  • #2 Collapse

    Mat hold candlestick pattern
    Mat Hold candlestick pattern ek bullish continuation pattern hai jo trend ke beech mein form hota hai aur indicate karta hai ki bullish trend continue hone ki sambhavna hai. Is pattern mein ek series of candlesticks hoti hai, jismein initial bullish candlestick ko ek consolidation period follow karta hai, fir ek strong bullish candlestick sequence aata hai.


    Yeh kuch key characteristics hote hain Mat Hold candlestick pattern ke:
    1. Initial Bullish Candlestick: Pattern shuru hota hai ek large bullish candlestick ke saath, jo existing uptrend ko represent karta hai.
    2. Consolidation Period: Iske baad ek ya multiple small-bodied candles follow karte hain, indicating ki market mein consolidation phase shuru ho gaya hai. In consolidation candles mein price range narrow hoti hai aur trading volume thoda kam hota hai.
    3. Strong Bullish Continuation: Consolidation period ke baad, ek strong bullish candlestick sequence aata hai, jo initial bullish move ko confirm karta hai aur trend ko continue karne ki sambhavna dikhata hai. Is bullish candlestick sequence ko "mat hold" kehte hain.
    4. Minimal Price Retreat: Mat Hold pattern mein price typically consolidation period ke lows se bahut kam retreat karta hai ya unko break nahi karta.
    5. Volume Confirmation: Is pattern ko confirm karne ke liye, traders volume ki confirmation ka bhi istemal karte hain. Agar mat hold pattern ke saath volume increase hota hai, toh ye bullish continuation ko strengthen karta hai.
    Treading Strategy
    Mat Hold candlestick pattern bullish continuation ko indicate karta hai aur traders ko ye signal deta hai ki existing uptrend mein price ka further upside movement expected hai. Lekin, hamesha yaad rahe ki kisi bhi pattern ko confirm karne se pehle thorough analysis aur risk management ki zarurat hoti hai. Market conditions vary karte rehte hain aur false signals bhi ho sakte hain, isliye trading decisions lene se pehle dhyan se analysis karein.


    • #3 Collapse

      Candlestick Patterns ki Trading Formula: Mat Hold
      1. Mat Hold Candlestick Pattern Kya Hai? Mat hold ek continuation candlestick pattern hai jo uptrend ya downtrend ke doran emerge hota hai. Ye pattern market mein ek strong trend ki continuation ko indicate karta hai. Is pattern mein, ek lamba green candle choti red candle ke baad aata hai, phir ek series of small green candles aati hai.

      Mat hold pattern ka naam "Mat Hold" is liye hai kyunki ismein small green candles ko "holding pattern" kehte hain, jo ek range mein trade hoti hain.
      1. Mat Hold Pattern Ki Pehchan Mat hold pattern ko pehchane ke liye, traders ko pehle green candle ki range doosri red candle ki range se bari hone par dhyan dena chahiye. Iske alawa, small green candles ki range ko closely monitor karna bhi zaroori hai.
      1. Mat Hold Pattern ki Tareef Mat hold pattern ek strong trend ki continuation ko represent karta hai. Is pattern mein small green candles ko "holding pattern" kehte hain, jo ek range mein trade hoti hain. Yeh ek bullish ya bearish trend ke doran emerge hota hai.
      1. Pattern Ki Guftagu Mat hold pattern ko dekh kar traders market mein ek strong trend ki continuation ko expect karte hain. Is pattern ki presence, market direction ke confirm hone par traders ke liye ek opportunity banati hai.
      1. Mat Hold Pattern Ki Formation Mat hold pattern ka formation ek lamba green candle ke saath shuru hota hai jo ek choti red candle ke baad aata hai. Phir iske baad ek series of small green candles aati hai, jo ek holding pattern mein trade hoti hain.
      1. Mat Hold Pattern ki Validity Mat hold pattern ki validity ko confirm karne ke liye, traders ko small green candles ki range ko closely monitor karna chahiye. Agar ye small candles ek specific range mein trade kar rahi hain, toh pattern ki validity ko samjha ja sakta hai.
      1. Trading Strategy: Long Position Agar ek trader long position lena chahta hai, toh wo mat hold pattern ke pehle green candle ke close ke upar enter kar sakta hai. Isse wo trend ke continuation ke possibility par trade kar sakta hai.
      1. Trading Strategy: Short Position Short position ke liye, trader mat hold pattern ke pehle green candle ke low ke neeche enter kar sakta hai. Isse wo trend reversal ki possibility par trade kar sakta hai.
      1. Stop Loss Aur Target Levels Stop loss levels ko define karne ke liye, traders usually mat hold pattern ke opposite side ke low ya high ka use karte hain. Target levels ko set karne ke liye, traders trend ke continuation ke hisaab se decide karte hain.
      1. Risk Management Har trading strategy mein risk management ka bohot ahem kirdar hota hai. Mat hold pattern ko trade karte waqt, stop loss levels ko maintain karna zaroori hai taki losses ko control kiya ja sake.
      1. Price Confirmation Ki Ahmiyat Mat hold pattern ki confirmation ke liye, traders ko price action ko closely observe karna zaroori hai. Isse wo pattern ki validity ko samajh sakte hain aur trading decisions ko better banate hain.
      1. Trading Psychology Trading mein patience aur discipline bohot zaroori hote hain. Mat hold pattern ko trade karte waqt bhi, traders ko apne emotions ko control mein rakhna zaroori hai taki galat decisions na liya jaye.
      1. Pattern Ki Backtesting Har nayi trading strategy ko backtest karna zaroori hai taki uski effectiveness ko samajh sakte hain. Mat hold pattern ko bhi backtest karke, traders uski performance aur reliability ko evaluate kar sakte hain.
      1. Market Conditions Ka Impact Market conditions aur volatility bhi pattern ki performance par asar dal sakti hai. Mat hold pattern ko trade karte waqt, traders ko current market conditions ko bhi consider karna chahiye taki unki trading strategy ko adjust kiya ja sake.
      1. Conclusion Mat hold candlestick pattern ek powerful tool hai jo traders ko market trends ko samajhne aur unke favor mein trading karne mein madad karta hai. Lekin, iska istemal karne se pehle thorough analysis, risk management aur price confirmation zaroori hai. Trading mein success pane ke liye, traders ko patience, discipline aur consistent approach maintain karna chahiye.
      • #4 Collapse


        Mat hold candlestick pattern ek popular technical analysis tool hai jo traders use karte hain market trends ko predict karne ke liye. Yeh pattern typically ek uptrend ya downtrend ke doran develop hota hai aur ek continuation pattern ki tarah kaam karta hai. "Mat hold" ka matlab hota hai ke market ek particular trend mein chal rahi hai aur us trend ko continue karna expected hai.

        Mat hold pattern ko recognize karne ke liye, traders candlestick charts ka istemal karte hain. Yeh pattern typically 5 ya zyada candlesticks se mil kar banta hai. Yahan, mein aapko Mat hold candlestick pattern ko identify aur trade karne ke kuch steps batata hoon:
        1. Identify Uptrend or Downtrend: Sabse pehle, aapko dekhna hai ke market ka trend kis direction mein ja raha hai. Agar market uptrend mein hai, to aap Mat hold pattern ko dhundenge, jo ki uptrend ke continuation ko indicate karta hai. Agar market downtrend mein hai, to aap Mat hold pattern ko downtrend ke continuation ke liye dhundenge.
        2. Search for Mat Hold Pattern: Mat hold pattern typically 5 candlesticks se banta hai. Ismein pehla candlestick uptrend ya downtrend ke sath hota hai aur baki char candlesticks ek particular range mein develop hote hain.
        3. Confirming Candlesticks: Confirmatory candlesticks ki presence ko dhyan mein rakhein. In candlesticks mein kisi bhi tarah ka strong reversal signal nahi hona chahiye. Yeh pattern usually consolidation phase ko represent karta hai jismein market ek range mein trade karta hai.
        4. Entry Point: Jab aap Mat hold pattern ko identify kar lein aur confirmatory candlesticks ko dekh lein, to entry point ka faisla karein. Uptrend ke case mein, aap long position le sakte hain jab market ek confirmatory candlestick ke uptrend ke upper range mein close karta hai. Downtrend ke case mein, short position lein jab market ek confirmatory candlestick ke downtrend ke lower range mein close karta hai.
        5. Stop Loss and Target: Apne trade ke liye ek stop loss aur target set karein. Stop loss ko trend ke against set karein taaki agar trade opposite direction mein chala gaya to nuksan kam ho. Target ko trend ke continuation ke hisab se set karein.

        Yeh thi Mat hold candlestick pattern trading ki basic strategy. Zaroori hai ke aap isse pehle practice karein aur apne risk management ko dhyan mein rakhein. Trading mein safalta ke liye patience aur discipline bhi bahut zaroori hai.


        • #5 Collapse

          Mat Hold Candlestick Pattern Trading Formula - Forex Trade Mein Istemal
          1. Mat Hold Candlestick Pattern Kya Hai?

            Mat Hold ek bullish candlestick pattern hai jo market mein trend continuation ko darust karta hai. Ye pattern typically uptrend mein paya jata hai aur traders ko existing trend ke saath trade karne ki salahiyat deta hai.

            Mat Hold pattern mein ek lambi bullish candle hoti hai jo trend ki shuruaat ko darust karti hai. Iske baad choti choti candles ki series ati hai jo trend ko confirm karti hai. Ye pattern aam tor par 5 candles se zyada hoti hai, lekin iski lambai kisi bhi maamooli chart pattern se mukhtalif ho sakti hai.

            Mat Hold pattern ka naam Japani shumarai technical analysis ke mahir, Steve Nison ne diya hai. Ye unhone apni kitab "Japanese Candlestick Charting Techniques" mein describe kiya tha.

            Mat Hold pattern ka istemal karke traders trend ke mawafiq trades kar sakte hain aur profit kamane ka imkan barhate hain.
          1. Pattern Ki Tashkeel

            Mat Hold pattern ki tashkeel mein do ahem elements shamil hote hain:
            • Pehla, ek lambi bullish candle jo trend ki shuruaat ko darust karti hai.
            • Dusra, lambi candle ke baad choti candles ki series jo trend ko confirm karti hai.

            Ye pattern typically uptrend mein paya jata hai, lekin kabhi kabhi downtrend ke doran bhi dekha ja sakta hai.

            Mat Hold pattern ki tashkeel ko samajhne ke liye traders ko candlestick charts ka istemal karna hota hai. Candlestick charts par har candle ek specific time period ko represent karta hai aur uss time period ke price action ko darust karti hai.
          1. Kyun Maayne Rakhta Hai?

            Mat Hold pattern ka istemal traders ke liye ahem hai kyun ke ye trend continuation ko darust karta hai. Jab ek trend shuru hota hai aur phir ek lambi bullish candle ke baad choti candles ki series ati hai, to ye trend ko confirm karta hai aur traders ko existing trend ke saath trade karne ki salahiyat deta hai.

            Is pattern ka istemal karke traders trend ke mawafiq trades kar sakte hain aur profit kamane ka imkan barhate hain.

            Is pattern ka maayne samajhne ke liye traders ko price action, technical analysis, aur market dynamics ko samajhna zaroori hai. Iske alawa, traders ko trading psychology aur risk management ka bhi khayal rakhna hota hai.
          1. Trading Formula

            Mat Hold pattern ko samajhne ke liye kuch ahem qawaid hain jo traders ko madadgar sabit ho sakte hain:
          1. Pehla Qaaidah: Lambi Bullish Candle

            Mat Hold pattern ka pehla qaida hai ke pattern ki shuruaat ek lambi bullish candle se hoti hai. Ye lambi candle uptrend ki shuruaat ko darust karti hai.

            Lambi candle ki lambai aam tor par chart par dekhi jati hai aur isse trend ki strength ka andaza lagaya jata hai. Agar lambi candle ki body lambi hoti hai aur upper shadow nahi hoti hai, to ye ek strong bullish signal hota hai.

            Lambi candle ki body ke range ko samajhne ke liye traders ko high aur low prices ko dekhna hota hai. High price candle ki upper side aur low price candle ki lower side ko represent karta hai.
          1. Dusra Qaaidah: Chote Candles Ki Series

            Pehli lambi bullish candle ke baad, ek series of choti choti candles ati hai jo trend ko confirm karti hai. Ye choti candles typically pehli lambi candle ki range ke andar hoti hain.

            In choti candles ko dekhte hue traders trend ko samajh sakte hain aur uss ke mawafiq trading decisions le sakte hain. Agar choti candles ki range pehli lambi candle ki body ke andar rehti hai, to ye trend ke continuation ko confirm karta hai.

            Choti candles ki size aur shape bhi important hoti hai. Agar choti candles ke bodies small hain aur shadows zyada hain, to ye indecision ko darust karti hai aur traders ko caution ki zaroorat hoti hai.
          1. Teesra Qaaidah: Support Level

            Mat Hold pattern ki tasdeeq ke liye support level ko dekha jata hai. Agar pattern kisi support level ke paas ban raha hai, to iska matlab hai ke pattern ki validity barh jati hai.

            Support level sey related technical indicators aur price action ko bhi madde nazar rakha jata hai. Support level sey related key price points ko identify karke traders trend ke mawafiq trading decisions le sakte hain.

            Support level ek aham concept hai technical analysis mein jo market mein price reversals ko darust karta hai. Support level ko identify karne ke liye traders price charts par previous price action ko dekhte hain.
          1. Chautha Qaaidah: Volume Ka Tafteesh

            Trading volume ka bhi tafteesh karna ahem hai Mat Hold pattern ko confirm karne ke liye. Agar pattern ke sath high volume dekha jata hai, to iska matlab hai ke pattern ki strength zyada hai aur traders ko zyada confidence hota hai.

            Volume ka istemal karke traders trend ke mawafiq trading decisions lete hain. High volume bullish signals ko confirm karta hai aur low volume ko bearish signals ke sath associate kiya jata hai.

            Volume indicators ka istemal karke traders volume ki analysis karte hain. Volume indicators volume bars ko chart par represent karte hain aur traders ko volume ke patterns ko samajhne mein madad karte hain.
          1. Panchwa Qaaidah: Confirmation Candle

            Mat Hold pattern ki tasdeeq ke liye ek confirmation candle ka intezar karna zaroori hai. Confirmation candle typically choti candles ki series ke baad ati hai aur trend ki continuation ko darust karti hai.

            Is confirmation candle ke close ke baad entry point tay kiya jata hai. Agar confirmation candle bullish hai aur uski close lambi bullish candle ki upper side par hoti hai, to ye trend ke continuation ko confirm karta hai.

            Confirmation candle ko identify karne ke liye traders price action aur candlestick patterns ko dekhte hain. Confirmation candle bullish ya bearish signals ko darust karti hai.
          1. Chhatha Qaaidah: Entry Point

            Confirmation candle ke close ke baad entry point tay karna zaroori hai. Traders ko entry point tay karte waqt price action, support aur resistance levels, aur technical indicators ka istemal karna chahiye.

            Entry point ko tay karte waqt stop loss aur target levels bhi tay kiye jate hain. Entry point ko identify karne ke liye traders price action ko analyze karte hain aur trading signals ko confirm karte hain.

            Entry point tay karte waqt traders ko risk aur reward ka bhi khayal rakhna hota hai. Risk reward ratio ka istemal karke traders apne trades ke liye suitable entry points tay karte hain.
          1. Saathwa Qaaidah: Stop Loss Aur Target

            Har trade mein stop loss aur target levels ko tay karna zaroori hai. Stop loss levels traders ki capital ko protect karte hain aur target levels profit ki had tak rakhte hain.

            Stop loss aur target levels ko tay karte waqt traders risk reward ratio ka bhi khayal rakhte hain. Agar stop loss levels ko breach kiya jata hai, to traders apne trades ko exit karte hain aur apni capital ko protect karte hain.

            Stop loss aur target levels ko tay karte waqt traders price action aur market conditions ko dekhte hain. Iske alawa, technical indicators aur support resistance levels ka bhi istemal hota hai.
          1. Aathwa Qaaidah: Risk Management

            Har trade mein risk management ko yaad rakha jata hai. Traders ko apni capital ko protect karne ke liye stop loss aur target levels ka tay kiya jata hai.

            Risk management ke tafteesh mein traders apni trading capital ka sirf chand percentage ko har trade mein risk karte hain. Is tarah ke risk management approach se traders apni capital ko protect karte hain aur long term mein consistent profits kamate hain.

            Risk management ko samajhne ke liye traders ko apni risk tolerance aur trading goals ko samajhna hota hai. Iske alawa, traders ko apne trading strategy ke mutabiq suitable risk management approach tay karna hota hai.
          1. Nauwa Qaaidah: Emotional Control

            Emotional stability trading mein ahem hai. Traders ko hamesha apne trading plan ke mutabiq trade karna chahiye aur emotions ko control mein rakhein.

            Losses aur profits ke sath samjhauta karke traders apne trading journey ko aage le jate hain. Iske alawa, traders ko apne trading decisions par confidence rakhna hota hai aur trading mein disciplined rehna hota hai.

            Emotional control ko maintain karne ke liye traders ko apne trading plan ko follow karna hota hai. Iske alawa, traders apne trades ko analyze karte waqt objective rehna hota hai aur overtrading se bachna hota hai.
          1. Duswa Qaaidah: Constant Learning

            Forex trading ek dynamic field hai, isliye traders ko hamesha naye concepts aur strategies seekhne ki zaroorat hoti hai.

            Traders online resources, books, aur courses ka istemal karke apne knowledge ko barhate hain. Iske alawa, traders ko apne trading journey mein consistent learning aur improvement ke liye open mindset rakhna hota hai.

            Constant learning ke tafteesh mein traders apne trading skills ko improve karte hain aur market trends ko samajhte hain. Is tarah ke learning approach se traders apne trading performance ko enhance karte hain aur consistent profits kamate hain.
          1. Gyarahwa Qaaidah: Practice

            Practice trading mein maharat hasil karne ka ek ahem hissa hai. Traders ko apne trading skills ko improve karne ke liye regular practice karna chahiye.

            Demo accounts ka istemal karke new strategies aur techniques ko test karna bhi zaroori hai. Iske alawa, traders ko apne trades ko analyze karke apni performance ko evaluate karna chahiye aur improvement ke liye feedback lete rehna chahiye.

            Practice ke tafteesh mein traders apne trading strategies ko refine karte hain aur market conditions ko samajhte hain. Is tarah ke practice approach se traders apne trading journey mein success hasil karte hain aur consistent profits kamate hain.

          Mat Hold candlestick pattern ka istemal karke, forex traders apni trades ko improve sakte hain aur consistent profits kamana seekh sakte hain. Lekin, har trade ki taraf se risk ko samjha jaana zaroori hai.
          • #6 Collapse

            Mat hold candlestick pattern trading formulau

            Title: "Mat Candlestick Pattern: Trading Formula aur Uski Tafseelat"

            Candlestick patterns market analysis mein aik ahem hissa hain jo traders ko market ki movement samajhne mein madad deta hai. In patterns ki pehchan kar ke, traders market trends ko predict karte hain aur trading decisions lete hain. Aaj hum Mat candlestick pattern ke baare mein baat karenge, jo ek popular aur powerful trading pattern hai.

            Mat candlestick pattern, do candlesticks se mil kar banta hai. Yeh bearish reversal pattern hai, jo market ki uptrend ko indicate karta hai. Is pattern ko sahi taur par samajh kar, traders market mein upcoming bearish reversal ko pehchan sakte hain.

            Yeh pattern kis tarah se banta hai? Mat pattern ki pehli candle bullish hoti hai, yaani ke uptrend mein hoti hai. Doosri candle, pehli candle ki body ke andar reh kar khatam hoti hai aur us se neeche close hoti hai. Yeh do candles jab milte hain, to ek inverted "T" ya Mat jaise shape bana lete hain.

            Mat pattern ki trading formula ko samajhne ke liye, yeh kuch steps hain jo traders ko madad karte hain:
            1. Pehli Candle Ki Uptrend Ki Tafseelat: Pehle candle ki body ko dekhein aur dekhein ke woh uptrend mein hai ya nahi. Agar pehli candle ki closing price pehle candle ki opening price se ziada hai, to yeh uptrend ko indicate karta hai.
            2. Doosri Candle Ki Analysis: Doosri candle ko dekhein. Yeh candle pehli candle ki body ke andar shuru hoti hai aur us ki closing price us ke neeche hoti hai. Is se samajh aata hai ke buyers initially strong thay lekin phir sellers ne control le liya.
            3. Volume Ki Tafseelat: Volume bhi ek important factor hai Mat pattern ki tafseelat mein. Agar doosri candle ki volume pehli candle se ziada hai, to yeh bearish reversal ke liye aur bhi mazboot indication hai.
            4. Confirmation Ki Talaash: Mat pattern ko confirm karne ke liye, traders ko doosri candle ke close ke neeche ek stop loss lagana chahiye. Agar agli candle doosri candle ke neeche close hoti hai, to yeh bearish reversal ko confirm karta hai.

            Mat candlestick pattern trading mein ek powerful tool hai, lekin is ka istemal karne se pehle, traders ko apni analysis aur risk management ko madde nazar rakhna chahiye. Is pattern ko samajhne ke liye, traders ko practice aur experience ki zarurat hoti hai. Isi tarah se, Mat pattern ke saath trading kar ke, traders apni trading strategy ko aur bhi mazboot bana sakte hain.
            • <a href="https://www.instaforex.org/ru/?x=ruforum">InstaForex</a>
            • #7 Collapse

              ### Mat Hold Candlestick Pattern Trading Formula
              Forex trading mein technical analysis tools aur candlestick patterns market ki movements aur potential trend reversals ko identify karne mein madadgar hote hain. **Mat Hold Candlestick Pattern** un patterns mein se ek hai jo bullish trend continuation aur consolidation phases ko dikhata hai. Yeh pattern market ke strong uptrend ke baad bullish momentum ko confirm karta hai. Yahan Mat Hold Candlestick Pattern aur trading formula ka overview diya gaya hai:

              **Mat Hold Pattern Kya Hai?**

              Mat Hold Pattern ek bullish continuation pattern hai jo market ke strong uptrend ke baad develop hota hai. Is pattern ka naam “Mat Hold” isliye pada kyunke ismein price ek consolidation phase ke dauran ek range-bound movement show karti hai, jaise ke price ek “mat” par hold hoti hai, aur phir se upward trend ko continue karti hai. Is pattern mein typically paanch candlesticks hoti hain:

              1. **First Candle**: Ek long bullish candle jo strong uptrend ko dikhati hai. Yeh candle market ke strong buying pressure ko represent karti hai.

              2. **Second Candle**: Ek small-bodied candle jo first candle ke close ke baad develop hoti hai. Yeh candle consolidation ya hesitation ko indicate karti hai aur market ke indecision ko reflect karti hai.

              3. **Third Candle**: Ek bearish candle jo second candle ke body ko completely engulf karti hai. Yeh candle short-term pullback ya profit-taking ko dikhati hai, lekin yeh long-term bullish trend ko affect nahi karti.

              4. **Fourth Candle**: Ek small-bodied candle jo third candle ke baad aati hai. Yeh candle price consolidation aur market ke indecision ko continue karti hai.

              5. **Fifth Candle**: Ek long bullish candle jo previous candles ko engulf karti hai aur pattern ke bullish continuation ko confirm karti hai.

              **Trading Formula Aur Strategy:**

              1. **Entry Point**: Mat Hold Pattern ka entry point tab hota hai jab fifth candle ke bullish breakout ko observe kiya jata hai. Jab price fifth candle ke high ko break karti hai, aap buy position open kar sakte hain, jo pattern ke bullish signal ko confirm karta hai.

              2. **Stop Loss**: Stop loss ko third candle ke low ke thoda niche set karna chahiye. Yeh aapko unexpected market movements se protect karta hai aur risk management mein madad karta hai.

              3. **Take Profit**: Take profit target ko recent resistance levels ya pattern ke potential price targets ke aas paas set karna chahiye. Yeh aapko profit-taking opportunities aur trade exit points ko determine karne mein madad karta hai.

              **Risk Management Aur Confirmation:**

              Mat Hold Pattern ko use karte waqt, risk management ko zaroor consider karein. Market conditions aur price action ko closely monitor karna zaroori hai. Is pattern ko dusre technical indicators, jaise Moving Averages ya RSI, ke sath combine karke use karna, stronger trading signals aur confirmation provide kar sakta hai.

              **Conclusion:**

              Mat Hold Candlestick Pattern forex trading mein ek valuable tool hai jo bullish continuation aur consolidation phases ko identify karne mein madad karta hai. Is pattern ko accurately pehchaan kar aur sahi trading formula ke sath istemal karke, aap apni trading decisions ko enhance kar sakte hain aur market ke bullish movements ko capitalize kar sakte hain.

              اب آن لائن

              Working...
              X