Island Reversal Candlestick Patterns.
X
  • وقت
  • دکھائیں
Clear All
new posts
  • #1 Collapse

    Island Reversal Candlestick Patterns.
    Island Reversal Candlestick Pattern Introduction.

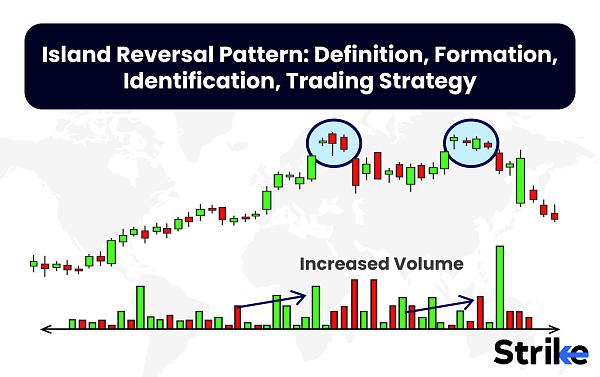
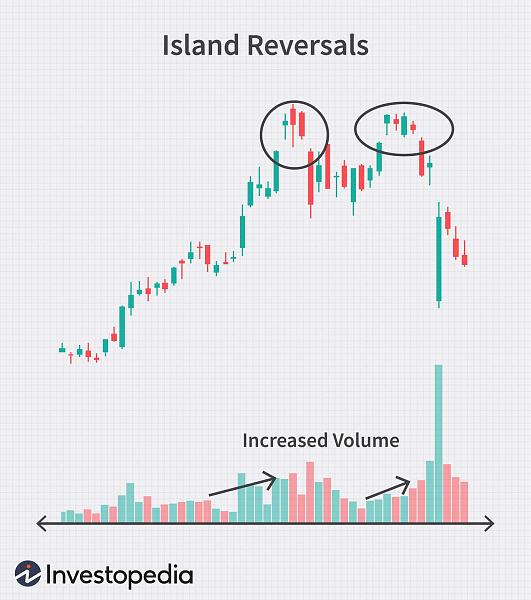
    Island reversal candlestick pattern ek aham technical analysis tool hai jo traders ko market ke trend changes ka andaza dene mein madad karta hai. Island reversal pattern mein, ek chhota sa 'island' of price action nazar aata hai jo ki surrounding candles se isolated hota hai. Ye 'island' typically ek uptrend ya downtrend ke darmiyan aata hai aur uski formation ka matlab hota hai ke trend change hone ka imkan hai.

    Pattern Ki Pehchan.

    Island reversal pattern ko pehchanna mushkil nahi hota. Ye typically ek chhota sa cluster hota hai jo market mein alag dikhayi deta hai. Agar trend reversal hone ke chances hote hain, to is cluster ke baad price action mein clear change hota hai.

    Click image for larger version

Name:	Island-Reversal-Pattern-Definition-Formation-Identification-Trading-Strategy.jpg
Views:	75
Size:	222.2 کلوبائٹ
ID:	12899904

    Bullish Island Reversal Pattern.
    Agar bullish island reversal pattern dekha jaye, to ye indicate karta hai ke bearish trend khatam hone ke bad ek bullish trend ka shuru ho sakta hai. Ye pattern typically ek downtrend ke baad dekha jata hai, jab ek chhota sa 'island' of bullish price action surrounding candles se isolated hota hai.

    Bearish Island Reversal Pattern.

    Bearish island reversal pattern mein, ek chhota sa 'island' of bearish price action surrounding candles se isolated hota hai, jo ki bullish trend ke darmiyan nazar aata hai. Ye pattern bullish trend ke khatam hone ke baad dekha jata hai aur indicate karta hai ke bearish trend shuru hone ke chances hain.

    Trading Strategies with Island Reversal Pattern.

    Island reversal pattern ke saath trading karte waqt, traders ko kuch strategies follow karni chahiye. Ye include karte hain:
    Island reversal pattern ko confirm karne ke liye, traders ko typically next few candles ka wait karna chahiye, jisse ke pattern ki validity ko confirm kiya ja sake.Jab ek trader ek island reversal pattern identify karta hai, to wo stop loss ka istemal karta hai taake in case agar reversal hone ki jagah trend phir se usi direction mein chalne lagta hai, to nuksan se bacha ja sake.Island reversal pattern ki pehchan karne ke baad, traders ko target set karna chahiye ke wo kis direction mein trade kar rahe hain, aur unki exit strategy kya hogi agar trend reversal ho jaye.

    Click image for larger version

Name:	dotdash_Final_Island_Reversal_Aug_2020-02-018c391240e54aa58a31a246122f20cd.jpg
Views:	30
Size:	323.6 کلوبائٹ
ID:	12899905

    Additional information.

    Island reversal candlestick pattern ek mufeed tool hai jo traders ko trend changes ka andaza dene mein madad karta hai. Iski sahi pehchan aur samajh traders ko market mein successful trading karne mein madad karti hai. Lekin, ye pattern sirf ek indicator hai aur traders ko dusre technical analysis tools ke saath combine karke istemal karna chahiye, taki unka trading decision sahi ho sake.
  • <a href="https://www.instaforex.org/ru/?x=ruforum">InstaForex</a>
  • #2 Collapse

    Island Reversal Candlestick Patterns.
    Click image for larger version

Name:	island.png
Views:	39
Size:	5.4 کلوبائٹ
ID:	12900002​​​​​​​
    1. تعارف: Jazirah Mud pattern aik candlestick pattern hai jo aam tor par forex, stocks, aur commodities jese maliyat ke bazar mein dekha jata hai. Chalein is pattern ki tafseelat mein ghutne chalte hain:

    2. پیدائش: Jazirah Mud candlestick pattern aam tor par aik hee candlestick se bana hota hai. Is ki pehchan is se hoti hai ke candlestick ka jism aksar candlestick range ke oopar ya neeche hota hai, sath hee sath aik lambi lower shadow hoti hai jo neeche ki taraf phailti hai. Tasveeran mein, ye aik jazirah ki shakal ka hota hai, jism ka hissa jazirah ki saanp (blade) ko aur shadow saanp ka handle ko dikhata hai.

    3. Tawil: Bullish Jazirah Mud (Hammer): Jab Jazirah Mud pattern downtrend ke ikhtitam mein nazar aata hai, to ye bullish reversal signal samjha jata hai. Lambi lower shadow ka matlab hai ke bechne walay ne qeemat ko qayadat ke teht lay gaya tha, lekin kharidne walay ne qeemat ko band hone tak buland kiya, jis se bullish momentum ka izhar hota hai. Bearish Jazirah Mud (Hanging Man): Mukhalif tor par, jab Jazirah Mud pattern uptrend ke oopar nazar aata hai, to ye bearish reversal signal samjha jata hai. Lambi lower shadow ka matlab hai ke kharidne walay ne qeemat ko pehle buland kiya tha, lekin band hone tak bechne walay ne qeemat ko wapas apne qabze mein le liya, jis se bearish dabao ka izhar hota hai.

    4. اہم خصوصیات: Chhoti Jism: Jazirah Mud candlestick ke jism ka tasawurati tor par baray hissay ke sath mawafiq hota hai muqably mein, jis se shahriyat ya beechne walay aur bikne walay ke darmiyan jam hui ya jarehana jam hui shakhsiat ka zikar hota hai. Lambi Lower Shadow: Lambi lower shadow ka mojoodgi lambi hadood ki nishani hoti hai. Ye dikhata hai ke qeemat ko neeche laya gaya tha lekin isay session ke ikhtitam tak wapas bandh gaya, jo mojooda trend ya izafa ka izhar karta hai. Bghair Upper Shadow (Optional): Hamesha mojooda nahi hoti, lekin kuch Jazirah Mud patterns ko upper shadow ka mojood na honay par bhi tor par tor par tasdeeq di jati hai, jo bechnay walay (bullish) ya bikne walay (bearish) ke dabao ka izhar karta hai.

    5. Tasdeeq aur Tijarat ke Strategies: Hamesha ke liye tasdeeq: Tijarat karne walay aksar tasdeeq ke intezaar mein rahte hain pehle se tasdeeq hone par tijarat shuru karne se pehle. Tasdeeq agle bullish qeemat ke action ya Jazirah Mud pattern ke ikhtitam ka asar ho sakta hai. Dakhilati Nukta: Tijarat karne walay Jazirah Mud pattern ke dakhilati nukta par mukhtalif raqam tijarat mein shamil kar sakte hain ya bullish candlestick ke uncha darja par qadruon ke tootne ka intezaar kar sakte hain. Stop Loss Placement: Stop loss order aam tor par Jazirah Mud pattern ke neeche ki darjon ko mehfooz karne ke liye rakha jata hai taake kisi nuqsaan ka ehtimaam na ho. Manzilat ki Daraazain: Faida manzilat par mabni hosakti hain ya jari aur technical analysis ke tools jese ke Fibonacci retracements ya extensions ke istemal se set kiya ja sakta hai.

    6. Khatarnaak Anagement: Munasib khatarnaak nizam, Jazirah Mud pattern par tijarat karne mein ahem hota hai. Tijarat ke doran stop loss orders ka istemal nuqsaan ki hudood ko had se zyada karna aur raqam ke darmiyan hifazat karna madadgar hoti hai.

    7. Khatam: Jazirah Mud pattern ek bullish reversal sinyal hai jo tijarat karne walon ko downtrend ke ikhtitam par tijarat ke liye potential moka deta hai. Is pattern ke wujood aur khaasiyat ke samajhne se, tijarat karne walay apne tijarat ke iraday ko forex market mein zyada behtar faisle lene ke liye shamil kar sakte hain. Magar, mumkin hai ke mumeel karne wale kandelsti patternon par tijarat karte waqt ehtiyaat aur sahi khatarnaak tariqe ka istemal kiya jaye.
    • #3 Collapse

      Island Reversal Candlestick Patterns: Market Kay Sath Intikhabat

      Market mein kai tarah ki patterns hoti hain jo traders ke liye ahem hote hain, unmein se ek hai "Island Reversal Candlestick Pattern". Yeh pattern aksar trading charts par nazar aata hai aur traders ke liye ek ahem signal hai. Is article mein hum is pattern ke bare mein mazeed maloomat hasil karenge aur samjhayenge ke iska istemal kaise kiya ja sakta hai.

      Kya Hai Island Reversal Candlestick Pattern?

      Island Reversal Candlestick Pattern ek technical analysis tool hai jo market trends ko predict karne ke liye istemal kiya jata hai. Is pattern mein, ek chhota sa "island" jaise structure ban jata hai jahan price action kuch dino ke liye isolated ho jata hai, phir ek sudden reversal hota hai jo trend ko change karta hai.

      Island Reversal Ke Types

      Island Reversal ke do mukhya types hote hain:
      1. Bullish Island Reversal: Jab ek downtrend ke baad ek bearish candle ke baad do ya zyada bullish candles aati hain jo ek gap ke sath shuru hoti hain, phir ek bearish candle aati hai jo pehle bullish candles se isolated hoti hai, aur phir ek aur bullish candle aata hai jo gap ke sath shuru hota hai, yeh ek bullish island reversal pattern ko darust karta hai.
      2. Bearish Island Reversal: Jab ek uptrend ke baad ek bullish candle ke baad do ya zyada bearish candles aati hain jo ek gap ke sath shuru hoti hain, phir ek bullish candle aati hai jo pehle bearish candles se isolated hoti hai, aur phir ek aur bearish candle aata hai jo gap ke sath shuru hota hai, yeh ek bearish island reversal pattern ko darust karta hai.

      Island Reversal Pattern Ki Tashkeel

      Island reversal pattern ko dekhne ke liye, traders ko price action aur volume par tawajju deni hoti hai. Agar ek isolated group of candles ek gap ke sath shuru hota hai aur phir ek aur gap ke sath khatam hota hai, to yeh ek island reversal pattern ko indicate karta hai.

      Kaise Istemal Kiya Jaye

      Island reversal patterns ko samajhna aur istemal karna traders ke liye zaroori hai. Yeh pattern trend reversals ko indicate karta hai, jisse traders ko trading decisions mein madad milti hai.

      Entry Points: Agar ek trader ko ek bullish island reversal pattern notice hota hai, to woh long position enter kar sakta hai jab price gap ke upar se crossover karta hai. Upar se crossover hone par, woh ek bullish trend ki shuruaat ka sign samajh sakta hai.

      Stop Loss: Har trading strategy mein stop loss ka hona zaroori hota hai. Agar ek trader long position enter karta hai, to woh apni stop loss order ko gap ke neeche rakh sakta hai, taki agar price phir se reversal karta hai to woh nuqsaan se bach sake.

      Take Profit: Ek trader apni take profit level ko bhi set kar sakta hai jahan woh apne trades ko band karna chahta hai. Yeh level pehle resistance zone ke qareeb ho sakta hai.

      Island Reversal Patterns Ki Tafseelat

      Island reversal patterns ka istemal karte waqt, traders ko price action aur volume ke saath-saath doosre technical indicators ka bhi tawajju dena zaroori hai. Yeh ek comprehensive approach provide karta hai jo trading decisions ko mazeed mazboot bana sakta hai.

      Conclusion

      Island reversal candlestick patterns market mein trend reversals ko anticipate karne ke liye ahem tools hote hain. In patterns ko samajh kar, traders apni trading strategies ko mazeed behtar bana sakte hain aur market ke mukhtalif scenarios ko samajhne mein madad le sakte hain. Magar yaad rahe ke har pattern ki tarah, yeh bhi kisi bhi trading decision ke liye ek single indicator nahi hai. Is liye, traders ko doosre technical analysis tools aur risk management techniques ka bhi istemal karna chahiye.
      • #4 Collapse

        Introduction to Island Reversal Candlestick Pattern

        Dear Friends and Forex Fellows Island Reversal Candlestick Pattern Aikaham technical analysis tool hy jo traders ko market trends aur potential reversals ka pata lagane me madad karta hy. Ye pattern market me potential trend reversal ko indicate karta hy, specifically jab uptrend ya downtrend ke baad aata hy. Island Reversal pattern me market me Aikgap create hota hy, jabke gap ke dono sides pe alag-alag trends observed hoty hein. Is gap ke beech ki price action create karta hy Aik"island" jise traders closely monitor karty hein kyunki is island ke appearance ke baad market me reversal hone ka chance hota hy. Island Reversal Candlestick Pattern ka formation market me Aikgap create hota hy, jisme price Aikdin se doosre din jump karta hy, creating a gap between the two price levels. Yeh gap ke sides pe opposite trends observed hoty hein, jaise ke Aiktaraf uptrend aur doosri taraf downtrend. Island Reversal pattern ko confirm karne ke liye, Aikdoosre gap create hota hy opposite direction me, jise traders "breakaway gap" kehte hein. Is breakaway gap ke baad, market me reversal hone ka indication hota hy aur traders ko alert karta hy ke trend change hone ke chances hein.


        Click image for larger version

Name:	1.png
Views:	36
Size:	5.4 کلوبائٹ
ID:	12900038
        Clarification of Island Reversal Candlesticks pattern


        Dear Friends marketplace Me Jab Ham kam kar rahy hoty hein to isme island reversal me five candles rujhan ki tabdeeli ka ishara deti hein, kyunkay ghalib qowat ne raftaar khona shuru kar di hy, is terhan doosri qowat ko faida uthany ki ijazat millti hy. Dosray lafzon me, taizi aur mandi walay jazeeray ke namoonay ufaq par tabdeeli ke qabil aetmaad isharay hein. Lekin yahan tak ke agar aap candle caught charts ko talaash karne aur un ka tajzia karne me bohat achay hein, tab bhi aap ko chart par jazeeray kiforexmarket Me Jab Ham kam kar rahy hoty hein to usme police Island trendpattern Aiktrain reversal sample hy jo ke market ke low chargevicinity ya undergo stand ke terrible banta hy yah pattern Dekhne Me bullish Abid night time timechild candlesticks sample Jaisa Hy butdistinction Yeh hy ki Island reversal bullish candles Jyada cand tabdeeli nahi mil sakti hy. Hein jo ki sari candles beary strand se hole me open aur close Hoti Hy yah sample bullish bedroom it toddler candles take pattern Ki Tarah formation Me Hota Hy however vah teenager candles in step with muft Mel hota hy jabki is Me five candles hoti hein pattern ka aagaaj bearing stand ke awful Aikblack candle se hota hy jo ki pahle trend se downward facetin line withgap me open Hoti Hy Jiske lousy sem hollow Me 2d0.33 forth aur 5th bhi banti hy yah sari Candles hoti to realframe me hy howeversize Inka small hota hy pattern ki fifthstandard Aikactualbody wali white candles hoti hy jo ki train ke reversal hone ke terrible banti hy pattern ki secondthird aur forth candles Kisi bhi coloration ki ho sakti hy but jyadatar yah white black white pattern Me Hoti Hy sample ke lousy Bole stand ki first white candles hole Me upward facet se open hoti hy

        Click image for larger version

Name:	2.png
Views:	24
Size:	8.8 کلوبائٹ
ID:	12900039
        Trading with Island Reversal Candlestick Pattern


        Entry Point.
        Island Reversal Pattern Adam faisla aur Bulls aur bears ke darmiyan larai ko zahir karta hy. is ki khasusiyat aksar aik long Doji candle se hoti hy jis ka hajam barhay hue rujhan ke baad hota hy. yeh farq ke baad hy aur mukhalif simt me muntaqil hota hy ke tijarat ki jati hy. bearish pattern ke liye, gape ke baad mukhtasir darj karen aur mukhalif simt me jayen. taizi ke pattern ke liye, waqfay ke taweel arsay baad daakhil hon aur mukhalif simt me jayen .

        Exit Point.
        Exit se morad hadaf aur stop loss dono hein. is pattern ke sath, aap price me is zor ko pakarna chahtay hein jo is pattern ki pairwi karta hy, lekin aik baar jab yeh zor kamzor hona shuru hojaye, to yeh waqt niklny ka hy. agar price space ko pur karny ke liye wapas chali jati hy, to reversal pattern baatil ho jata hy, aur aap ko foran bahar nikal jana chahiye. lehaza, aik stop loss space me ya" Island" candle ke qareeb rakha ja sakta hy .

        • #5 Collapse

          Island Reversal Candlestick Pattern

          Click image for larger version

Name:	images (3).png
Views:	21
Size:	7.7 کلوبائٹ
ID:	12900048

          Island Reversal Candlestick Patterns ko samajhna mukhtalif traders ke liye zaroori hai jo technical analysis ka istemal karte hain. Ye ek makhsoos tarah ki candlestick pattern hai jo market ki mukhtalif situations ko darust karne mein madad deta hai.

          Island Reversal Candlestick Patterns aam tor par uptrend ya downtrend ke darmiyan paida hota hai. Ye pattern do alag-alag tarah ke candles se shuru hota hai, jismein pehle ek series of candles ek trend ko indicate karte hain, phir ek gap aata hai aur phir doosri series of candles hoti hai jo pehli trend ke khilaaf move karti hai.

          Island Reversal Pattern ko samajhne ke liye, traders ko pehle market trend ko identify karna hota hai, yaani ke uptrend ya downtrend. Phir wo dekhte hain ke kya ek gap hai jo ek naye price level par shuru hota hai. Agar gap ek uptrend ke baad aata hai, to ye bullish island reversal pattern kehlata hai. Agar gap ek downtrend ke baad aata hai, to ye bearish island reversal pattern kehlata hai.

          Bullish island reversal pattern mein, pehli series of candles ek uptrend ko darust karti hai, phir ek gap aata hai, aur phir doosri series of candles hoti hai jo price ko neeche le jaati hai. Ye bullish trend ko downtrend mein badal deta hai aur traders ko bullish reversal ki sambhavna batata hai.

          Bearish island reversal pattern mein, pehli series of candles ek downtrend ko darust karti hai, phir ek gap aata hai, aur phir doosri series of candles hoti hai jo price ko oopar le jaati hai. Ye bearish trend ko uptrend mein badal deta hai aur traders ko bearish reversal ki sambhavna batata hai.

          Island Reversal Candlestick Patterns ka istemal karke traders market ke mukhtalif mawad ko samajh sakte hain aur sahi trading decisions le sakte hain.
          • #6 Collapse

            Island Reversal Candlestick Patterns.?


            Click image for larger version

Name:	download (41).jpeg
Views:	22
Size:	10.0 کلوبائٹ
ID:	12900110


            **Island Reversal Candlestick Patterns ka Tazur**
            **1. Introduction:**
            Island Reversal Candlestick Pattern ek powerful reversal signal hai jo market trend ka direction badalne ka indication deta hai. Is pattern mein ek group of candlesticks ek alag sahara (island) create karte hain jo market trend mein achanak tabdeeli ko darust karta hai.

            **2. Formation:**
            Island Reversal Pattern jab dekha jata hai, toh market mein ek gap create hota hai jahan ek set of candlesticks ek sahara banate hain. Yeh gap bullish ya bearish trend ke against hota hai aur ek clear separation create karta hai between the island aur preceding trend.

            **3. Bullish Island Reversal:**
            Bullish Island Reversal pattern mein, ek downward trend ke baad ek gap down ke baad ek group of bullish candlesticks create hota hai. Yeh indicate karta hai ke previous bearish trend khatam ho sakta hai aur bullish trend shuru ho sakta hai.

            **4. Bearish Island Reversal:**
            Bearish Island Reversal pattern mein, ek upward trend ke baad ek gap up ke baad ek group of bearish candlesticks create hota hai. Yeh indicate karta hai ke previous bullish trend khatam ho sakta hai aur bearish trend shuru ho sakta hai.

            **5. Volume ka Tafsili Mutala:**
            Island Reversal Pattern ko confirm karne ke liye, volume ka tafsili mutala zaroori hai. Agar gap ke sath high volume bhi hota hai, toh yeh pattern ko confirm karta hai.

            **6. Confirmation Aur Risk Management:**
            Island Reversal Pattern ko confirm karne ke liye, traders doosri technical indicators aur price action ke saath combine kar sakte hain. Iske saath hi, proper risk management bhi zaroori hai taake false signals se bacha ja sake.

            **7. Real-Time Monitoring:**
            Island Reversal Pattern ko dekhne ke baad, real-time monitoring karna zaroori hai taake market ki movements ko track kiya ja sake aur trade ko manage kiya ja sake.

            **Ikhtitami Alfaz:**
            Island Reversal Candlestick Pattern ek important reversal signal hai jo traders ko market trend ke direction change hone ka indication deta hai. Isko samajhne aur sahi tareeqe se istemal karne se trading decision mein madad milti hai.
            • #7 Collapse

              Island Reversal Candlestick Patterns


              Click image for larger version

Name:	IS1.png
Views:	25
Size:	12.4 کلوبائٹ
ID:	12900138
              Island Reversal Candlestick Patterns ko samajhna trading mein ahem hai. Yeh ek technical analysis tool hai jo traders istemal karte hain market trends aur reversals ko identify karne ke liye. Island reversal pattern ek powerful reversal signal hai jo price action mein ek shift indicate karta hai.

              Island reversal pattern ek aisa candlestick pattern hai jismein price action ek choti si "island" banata hai jo ek sudden gap ke baad shuru hota hai aur phir ek aur gap ke baad khatam hota hai. Island reversal pattern ka matlab hota hai ke market mein trend ka abrupt change hone wala hai.

              Yeh pattern do prakar ke hota hai:
              1. Bullish Island Reversal: Jab ek downtrend ke baad price action ek gap down ke sath shuru hota hai, phir ek kuch samay tak sideways move karta hai aur phir ek gap up ke sath trend ko continue karta hai, tab yeh bullish island reversal pattern form hota hai. Yeh indicate karta hai ke downtrend khatam ho raha hai aur bullish trend shuru hone wala hai.
              2. Bearish Island Reversal: Jab ek uptrend ke baad price action ek gap up ke sath shuru hota hai, phir ek kuch samay tak sideways move karta hai aur phir ek gap down ke sath trend ko continue karta hai, tab yeh bearish island reversal pattern form hota hai. Yeh indicate karta hai ke uptrend khatam ho raha hai aur bearish trend shuru hone wala hai.

              Traders island reversal patterns ko dekh kar market direction ke potential changes ko anticipate kar sakte hain. Yeh patterns ko confirm karne ke liye additional technical indicators ka bhi istemal kiya jata hai. Island reversal patterns ki samajh aur istemal karne se traders ko trading decisions mein madad milti hai aur unhe profitable trading opportunities mil sakti hain. Lekin, jaise har technical indicator ki tarah, yeh bhi kabhi kabhi false signals generate kar sakta hai, isliye traders ko cautious rehna chahiye aur proper risk management ka istemal karna chahiye.
              • #8 Collapse

                Introduction to Candlestick Patterns

                Candlestick patterns serve as the foundation of technical analysis in forex trading, offering traders valuable insights into market dynamics and price action. Originating from Japan in the 17th century, candlestick charts gained popularity among Western traders in the late 20th century due to their visual clarity and ability to convey complex market information in a simple format.

                The basic structure of a candlestick consists of two main components: the body and the wicks (or shadows). The body represents the price range between the opening and closing prices for a specific time period, with a filled (or solid) body indicating a bearish trend and a hollow (or empty) body representing a bullish trend. The wicks extend from the body and illustrate the high and low prices reached during the trading period.

                Candlestick patterns are formed by the arrangement of one or more candlesticks on a price chart, with each pattern carrying its own interpretation and implications for future price movements. Traders use these patterns to identify potential trend reversals, trend continuations, and market sentiment shifts, allowing them to make more informed trading decisions.

                Understanding Reversal Patterns

                Reversal patterns play a crucial role in technical analysis, signaling potential changes in market direction and offering traders opportunities to profit from trend reversals. These patterns occur when the prevailing trend exhausts its momentum and gives way to a new trend, either in the opposite direction (reversal) or in the same direction (continuation).

                In forex trading, reversal patterns are particularly valuable for identifying turning points in currency pairs and anticipating potential shifts in market sentiment. By recognizing the signs of a trend reversal early, traders can enter positions at favorable prices and ride the new trend for maximum profit potential.

                Some of the most common reversal patterns in forex trading include:
                1. Head and Shoulders: This pattern consists of three peaks, with the middle peak (head) higher than the other two (shoulders). A neckline connects the lows of the two troughs formed between the peaks. A break below the neckline signals a potential trend reversal from bullish to bearish.
                2. Double Top and Double Bottom: Double top patterns occur when prices form two consecutive peaks at approximately the same level, followed by a decline. Conversely, double bottom patterns occur when prices form two consecutive troughs at approximately the same level, followed by an advance. A breakout from the pattern's neckline confirms the reversal.
                3. Triple Top and Triple Bottom: Similar to double top and double bottom patterns, triple top and triple bottom patterns consist of three peaks or troughs, respectively. These patterns are considered stronger reversal signals than their double counterparts, as they indicate greater resistance or support levels.
                4. Reversal Candlestick Patterns: Candlestick patterns such as engulfing patterns, hammers, and shooting stars also serve as reversal signals when they occur at key support or resistance levels. These patterns provide valuable insights into market sentiment and potential trend reversals.

                By understanding the characteristics and implications of reversal patterns, traders can improve their ability to identify and capitalize on trend reversals in the forex market.

                What is an Island Reversal Pattern?

                An island reversal pattern is a unique candlestick pattern characterized by a gap between two consecutive price bars, isolating a group of candlesticks from the surrounding price action. This pattern signals a potential reversal in market sentiment, with the isolated price action serving as a distinct island on the price chart.

                The formation of an island reversal pattern typically occurs in three stages:
                1. Initial Trend: The market is in a prevailing trend, either bullish or bearish, characterized by consecutive candlesticks moving in the same direction.
                2. Isolation: A gap forms between the last candlestick of the current trend and the first candlestick of the potential reversal, creating an "island" of price action separated from the rest of the chart.
                3. Confirmation: The isolated price action is followed by a series of candlesticks moving in the opposite direction of the previous trend, confirming the reversal.

                Island reversal patterns can occur in both bullish and bearish market environments, signaling potential changes from uptrends to downtrends or vice versa. Traders use these patterns to anticipate trend reversals and adjust their trading strategies accordingly.

                Characteristics of Island Reversal Patterns

                Island reversal patterns exhibit several key characteristics that distinguish them from other candlestick formations. These characteristics help traders identify and interpret island reversal patterns with greater accuracy and confidence.
                1. Gap: The presence of a gap is a defining feature of an island reversal pattern. This gap separates the island from the surrounding price action and signifies a sudden shift in market sentiment.
                2. Isolation: The island formed by the gap isolates a group of candlesticks, creating a distinct pattern that stands out on the chart. This isolation emphasizes the significance of the price action within the island.
                3. Opposing Candlesticks: Following the formation of the gap, the subsequent candlesticks within the island display characteristics opposite to those of the previous trend. For example, if the previous trend was bullish, the candlesticks within the island would exhibit bearish behavior, and vice versa.
                4. Volume: Volume analysis is crucial when confirming the validity of island reversal patterns. A significant increase in volume during the formation of the gap adds credibility to the reversal signal, indicating strong market participation.
                5. Duration: Island reversal patterns can vary in duration, with some islands forming over a few days and others spanning several weeks. The length of the isolation period may influence the strength and reliability of the reversal signal.

                By recognizing these characteristics, traders can effectively identify and interpret island reversal patterns and incorporate them into their trading strategies.

                Types of Island Reversal Patterns

                Island reversal patterns can be classified into two main types based on their direction and implications for market sentiment: bullish island reversal patterns and bearish island reversal patterns.
                1. Bullish Island Reversal Pattern:
                  • Formation: A bullish island reversal pattern occurs when a downward gap separates a group of bearish candlesticks from the preceding uptrend.
                  • Characteristics: Following the formation of the gap, the subsequent candlesticks within the island display bullish behavior, signaling a potential reversal from a downtrend to an uptrend.
                  • Interpretation: Traders interpret a bullish island reversal pattern as a bullish signal, indicating a shift in market sentiment from bearish to bullish. This pattern suggests that buyers have regained control, leading to a possible upward movement in prices.
                2. Bearish Island Reversal Pattern:
                  • Formation: Conversely, a bearish island reversal pattern forms when an upward gap isolates a group of bullish candlesticks from the preceding downtrend.
                  • Characteristics: The candlesticks within the isolated island exhibit bearish characteristics, indicating a potential reversal from an uptrend to a downtrend.
                  • Interpretation: Traders view a bearish island reversal pattern as a bearish signal, signaling a shift in market sentiment from bullish to bearish. This pattern suggests that sellers have regained control, leading to a possible downward movement in prices.

                By understanding the characteristics and implications of bullish and bearish island reversal patterns, traders can identify potential trend reversals and make informed trading decisions.

                Importance of Confirmation

                While island reversal patterns can provide valuable insights into potential trend reversals, it is essential to seek confirmation from other technical indicators or chart patterns before taking trading decisions based solely on these patterns. Confirmation helps validate the reliability of the reversal signal and reduces the risk of false signals.

                Confirmation techniques commonly used by forex traders include:
                1. Trend Analysis: Confirming the direction of the prevailing trend can support the interpretation of island reversal patterns. If a bullish island reversal pattern occurs in an overall uptrend, it is more likely to be valid than if it appears in a downtrend, and vice versa.
                2. Support and Resistance Levels: Identifying key support and resistance levels can provide additional confirmation of an island reversal pattern. If the pattern forms near a significant support or resistance level, it strengthens the likelihood of a reversal.
                3. Volume Analysis: Analyzing trading volume during the formation of the gap and subsequent price action can confirm the validity of the island reversal pattern. A surge in volume during the reversal signal indicates strong market participation and adds credibility to the signal.
                4. Additional Technical Indicators: Using other technical indicators such as moving averages, oscillators, and trend lines can complement the analysis of island reversal patterns. Consistent signals from multiple indicators increase the confidence in the reversal signal.

                By incorporating confirmation techniques into their analysis, traders can enhance the reliability of island reversal patterns and make more informed trading decisions.

                Volume Analysis

                Volume analysis plays a crucial role in confirming the validity of island reversal patterns and assessing the strength of market participation during potential trend reversals. By analyzing trading volume in conjunction with price action, traders can gain valuable insights into market sentiment and make more informed trading decisions.

                When analyzing volume in the context of island reversal patterns, traders pay close attention to the following:
                1. Volume during Gap Formation: The volume accompanying the formation of the gap is significant as it provides insight into the intensity of the price movement. A substantial increase in volume during the formation of the gap indicates strong market participation and adds credibility to the reversal signal.
                2. Volume during Confirmation: Traders also analyze volume during the confirmation phase of the island reversal pattern. If the subsequent candlesticks display strong bullish or bearish behavior accompanied by high trading volume, it confirms the validity of the reversal signal.
                3. Volume Patterns: Patterns in volume can provide additional confirmation of the reversal signal. For example, a spike in volume following the gap formation followed by sustained high volume during the confirmation phase strengthens the reliability of the reversal pattern.
                4. Volume Divergence: Divergence between price and volume can also provide valuable insights into potential trend reversals. For instance, if prices are rising during the formation of a bullish island reversal pattern, but volume is declining, it may indicate weakening bullish momentum and raise doubts about the validity of the pattern.

                By integrating volume analysis into their trading strategies, forex traders can confirm the validity of island reversal patterns and make more informed decisions based on market participation and sentiment.

                Entry and Exit Strategies

                Effectively trading island reversal patterns requires a well-defined approach for entering and exiting trades to capitalize on potential price movements while managing risk. Traders employ various entry and exit strategies to maximize profits and minimize losses when trading these patterns.
                1. Entry Strategies:
                  • Confirmation: Traders wait for confirmation of the island reversal pattern before entering a trade. This may involve waiting for the completion of the confirmation phase, such as the formation of several bullish or bearish candlesticks following the gap.
                  • Breakout Entry: Some traders enter trades when prices break out of the consolidation phase following the confirmation of the reversal pattern. This breakout entry strategy aims to capture the initial momentum of the reversal.
                  • Pullback Entry: Alternatively, traders may wait for a pullback to a key level of support or resistance before entering a trade. This approach allows traders to enter at a more favorable price and reduce the risk of entering trades at the peak of the reversal.
                2. Exit Strategies:
                  • Profit Targets: Traders set predefined profit targets based on key levels of support or resistance, Fibonacci retracement levels, or previous swing highs or lows. Taking profits at these levels helps lock in gains and avoid giving back profits during market retracements.
                  • Trailing Stop Loss: Implementing a trailing stop loss allows traders to capture profits while allowing for potential upside continuation. The trailing stop loss automatically adjusts as the trade moves in the trader's favor, locking in profits while giving the trade room to breathe.
                  • Reversal Signals: If a reversal pattern emerges in the opposite direction of the initial trade, traders may consider exiting the trade to minimize losses. This approach helps traders avoid being caught on the wrong side of a sudden trend reversal.

                By combining entry and exit strategies with proper risk management techniques, traders can effectively trade island reversal patterns and optimize their trading outcomes.

                Risk Management

                Effective risk management is essential when trading island reversal patterns to protect against potential losses and preserve capital. By implementing risk management techniques, traders can mitigate the impact of adverse market movements and maintain a sustainable trading strategy over the long term.

                Key risk management principles for trading island reversal patterns include:
                1. Position Sizing: Determine the appropriate position size for each trade based on the trader's risk tolerance and account size. Avoid risking more than a small percentage of the trading capital on any single trade to prevent significant losses.
                2. Stop Loss Orders: Place stop loss orders at predefined levels to limit potential losses on each trade. Stop loss levels are typically set below support levels for long trades and above resistance levels for short trades to minimize risk.
                3. Risk-Reward Ratio: Maintain a favorable risk-reward ratio for each trade by setting profit targets that exceed the initial risk. Aim for a risk-reward ratio of at least 1:2 or higher to ensure that potential profits outweigh potential losses.
                4. Diversification: Avoid overexposure to any single currency pair or trading instrument by diversifying the trading portfolio. Diversification helps spread risk across multiple assets and reduces the impact of adverse market movements on overall performance.
                5. Adaptability: Be prepared to adjust risk management parameters based on changing market conditions and the specific characteristics of each trade. Adaptability is essential for navigating dynamic market environments and preserving capital in the face of uncertainty.

                By adhering to sound risk management practices, traders can minimize the impact of losses and maintain a disciplined approach to trading island reversal patterns.

                Backtesting and Practice

                Before implementing island reversal patterns in live trading, it is essential for traders to backtest their strategies on historical data and practice executing trades in a simulated environment. Backtesting allows traders to evaluate the performance of their trading strategies under various market conditions and identify potential strengths and weaknesses.

                To backtest island reversal patterns effectively, traders follow these steps:
                1. Data Selection: Choose a reliable source of historical price data for the currency pairs or trading instruments of interest. Ensure that the data includes sufficient detail, such as open, high, low, and close prices, for accurate analysis.
                2. Strategy Definition: Define clear rules for identifying and trading island reversal patterns, including entry and exit criteria, confirmation signals, and risk management parameters. Document the rules to ensure consistency during the backtesting process.
                3. Testing Period: Select a specific time period for backtesting, ideally spanning multiple market cycles and varying market conditions. This allows traders to assess the robustness of their strategies and identify any potential weaknesses.
                4. Execution: Apply the defined strategy rules to the historical price data and simulate trading decisions based on the occurrence of island reversal patterns. Record the outcomes of each trade, including profit and loss, to evaluate the strategy's performance.
                5. Analysis: Analyze the results of the backtesting process to assess the profitability and consistency of the trading strategy. Identify areas for improvement and refinement based on the observed performance.

                In addition to backtesting, traders can practice executing trades based on island reversal patterns in a demo account to gain practical experience and confidence in their trading approach. Demo trading allows traders to refine their skills without risking real capital and prepares them for live trading in the forex market.

                Common Mistakes to Avoid

                While trading island reversal patterns can be profitable, traders should be aware of common mistakes that can undermine their success. By avoiding these pitfalls, traders can improve their trading outcomes and minimize the risk of losses.
                1. Ignoring Confirmation Signals: Failing to wait for confirmation of island reversal patterns increases the risk of entering trades based on false signals. Always wait for confirmation from additional technical indicators or chart patterns before taking trading decisions.
                2. Overlooking Market Context: Trading island reversal patterns in isolation without considering the broader market context can lead to suboptimal results. Always assess the prevailing trend, key support and resistance levels, and other relevant factors before trading reversal patterns.
                3. Neglecting Risk Management: Inadequate risk management increases the likelihood of significant losses and can wipe out trading capital. Always implement proper risk management techniques, including position sizing, stop loss orders, and risk-reward ratios, to protect against adverse market movements.Chasing Trad
                4. ​​​​​FOMO (fear of missing out) can lead traders to chase trades based on island reversal patterns without waiting for favorable entry conditions. Avoid entering trades impulsively and wait for high-probability setups to maximize trading success.
                5. Lack of Patience: Trading requires patience and discipline, especially when waiting for confirmation of reversal patterns. Avoid rushing into trades and be patient when waiting for the right opportunities to arise.

                By recognizing and avoiding these common mistakes, traders can improve their trading discipline and increase their chances of success when trading island reversal patterns.

                Market Conditions and Reliability

                The reliability of island reversal patterns can vary depending on prevailing market conditions, including volatility, liquidity, and trend strength. Traders should consider the following factors when assessing the reliability of island reversal patterns:

                Volatility:
                High volatility can increase the likelihood of false signals and make it challenging to accurately identify reversal patterns. During periods of heightened volatility, traders may prefer to wait for confirmation from additional technical indicators before trading island reversal patterns.
                1. Liquidity: Low liquidity environments can result in erratic price movements and increased slippage, reducing the reliability of reversal signals. Traders should prioritize trading in liquid markets with sufficient trading volume to ensure accurate price discovery and execution.
                2. Trend Strength: The strength of the prevailing trend influences the reliability of reversal patterns. Strong trends are less likely to reverse abruptly, making it essential to assess the underlying trend before trading reversal signals.
                3. Market Sentiment: Market sentiment plays a crucial role in determining the effectiveness of island reversal patterns. Traders should consider the prevailing sentiment among market participants, including investor sentiment, economic data releases, and geopolitical developments, when interpreting reversal signals.

                By evaluating market conditions and adjusting their trading approach accordingly, traders can enhance the reliability of island reversal patterns and improve their overall trading performance.

                Conclusion

                Island reversal patterns are valuable tools for forex traders seeking to identify potential trend reversals and capitalize on price movements in the currency markets. These patterns offer unique insights into market sentiment and can provide profitable trading opportunities when recognized and traded effectively.By understanding the characteristics of island reversal patterns, confirming signals with other technical indicators, and implementing proper risk management techniques, traders can increase their chances of success when trading these patterns. Additionally, backtesting strategies on historical data and practicing in a demo account can help traders refine their skills and gain confidence in their trading approach
                While island reversal patterns can be powerful signals, traders should exercise caution and consider the broader market context before relying solely on these patterns for trading decisions. By continuously learning and adapting to evolving market conditions, traders can stay ahead of the curve and achieve long-term success in forex trading.
                • #9 Collapse

                  Jazbaat Ki Kahani: Island Reversal Candlestick Patterns
                  1. Tashadud Ki Shuruaat:

                    Forex ki duniya mein tashadud ka ek aham hissa hai, aur ismein mukhtalif patterns ka istemal hota hai. Island reversal candlestick patterns is shumar mein hotay hain. Forex trading ek mahirana shobha hai jahan har trader apni strategy ko mazeed behtar banana chahta hai. Ek tajurba kar trader market ke harek roop ko samajhne ka hunar hasil karta hai, aur candlestick patterns is mein aham hissa ada karte hain. Island reversal candlestick pattern ek aham aur mufeed tool hai jo traders ko trend reversal ki nishani deta hai.

                    Island reversal pattern ko samajhna asaan nahi hota, lekin agar ek trader isay theek tarah se samajh le, to yeh unke liye ek bada faida ho sakta hai. Is pattern ka istemal karke traders market ke movements ko aasani se samajh sakte hain aur sahi waqt par trade kar sakte hain.
                  ​​​​​
                  1. Candlestick Patterns:

                    Forex traders ko market ke movements ko samajhne ke liye candlestick patterns ki ahmiyat maloom hai. In patterns mein se ek hai island reversal. Candlestick patterns market sentiment aur price action ka ek aham hissa hain. Ye patterns traders ko market ke mukhtalif phases aur trend changes ko samajhne mein madad karte hain. Candlestick charts par juzvi aur mukammal patterns mojood hote hain jo traders ko market ke future direction ke baray mein sochne mein madad karte hain.

                    Har candlestick pattern apni alag ahmiyat rakhta hai. Kuch patterns trend continuation ko darust karte hain jab ke kuch patterns trend reversal ki nishani dete hain. Island reversal candlestick pattern ek aise pattern hai jo trend reversal ko darust karta hai. Traders ko in patterns ko samajh kar apni trading strategy ko mazeed behtar banane mein madad milti hai.
                  1. Island Reversal Kya Hai:

                    Island reversal ek technical analysis pattern hai jo market trend ke ikhtetam ko nishanay bazari charts par dikhata hai. Is pattern mein ek gap hota hai jo ek trend ke opposite direction mein hota hai. Yeh gap trend reversal ki nishani deta hai aur traders ko indicate karta hai ke market ka trend badalne wala hai.

                    Island reversal pattern mein traders ko doosri candlestick patterns ke sath sath volume aur dusre technical indicators ka bhi tawajjo deni chahiye. Yeh patterns aksar strong reversal signals hote hain lekin unki confirmation ke liye doosre factors bhi zaroori hote hain.
                  1. Pehchan Karain:

                    Island reversal patterns ko pehchanne ke liye, trader ko kisi trending movement ke beech mein ek gap dhoondhna hota hai jo ek trend ki opposite direction mein hota hai. Jab market ek trend mein chal rahi hoti hai aur ek gap achanak ban jata hai, to yeh ek island reversal pattern ki nishani hai.

                    Positive island reversal mein, market downtrend mein hoti hai aur ek bullish candlestick pattern ek gap ke saath shuru hota hai. Is pattern ki nishani hai ke market ka trend bearish se bullish mein badalne wala hai. Negative island reversal mein, market uptrend mein hoti hai aur ek bearish candlestick pattern ek gap ke saath shuru hota hai. Is pattern ki nishani hai ke market ka trend bullish se bearish mein badalne wala hai.
                  1. Positive Island Reversal:

                    Positive island reversal mein, ek downtrend ke baad bullish candlestick patterns aate hain jo ek gap ke saath shuru hotay hain, jo ki trend ki reversal ko darust karta hai. Positive island reversal patterns ko samajhna traders ke liye zaroori hai taake wo sahi waqt par entry aur exit points ka faisla kar sakein.

                    Ek misal ke tor par, agar market ek downtrend mein hai aur ek bullish candlestick pattern ek gap ke saath shuru hota hai, to yeh ek positive island reversal ki nishani hai. Traders ko is nishani par amal kar ke apni trading strategy ko mazeed behtar bana sakte hain.
                  1. Negative Island Reversal:

                    Negative island reversal mein, ek uptrend ke baad bearish candlestick patterns aate hain jo ek gap ke saath shuru hotay hain, jo ki trend ki reversal ko darust karta hai. Negative island reversal patterns ko samajhna traders ke liye zaroori hai taake wo sahi waqt par entry aur exit points ka faisla kar sakein.

                    Agar market ek uptrend mein hai aur ek bearish candlestick pattern ek gap ke saath shuru hota hai, to yeh ek negative island reversal ki nishani hai. Traders ko is nishani par amal kar ke apni trading strategy ko mazeed behtar bana sakte hain.
                  1. Confirmation Ki Zarurat:

                    Island reversal patterns ko confirm karne ke liye, traders ko volume aur dusre technical indicators ka bhi istemal karna hota hai. Ek single candlestick pattern par bharosa karne se pehle, traders ko dusre factors ka bhi tawajjo dena chahiye jo pattern ki confirmation mein madad karte hain.

                    Volume ek aham indicator hai jo traders ko market sentiment ka pata lagane mein madad karta hai. Agar kisi island reversal pattern ke sath high volume mojood hai, to iska matlab hai ke market mein zyada interest hai aur pattern ki confirmation ho sakti hai. Dusre technical indicators jaise ke moving averages, RSI, aur MACD bhi island reversal patterns ko confirm karne mein madad karte hain.
                  1. Trading Strategy:

                    Island reversal patterns ko samajh kar, traders apni trading strategy ko improve kar sakte hain. Ye patterns trend reversal ka mukhtalif tareeqay hain aur traders ko market ke changes ko samajhne mein madad karte hain. Ek mukammal trading strategy banana traders ke liye zaroori hai taake wo market ke movements ke mutabiq trade kar sakein.

                    Traders ko apni trading strategy mein island reversal patterns ko shamil karne se pehle apne risk tolerance aur trading goals ko bhi madah karna chahiye. Har trader ka trading style alag hota hai, is liye wo apni strategy ko apne needs ke mutabiq customize karna chahiye.
                  1. Stop Loss Aur Take Profit:

                    Island reversal patterns ka istemal karne waale traders ko apne trades ke liye sahi stop loss aur take profit levels tay karna zaroori hai. Stop loss ek aham risk management tool hai jo traders ko loss se bachata hai jab market against unki trade chal rahi hoti hai. Take profit levels traders ko profit booking mein madad karte hain jab market unki favor mein chal rahi hoti hai.

                    Stop loss aur take profit levels ko tay karne ke liye, traders ko market ke volatility, trend strength, aur apni risk tolerance ka bhi tawajjo dena chahiye. Ek mufeed stop loss aur take profit level tay karne se traders apne trades ko better manage kar sakte hain aur apne trading account ko protect kar sakte hain.
                  1. Risk Management:

                    Forex trading mein island reversal patterns ka istemal karne se pehle, traders ko apni risk management ki strategy ko bhi mazbooti se samajhna chahiye. Risk management ek aham hissa hai har trading strategy ka jo traders ko apne capital ko protect karne mein madad karta hai.

                    Traders ko apni risk tolerance ka pata lagana chahiye aur phir unhe apne trades ke liye sahi risk reward ratio tay karna chahiye. Risk reward ratio traders ko batata hai ke wo kitna risk le rahe hain har trade par aur kitna reward expect kar rahe hain. Ek mufeed risk management strategy traders ko trading career mein kamiyabi ki taraf le jane mein madad karta hai.
                  1. Practice Makes Perfect:

                    Island reversal patterns ko samajhna aur unka istemal karna practice aur experience ki zarurat hai. Traders ko apni trading skills ko improve karne ke liye regular practice aur observation ki zarurat hoti hai. Har pattern ko samajhne aur un par amal karne ke liye waqt dena chahiye.

                    Traders ko demo accounts ka istemal kar ke island reversal patterns ko samajhna aur un par practice karna chahiye. Demo accounts real market conditions ke under trading karne ka ek acha tareeqa hai jahan traders bina kisi risk ke apni trading strategy ko test kar sakte hain. Mazeed, traders ko apne trades ki performance ko regularly review karna chahiye taake wo apne mistakes ko identify kar sakein aur unse seekh sakein.
                  1. Educational Resources:

                    Forex traders ko island reversal patterns aur dusre technical analysis tools ke bare mein mazeed taleem hasil karne ke liye online courses aur books ka istemal kar sakte hain. Internet par mukhtalif educational resources mojood hain jo traders ko market ke bare mein mazeed samajhne mein madad karte hain.

                    Online courses traders ko step by step guide karte hain ke kis tarah se wo trading ko samajh sakte hain aur apni skills ko improve kar sakte hain. Books bhi ek acha zariya hain jo traders ko market ke bare mein gehra ilm hasil karne mein madad karte hain. Traders ko mazeed knowledge hasil karne ke liye, wo apne learning process ko regular banaye rakhein aur naye concepts ko samajhne ke liye khulay dimagh se kaam karein.
                  1. Conclusion:

                    Island reversal candlestick patterns forex trading mein ek ahem tool hain jo traders ko market ke movements ko samajhne aur sahi trading decisions lene mein madad karte hain. Lekin, unka istemal karne se pehle, traders ko in patterns ko achhi tarah samajhna aur un par amal karna zaroori hai. Traders ko apni trading strategy ko mazeed behtar banane ke liye island reversal patterns ka istemal karne ka tajurba hasil karna chahiye. Mazeed, traders ko apne trades ko monitor karte rehna chahiye aur apni strategy ko regular basis par review karna chahiye taake wo apne trading career mein kamiyabi ki taraf le jaa sakein.
                  • <a href="https://www.instaforex.org/ru/?x=ruforum">InstaForex</a>
                  • #10 Collapse

                    Island Reversal Candlestick Pattern
                    Introduction👇👇👇


                    Assalamu Alaikum dear main ummid karta hun aap sab khairiyat se Honge aur Achcha kam kar rahe Honge ham es fore forum main koi bhe asey baat na karay jo es ka releated na ho agr ham koi bhe asey baat karty hain post main ya threads main to hamrey vho delete ho jati hy foran to asey main ham ko bs jo bhe post ya tthreadsx karani hy souch samjh kar forex sa releated baat karni chaheya Ham Ko is market Mein inter hone ke liye ek acche mind ke sath kam karna chahie Dear buddies or aap ka trading week bhi acha ja rha ho ga.yeh pattern*aur indicator humari trading main bht important role play karty hain.yeh humain profit delany main bht madad karty hain. Hum agr in ki learning nai krain gy or in ko fazool samjyn gy to kbi b kamyabi humary kadam ni choomy gi aaj hum jis topic per bat krain gay Agar Ham ismein Apna mind open karke Koi kam vagaira Karte Hain To Humko ismein Achcha Kam Karne Ko Dil Karta Hai Agar Ham ismein apne aap ko mayus karke ismein kam karte hain to hamare Se Koi Kam Nahin Hoga ismein Kam karna Ek bahut hi Achcha hai Hamen ismein time Dena chahie Jitna Ham time Denge Hamen utna Hi ismein Kam Karne Se fayda Hoga aur ham Agar ismein thread karne se pahle Hamen post ko acchi Tarah Se read karna chahie Agar Ham post ko acchi Tarah se padh Lenge To Ham uska jawab De Sakenge isliye Ham Aaj is topic per baat kar rahe hain aur jisse Humko bahut Achcha fayda hota hai agar Ham thread ko read Karke use topic per baat karte hain to hamare knowledge mein izaafa hota hai aur Hamara experience Bhi Jyada ho jata hai hamara experience aur knowledge aise hi badhta hai agar Ham thread ko uski topic ko acchi Tarah se padh Lenge To Ham uska jawab De Sakenge isliye Ham Aaj thread Ka Jawab de rahe hain aur jo bhi Humko ismein Koi kam hota hai aurjazeeray ke namoonay ufaq par tabdeeli ke qabil aetmaad isharay hein. Lekin yahan tak ke agar aap candle caught charts ko talaash karne aur un ka tajzia karne me bohat achay hein, tab bhi aap ko chart par jazeeray kiforexmarket Me Jab Ham kam kar rahy hoty hein to usme police Island trendpattern Aiktrain reversal sample hy jo ke market ke low chargevicinity ya undergo stand ke terrible banta hy yah pattern Dekhne Me bullish Abid night time timechild candlesticks sample Jaisa Hy butdistinction Yeh hy ki Island reversal bullish candles Jyada cand tabdeeli nahi mil sakti hy. Hein jo ki sari candles beary strand se hole me open aur close Hoti Hy yah sample bullish bedroom it toddler candles take pattern Ki Tarah formation Me Hota Hy however vah teenager candles in step with muft Mel hota hy jabki is Me five candles hoti hein pattern ka aagaaj bearing stand ke awful Aikblack candle se hota hy jo ki pahle trend se downward facetin line withgap me open Hoti Hy Jiske lousy sem hollow Me 2d0.33 forth aur 5th bhi banti hy yah sari Candles hoti to realframe me hy howeversize Inka small hota hy pattern ki fifthstandard Aikactualbody wali white candles hoti introduction Nahin Hoti
                    pattern ko confirm karne ke liye, traders ko typically next few candles ka wait karna chahiye, jisse ke pattern ki validity ko confirm kiya ja sake.Jab ek trader ek island reversal pattern identify kartareversals and capitalize on price movements in the currency markets. These patterns offer unique insights into market sentiment and can provide profitable trading opportunities when recognized and traded effectively.By understanding the characteristics of island reversal patterns, confirming signals with other technical indicators, and implementing proper risk management techniques, traders can increase their chances of success when trading these patterns. Additionally, backtesting strategies on historical data and practicing in a demo account can help traders refine their skills and gain confidence in their trading approach
                    While island reversal patterns can be powerful signals, traders should exercise caution and consider the broader market context before relying solely on these patterns for trading decisions. By continuously learning and adapting to evolving market conditions, traders can stay ahead of the curve and achieve long-term success in forex hai, to wo stop loss ka istemal karta hai taake in case agar reversal hone ki jagah trend phir se usi direction mein chalne lagta hai, to nuksan se bacha ja sake.Island reversal pattern ki pehchan karne ke baad, traders ko target set karna chahiye ke wo kis direction mein trade kar rahe hain, aur unki exit strategy kya hogi agar trend reversal ho jaye.

                    Click image for larger version  Name:	dotdash_Final_Island_Reversal_Aug_2020-02-018c391240e54aa58a31a246122f20cd.jpg Views:	14 Size:	323.6 KB ID:	12899905 Hai Agar Ham Iske hisab se Ham ismein thread per introduction karte hain Puri detail ke sath aur identify Karte Hain To Hamen hi Achcha fayda hota hai aur
                    Island reversal candlestick patterns forex trading mein ek ahem tool hain jo traders ko market ke movements ko samajhne aur sahi trading decisions lene mein madad karte hain. Lekin, unka istemal karne se pehle, traders ko in patterns ko achhi tarah samajhna aur un par amal karna zaroori hai. Traders ko apni trading strategy ko mazeed behtar banane ke liye island reversal patterns ka istemal karne ka tajurba hasil karna chahiye. Mazeed, traders ko apne trades ko monitor karte rehna chahiye aur apni strategy ko regular basis par review karna chahiye taake wo apne trading career mein kamiyabi ki taraf le jaa sakein dusron ko bhi achcha fayda hota hai isliye Hamen Soch samajhkar ismein kam karna chahie Jaise Hamare knowledge mein bhi izaafa ho aur dusron ke knowledge mein bhi jyada ho
                    Like tu banta hay ik🙏

                    اب آن لائن

                    Working...
                    X