What Is the ABCD Pattern?
No announcement yet.
X
  • وقت
  • دکھائیں
Clear All
new posts
  • #1 Collapse

    What Is the ABCD Pattern?
    ABCD Pattern Technical Analysis Intro.

    ABCD Pattern ek technical analysis pattern hai jo stocks, commodities, currencies, ya anya financial instruments ke price movements ko analyze karne ke liye istemal hota hai. Ye pattern traders ko price trends ko samajhne aur future price movements ka anuman lagane mein madad karta hai.ABCD pattern ek powerful technical analysis tool hai jo traders ko price movements ko samajhne aur trading ke decisions lene mein madad karta hai. Lekin, is pattern ko samajhna aur istemal karna experience aur practice ka kaam hai. Traders ko apne risk ko manage karte hue pattern ko sahi tareeke se istemal karna chahiye.ABCD pattern, price action ka ek prakar hai jo typically chaar mukhya stages ya points ko shamil karta hai: A, B, C, aur D. Ye points market mein reversals ya trend changes ko darust karte hain. Har point ko specific price levels ya swings se represent kiya jata hai.

    Click image for larger version

Name:	abcd-pattern-graphic-02.png
Views:	107
Size:	21.5 کلوبائٹ
ID:	12895471

    ABCD Pattern Ke Tareeqay.
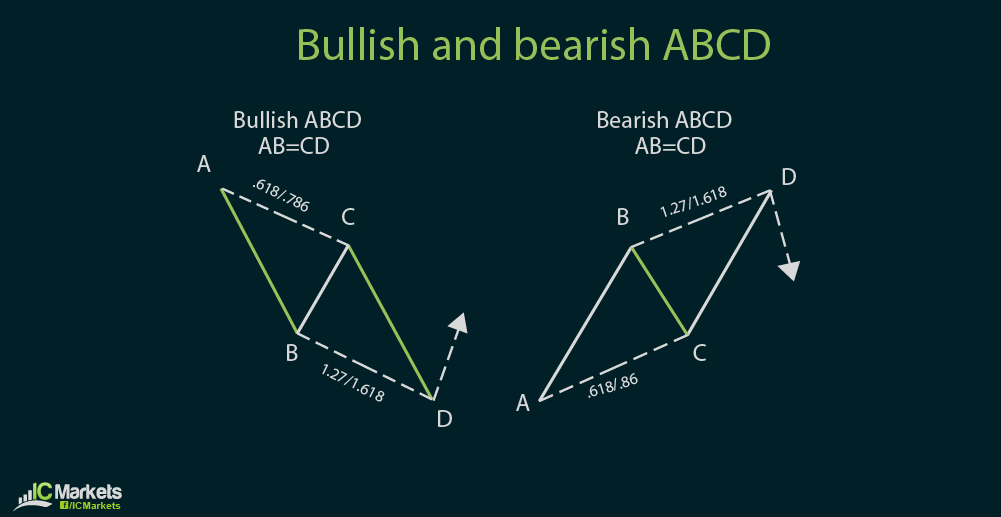
    1. Point A: Yeh pehla point hota hai jahan price trend shuru hota hai. Ye typically ek trend reversal ke baad ya phir ek existing trend ke extension ke doran paya jata hai.
    2. Point B: Point B ek retracement ya correction point hota hai jahan price trend mein ek temporary reversal hota hai. Yeh point usually Point A se kuch had tak opposite direction mein hota hai.
    3. Point C: Point C bhi ek retracement point hota hai jahan price trend mein doosri muddat ka reversal hota hai. Yeh typically Point B ke pasandaaz mein hota hai.
    4. Point D: Point D, pattern ka ant, ya toh ek reversal ke liye ya phir ek trend extension ke liye hota hai. Yeh typically ek Fibonacci extension level ke nazdeek paya jata hai.
    ABCD Pattern Ki Pechidaayi.

    ABCD pattern ka istemal karna trading mein kamyabi ke liye kai challenges ke sath ata hai. Kuch pechidaayiyan is tarah hain.
    1. Subjectivity: Pattern ko identify karna ek tajziati mizaaj hai. Traders ko price movements ko analyze karne mein mahir hona chahiye taake woh sahi tareeke se pattern ko pehchan sakein.
    2. False Signals: Kabhi kabhi ABCD pattern false signals ya fakeouts bhi generate kar sakta hai. Yeh hota hai jab price trend pattern ke mutabiq nahi chalta aur traders ko galat samjha jaata hai.
    3. Risk Management: Trading mein risk management ka ahem kirdaar hota hai. ABCD pattern ko follow karte hue, traders ko apne positions ko control karna aur stop loss orders ka istemal karna zaroori hota hai.
    4. Experience Required: ABCD pattern ko samajhna aur istemal karna traders ke liye experience aur practice ki zaroorat hai. Naye traders ko pattern ko sahi tareeke se pehchanna aur us par trade karna seekhne mein waqt lag sakta hai.
    Click image for larger version

Name:	images.png
Views:	77
Size:	7.1 کلوبائٹ
ID:	12895472

    ABCD Pattern Ke Fayde.

    ABCD pattern ke istemal se traders ko kuch fawaid bhi hote hain.
    1. Price Analysis: Pattern ko samajh kar traders price movements ko better analyze kar sakte hain aur potential trading opportunities ko pehchan sakte hain.
    2. Entry Points: ABCD pattern entry points provide karta hai jahan traders apne positions ko enter kar sakte hain.
    3. Risk Reward Ratio: Pattern traders ko risk reward ratio ko manage karne mein madad karta hai. Sahi entry aur exit points ko chun kar, traders apne risk ko kam kar sakte hain aur potential rewards ko maximize kar sakte hain.
    4. Pattern Recognition: ABCD pattern ke istemal se traders apne technical analysis skills ko improve kar sakte hain aur future price movements ko predict karne mein maharat hasil kar sakte hain.
    ABCD Pattern Ka Istemal Kaise Kiya Jaye

    ABCD pattern ko samajhne aur istemal karne ke liye traders ko kuch steps follow karne chahiye.

    Click image for larger version

Name:	images (1).png
Views:	75
Size:	21.2 کلوبائٹ
ID:	12895473
    1. Chart Analysis: Pehle toh traders ko price charts analyze karna chahiye aur potential ABCD patterns ko pehchan na chahiye.
    2. Confirmation: Pattern ko confirm karne ke liye, traders ko aur technical indicators ya price action signals ka istemal karke verify karna chahiye.
    3. Entry aur Exit Points: Traders ko entry aur exit points ko tay karna chahiye jahan wo positions enter karenge aur exit karenge.
    4. Risk Management: Har trade ke liye risk management plan banana zaroori hai. Traders ko apne positions ko monitor karna aur stop loss orders ka istemal karna chahiye.
    5. Practice: ABCD pattern ko samajhne aur us par trade karne ke liye practice aur experience ka hona zaroori hai. Traders ko demo accounts ya small positions par trading karke pattern ko samajhna chahiye.
  • <a href="https://www.instaforex.org/ru/?x=ruforum">InstaForex</a>
  • #2 Collapse


    ABCD Pattern ek technical analysis ka pattern hai jo market trends ko analyze karne ke liye istemal hota hai. Yeh pattern traders ko price movements ke patterns ko samajhne aur trading opportunities ko pehchanne mein madad karta hai. ABCD pattern ek reversal pattern hai, yaani ke jab market ek trend se reverse hota hai, toh yeh pattern dikhai deta hai.

    Yeh pattern char mukhya stages se milta hai: A, B, C, aur D. Har stage ko specific price movements aur retracements ke sath associated kiya jata hai. Yeh pattern Fibonacci ratios par bhi based hota hai.

    Yahan, main ABCD pattern aur uske key notes ke bare mein batata hoon:
    1. Aurat Point (Point A): Ye starting point hota hai jahan se pattern shuru hota hai. Price ki movement ko dekhte hue A point ko identify kiya jata hai.
    2. Bharna Point (Point B): A ke baad, price mein ek significant movement hoti hai, jo ki B point ko create karti hai. Yeh movement usually A se B ke darmiyan ek retracement hota hai.
    3. C Point: B point ke baad, price phir se original direction mein move karti hai, lekin is baar woh thori si tezi se hoti hai. C point pe price phir se change direction karti hai.
    4. Disappearing Point (Point D): C ke baad, price mein ek aur retracement hoti hai, jo ki D point ko banati hai. D point, ABCD pattern ka completion point hota hai.

    Key Notes:
    1. ABCD pattern ko identify karne ke liye Fibonacci retracement levels ka istemal kiya jata hai. Yeh levels A se B aur C se D ke beech ke retracements ko measure karte hain.
    2. ABCD pattern ka use karke traders price ke future movements ka estimate karte hain. Agar ABCD pattern complete hota hai, toh traders price ki next movement ke direction ko predict kar sakte hain.
    3. ABCD pattern ke formation mein patience aur practice ki zaroorat hoti hai. Traders ko market mein regularly observe karna chahiye taki woh sahi samay par is pattern ko identify kar sakein.
    4. ABCD pattern ke sath-sath dusre technical indicators ka bhi istemal kiya jata hai jaise ki moving averages, RSI, aur MACD, taaki confirmatory signals mil sakein.
    5. Har ABCD pattern ka size aur shape alag hota hai, isliye traders ko har pattern ko individually analyze karna chahiye aur apne trading strategy ko uske hisab se adjust karna chahiye.

    ABCD pattern ka istemal karke, traders market ke movements ko samajh sakte hain aur potential trading opportunities ko pehchan sakte hain. Lekin, jaise ki har trading strategy mein hota hai, isme bhi risk hai aur traders ko apni research aur risk management par focus rakhna chahiye.


    • #3 Collapse


      What Is the ABCD Pattern?

      Forex trading mein, chart patterns ka istemal market trends aur potential entry or exit points ka pata lagane ke liye kiya jata hai. ABCD pattern ek aham chart pattern hai jo market mein price ka movement predict karne mein madadgar hota hai. Is article mein, hum ABCD pattern ke bare mein roman urdu mein tafseel se baat karenge, sath hi is pattern ke istemal se trading ke tariqay bhi janenge.

      Click image for larger version

Name:	A 69.jfif
Views:	103
Size:	6.3 کلوبائٹ
ID:	12895527


      ABCD Pattern Kya Hai?

      ABCD pattern ek price action pattern hai jo market mein harmonious aur repeatable price structures ko identify karta hai. Ye pattern typically trend reversal ya trend continuation ke signals deta hai. ABCD pattern ko "AB=CD" pattern bhi kaha jata hai, kyun ke is pattern mein, AB leg ke equal CD leg hoti hai.

      ABCD Pattern Ki Pechan Kaise Karein?

      ABCD pattern ki pehchan ke liye kuch key points hain:
      1. Legs: ABCD pattern mein 4 legs hoti hain: AB leg (initial move), BC leg (correction after AB), CD leg (move in the direction of AB), aur final leg (CD leg ke baad ka move).
      2. Proportions: AB leg aur CD leg ke between BC leg ki length mein kuch proportions hoti hain. Typically, BC leg AB leg ke 38.2% to 88.6% tak hoti hai, aur CD leg BC leg ke 127.2% to 161.8% tak hoti hai.
      3. Point D: CD leg ke end point ko point D kaha jata hai, jo ki AB leg ke start point se milta hai.

      ABCD Pattern Trading Strategy

      ABCD pattern ka istemal kar ke traders market mein price ka movement predict kar sakte hain. Yahan kuch steps hain jo aap follow kar sakte hain ABCD pattern ke sath trading karne ke liye:
      1. Pattern Recognition: Sab se pehle, aapko ABCD pattern ko recognize karna hai. Is ke liye aapko price chart par patterns ki talaash karni hogi jo AB leg, BC leg, aur CD leg ko represent karte hain.
      2. Entry Point: Entry point ko determine karne ke liye, aapko point D ke breakout ka wait karna chahiye. Agar price point D ko break kar ke upar ja raha hai to ye ek buy signal ho sakta hai, jabki agar price point D ko break kar ke neeche ja raha hai to ye ek sell signal ho sakta hai.
      3. Stop Loss: Entry ke waqt stop loss lagana zaroori hai. Stop loss ko point D ke just below lagaya jata hai.
      4. Target Setting: Target setting mein aap previous swing high ya Fibonacci extension levels ka istemal kar sakte hain.

      Conclusion

      ABCD pattern ek powerful trading tool hai jo traders ko market trends ke bare mein insights provide karta hai. Is pattern ka sahi istemal kar ke traders apni trading strategies ko improve kar sakte hain. Lekin, jaise har trading strategy mein hota hai, ABCD pattern ka istemal bhi proper risk management ke sath karna zaroori hai.

      ABCD Pattern: Forex Trading Strategy

      Forex trading mein, chart patterns ka istemal market trends aur potential entry or exit points ka pata lagane ke liye kiya jata hai. ABCD pattern ek aham chart pattern hai jo market mein price ka movement predict karne mein madadgar hota hai. Is article mein, hum ABCD pattern ke bare mein roman urdu mein tafseel se baat karenge, sath hi is pattern ke istemal se trading ke tariqay bhi janenge.

      ABCD Pattern Kya Hai?

      ABCD pattern ek price action pattern hai jo market mein harmonious aur repeatable price structures ko identify karta hai. Ye pattern typically trend reversal ya trend continuation ke signals deta hai. ABCD pattern ko "AB=CD" pattern bhi kaha jata hai, kyun ke is pattern mein, AB leg ke equal CD leg hoti hai.

      ABCD Pattern Ki Pechan Kaise Karein?

      ABCD pattern ki pehchan ke liye kuch key points hain:
      1. Legs: ABCD pattern mein 4 legs hoti hain: AB leg (initial move), BC leg (correction after AB), CD leg (move in the direction of AB), aur final leg (CD leg ke baad ka move).
      2. Proportions: AB leg aur CD leg ke between BC leg ki length mein kuch proportions hoti hain. Typically, BC leg AB leg ke 38.2% to 88.6% tak hoti hai, aur CD leg BC leg ke 127.2% to 161.8% tak hoti hai.
      3. Point D: CD leg ke end point ko point D kaha jata hai, jo ki AB leg ke start point se milta hai.

      ABCD Pattern Trading Strategy

      ABCD pattern ka istemal kar ke traders market mein price ka movement predict kar sakte hain. Yahan kuch steps hain jo aap follow kar sakte hain ABCD pattern ke sath trading karne ke liye:
      1. Pattern Recognition: Sab se pehle, aapko ABCD pattern ko recognize karna hai. Is ke liye aapko price chart par patterns ki talaash karni hogi jo AB leg, BC leg, aur CD leg ko represent karte hain.
      2. Entry Point: Entry point ko determine karne ke liye, aapko point D ke breakout ka wait karna chahiye. Agar price point D ko break kar ke upar ja raha hai to ye ek buy signal ho sakta hai, jabki agar price point D ko break kar ke neeche ja raha hai to ye ek sell signal ho sakta hai.
      3. Stop Loss: Entry ke waqt stop loss lagana zaroori hai. Stop loss ko point D ke just below lagaya jata hai.
      4. Target Setting: Target setting mein aap previous swing high ya Fibonacci extension levels ka istemal kar sakte hain.

      Conclusion

      ABCD pattern ek powerful trading tool hai jo traders ko market trends ke bare mein insights provide karta hai. Is pattern ka sahi istemal kar ke traders apni trading strategies ko improve kar sakte hain. Lekin, jaise har trading strategy mein hota hai, ABCD pattern ka istemal bhi proper risk management ke sath karna zaroori hai.
      • #4 Collapse


        What Is the ABCD Pattern?
        ABCD Pattern ek technical analysis ka concept hai jo ke stock market ya forex trading mein istemal hota hai. Ye pattern price movement ko analyze karne ke liye istemal hota hai aur traders ko potential trading opportunities dhoondhne mein madad karta hai.
        ABCD Pattern ek geometric shape hota hai jo ke price movement ko represent karta hai. Ye typically ek trend reversal pattern hota hai, matlab ke jab ek trend khatam hota hai aur naya trend shuru hota hai, to ye pattern dikhai deta hai.

        ABCD Pattern mein char main points hote hain:
        1. Point A: Ye starting point hota hai jahan se trend shuru hota hai. Agar uptrend hai to ye sabse nichla point hota hai aur agar downtrend hai to ye sabse ooncha point hota hai.
        2. Point B: Ye trend ke first retracement ka point hota hai. Agar uptrend hai to ye point upar hota hai aur agar downtrend hai to ye point neeche hota hai.
        3. Point C: Ye trend ke second retracement ka point hota hai. Ye point typically Point A aur Point B ke darmiyan hota hai.
        4. Point D: Ye last point hota hai jo trend ka completion point hota hai. Ye typically Point A aur Point B ke extension ka level hota hai.
        ABCD Pattern ke istemal se traders trend reversal points ko identify kar sakte hain aur trading opportunities ko pakar sakte hain. Ye pattern Fibonacci retracement levels ke sath bhi istemal hota hai taake price movements ko aur accurately analyze kiya ja sake.

        Yeh pattern price charts par dikhai deta hai jab ek trend khatam hone ki sambhavna hoti hai aur naya trend shuru hone wala hota hai. Iske through, traders trend reversal points ko anticipate kar sakte hain aur unhe apni trading strategies ke according trade kar sakte hain.

        Is pattern ka istemal karke traders trend ki direction aur market ke future movements ko predict kar sakte hain. Isse unhe ek framework milta hai jisse woh price action ko analyze kar sakte hain aur trading decisions ko lenge. Lekin, ABCD Pattern ke saath saath, traders ko technical indicators aur fundamental analysis ka bhi istemal karna zaroori hota hai taake unki trading decisions ko validate kiya ja sake aur risks ko manage kiya ja sake.
        ABCD Pattern ki kuch properties hain jo ise aur samajhne mein madadgar banaati hain:
        1. Symmetry: ABCD Pattern ka ek mukhya gun hai uska symmetry. Yani ke, is pattern mein A se B, phir B se C, aur phir C se D ke beech ka distance approximately barabar hota hai. Ye symmetry traders ko pattern ko detect karne mein aur uski validity ko confirm karne mein madad karta hai.
        2. Fibonacci Ratios: ABCD Pattern Fibonacci retracement levels ke sath closely associate hota hai. Is pattern mein price movements ko Fibonacci ratios jaise ki 0.618, 0.786, 1.272, aur 1.618 ke sath relate kiya jata hai. Ye ratios A se B, B se C, aur C se D ke beech ke distances mein paye ja sakte hain.
        3. Completion at Point D: ABCD Pattern ka completion point D hota hai, jahan trend reversal ki sambhavna hoti hai. Is point par price action aur volume ki analysis ki jati hai taake confirm kiya ja sake ke pattern pura hua hai ya nahi.
        4. Volume Confirmation: ABCD Pattern ki validity aur strength ko confirm karne ke liye volume ka bhi dhyaan diya jata hai. Agar pattern ke completion point par volume increase hoti hai, toh ye pattern ki strength ko aur bhi zyada confirm karta hai.
        5. Price Projection: ABCD Pattern ke completion ke baad traders price projection calculate kar sakte hain jisse woh potential target levels aur stop-loss levels identify kar sake.
        bottom line:
        In properties ki madad se traders ABCD Pattern ko detect kar sakte hain aur uski validity ko confirm karke trading decisions lenge. Lekin, har ek property ko dhyaan se analyze karna zaroori hai aur multiple indicators ke sath pattern ko validate karna chahiye trading risk ko kam karne ke liye.
        Is tarah se, ABCD Pattern traders ko market ke movement ko samajhne aur potential trades ko spot karne mein madad karta hai. Lekin, jaise har trading strategy ki tarah, iska bhi istemal karne se pehle thorough research aur risk management ka dhyaan rakhna zaroori hai.ABCD Pattern ka kaam hota hai market mein price movement ko analyze karna aur potential trading opportunities ko identify karna. Is pattern ka istemal traders aur investors market trends ko samajhne aur price action ko interpret karne mein karte hain.

        • #5 Collapse


          You
          What is the abcd pattern?


          Title: Understanding the ABCD Pattern in Trading

          In the vast landscape of financial markets, traders employ various strategies and techniques to identify potential price movements and make informed decisions. One such pattern that has gained popularity among traders is the ABCD pattern. This pattern is a simple yet effective tool used primarily in technical analysis to forecast potential price reversals or continuations. Let's delve into what the ABCD pattern entails and how traders utilize it in their trading endeavors.
          What is the ABCD Pattern?


          The ABCD pattern is a geometric price pattern that consists of four distinct points: A, B, C, and D. These points represent specific price movements within a broader trend. The pattern typically appears in trending markets and is used to identify potential entry and exit points for trades. The letters A, B, C, and D do not signify any particular significance other than serving as reference points within the pattern.
          1. Point A: This is the starting point of the pattern and represents the beginning of a significant price move in the prevailing trend. It marks the initial impulse that sets the pattern in motion.
          2. Point B: Point B is where the first corrective phase occurs after the initial impulse from point A. This correction indicates a temporary pause or reversal in the trend.
          3. Point C: Point C marks the resumption of the original trend direction after the corrective phase from point B. It typically coincides with a retracement of the initial impulse from point A.
          4. Point D: Point D represents the completion of the pattern and indicates the potential reversal or continuation of the trend. It is often located at Fibonacci extension levels of the BC move (the distance from point B to point C).
          How to Identify the ABCD Pattern?


          Identifying the ABCD pattern requires a keen eye for recognizing specific price movements within a chart. Traders typically use technical analysis tools such as trend lines, Fibonacci retracements, and price oscillators to confirm the presence of the pattern. Here's a step-by-step guide to identifying the ABCD pattern:
          1. Identify the Trend: Determine the prevailing trend direction in the market. The ABCD pattern is most reliable when it occurs within an established trend.
          2. Locate Points A and B: Look for a significant price move in the direction of the trend (point A), followed by a corrective phase (point B). Use trend lines or price oscillators to confirm these points.
          3. Find Point C: Point C should occur near a Fibonacci retracement level of the AB move. This indicates the resumption of the trend after the correction.
          4. Confirm Point D: Point D should ideally coincide with Fibonacci extension levels of the BC move. Traders may use Fibonacci extensions or other technical indicators to confirm this point.
          Trading Strategies with the ABCD Pattern


          Traders employ various strategies when trading the ABCD pattern, depending on their risk tolerance, time horizon, and market conditions. Some common strategies include:
          1. Reversal Trading: Traders anticipate a reversal in the trend after the completion of the ABCD pattern at point D. They may initiate short or long positions based on other confirming indicators.
          2. Continuation Trading: If the ABCD pattern forms within a strong trend, traders may anticipate a continuation of the trend after point D. They can enter trades in the direction of the trend, aiming to ride the momentum further.
          3. Risk Management: Implementing proper risk management techniques, such as setting stop-loss orders and adhering to position sizing rules, is crucial when trading the ABCD pattern to mitigate potential losses.
          Conclusion


          The ABCD pattern is a valuable tool in a trader's arsenal for identifying potential price reversals or continuations within trending markets. By understanding the structure of the pattern and employing appropriate technical analysis techniques, traders can enhance their decision-making process and improve their trading outcomes. However, like any trading strategy, it is essential to combine the ABCD pattern with other confirming indicators and practice prudent risk management to achieve consistent success in the financial markets.
          • #6 Collapse

            What Is the ABCD Pattern?
            Click image for larger version

Name:	download (32).png
Views:	74
Size:	7.8 کلوبائٹ
ID:	12895577

            ABCD Pattern ek technical analysis concept hai jo traders aur investors ke liye market trends aur price movements ko analyze karne ka ek tarika hai. Yeh pattern price chart par specific shapes aur formations ko identify karta hai jo future price movements ko predict karne mein madad karta hai.
            Click image for larger version

Name:	images (1).jpeg
Views:	72
Size:	8.5 کلوبائٹ
ID:	12895578
            Is pattern ka naam isliye ABCD hai kyunki isme char main components hote hain: A, B, C, aur D. Yeh components price movements ke different phases ko represent karte hain.

            A phase mein, ek uptrend ya downtrend shuru hoti hai. Jab price trend badalta hai, wo A phase shuru hota hai.

            B phase mein, price trend mein kuch changes aate hain. Agar initial trend uptrend tha to price downward direction mein shift karta hai, aur agar initial trend downtrend tha to price upward direction mein shift karta hai. B phase ke dauran, ek reversal pattern bhi develop ho sakta hai.

            C phase mein, price trend continue hoti hai, lekin ek temporary reversal ya correction hoti hai, jisse trend ko confirm karne ka chance milta hai.

            D phase mein, price trend wapas original direction mein move karta hai. Agar initial trend uptrend tha to price wapas upward direction mein move karta hai, aur agar initial trend downtrend tha to price wapas downward direction mein move karta hai.

            Traders ABCD pattern ka use karte hain takay wo potential trading opportunities identify kar sakein. Jab wo pattern ko identify karte hain, to wo entry aur exit points ko determine karne ke liye uska use karte hain. Is pattern ke mukhtalif variations bhi hote hain, jaise ki bullish ABCD pattern aur bearish ABCD pattern, jo market ke different scenarios mein istemal kiye ja sakte hain.

            Yeh pattern keval ek tool hai, aur iske saath sahi risk management aur dusre technical indicators ka bhi istemal kiya jana chahiye trading decisions lene se pehle. Iske bina, traders ko false signals mil sakte hain, jo unhe nuksan mein daal sakte hain.
            • #7 Collapse

              1. ABCD Pattern: Forex Trade Mein Ek Ahem Tajarba
              Forex trading ek mushtarka aur paise kamane ka zariya hai jo dunya bhar mein logon ke darmiyan hota hai. Is mein tajurba aur tajziye ka bara hissa hota hai. ABCD pattern ek aham tajarba hai jo forex trading mein istemal hota hai. Ye ek technical analysis ka hissa hai jo traders ko market ke trends aur price movements ko samajhne mein madad karta hai.
              1. ABCD Pattern Ki Pehchan: Asasat Aur Ahmiyat
              ABCD pattern ko pehchanna kisi bhi forex trader ke liye zaroori hai. Ye pattern market mein trend reversal ya trend continuation ka indication deta hai. Iski pehchan karna asan hota hai, lekin isay sahi taur par samajhna aur istemal karna tajurba aur practice ki zaroorat hai.
              1. ABCD Pattern Ka Tareeqa-e-Kaar: Kitni Asani Se Samajhaya Ja Sakta Hai
              ABCD pattern ka tareeqa-e-kaar asan hai. Ye pattern 4 key points par mabni hota hai: A, B, C, aur D. A se B tak ek impulsive move hota hai, phir B se C tak retracement hota hai, C se D tak phir se impulsive move hota hai, jo ke pehle wale move ki lambai ya choti hoti hai.
              1. A, B, C, D: ABCD Pattern Ki Bunyadi Soorat
              ABCD pattern ki bunyadi soorat chaar points par mabni hoti hai. A point ek starting point hota hai, jahan se price move shuru hoti hai. B point ek high ya low hota hai jo A point ke baad aata hai. C point B point se ek retracement hota hai, aur D point C point ke baad aata hai jo ek extension hota hai.
              1. ABCD Pattern Ki Pechan: Har Soorat Mein Mukhtalif Hota Hai
              ABCD pattern ki pehchan karna asan hai lekin har situation mein mukhtalif hota hai. Market ki volatility, trend direction aur time frame ke hisab se iski pehchan mein farq hota hai. Isliye traders ko market ko achhi tarah se analyze karna aur multiple time frames par ABCD pattern ko dhoondhna chahiye.
              1. Fibonacci Retracement Aur ABCD Pattern: Kya Taalluq Hai?
              ABCD pattern ke sath Fibonacci retracement ka taalluq gehra hota hai. Fibonacci retracement levels ABCD pattern ke points ko confirm aur validate karte hain. Traders retracement levels ko istemal karke ABCD pattern ko identify aur confirm kar sakte hain.
              1. ABCD Pattern Ka Ikhlaqi Tareeqa: Adalat Aur Aitemadi
              ABCD pattern ka istemal karne ka ikhlaqi tareeqa adalat aur aitemadi par mabni hota hai. Is pattern ko sahi tareeqay se istemal karke traders apni trading strategy ko improve kar sakte hain aur market mein aitemad hasil kar sakte hain.
              1. ABCD Pattern Ko Istemal Karne Ke Fawaid: Trading Mein Asani
              ABCD pattern ko istemal karne ke fawaid trading mein asani la sakta hai. Ye pattern traders ko price movements ko samajhne mein madad karta hai aur unhe trading opportunities provide karta hai. Is pattern ke sahi tareeqay se istemal karne se traders apni trades ko improve kar sakte hain aur nuqsaan se bach sakte hain.
              1. ABCD Pattern Ki Tajarbaati Misalein: Kaamyaab Tijarat Ka Raaz
              ABCD pattern ki tajarbaati misalein dikhate hain ke is pattern ka istemal karke kaamyaab tijarat kiya ja sakta hai. Jab traders ABCD pattern ko sahi tareeqay se istemal karte hain aur market ke trends ko samajhte hain, to unhe kamyaabi hasil hoti hai aur wo profitable trades kar sakte hain.
              1. ABCD Pattern Ka Istemal: Nigrani Ke Zariye Aamadni Mein Izafa
              ABCD pattern ka istemal karke traders apni trading ko nigrani mein rakh sakte hain aur aamadni mein izafa kar sakte hain. Is pattern ko samajhne aur istemal karne se traders market ke trends ko behtar taur par samajh sakte hain aur unhe trading opportunities nazar aati hain.
              1. ABCD Pattern Aur Risk Management: Asasat Ki Hifazat
              ABCD pattern ka istemal karke traders apni risk management ko behtar taur par samajh sakte hain. Is pattern ki madad se traders apne stop loss aur take profit levels ko sahi tareeqay se set kar sakte hain aur apni trades ko control mein rakh sakte hain.
              1. ABCD Pattern Ki Mehfooz Tijarat: Nuqsaan Se Bachne Ka Zariya
              ABCD pattern ki sahi tareeqay se samajh aur istemal se traders apni tijarat ko mehfooz bana sakte hain aur nuqsaan se bach sakte hain. Is pattern ki madad se traders market ke trends ko samajh sakte hain aur unhe sahi waqt par entry aur exit karne mein madad milti hai.
              1. ABCD Pattern Aur Forex Trade: Taraqqi Ki Raah Mein Ek Ahem Qadam
              ABCD pattern forex trade mein taraqqi ki raah mein ek ahem qadam hai. Is pattern ka sahi tareeqay se istemal karke traders apni trading ko behtar bana sakte hain aur market ke movements ko samajh sakte hain. ABCD pattern ke istemal se traders apni trading skills ko improve kar sakte hain aur tijarat mein kamiyabi hasil kar sakte hain.
              • #8 Collapse


                ABCD pattern Forex trading mein ek popular technical analysis pattern hai jo ke price action aur market trends ke mutalliq maloomati faraham karta hai. Is pattern ko harmonic trading patterns mein shumar kiya jata hai aur traders iska istemal karke potential reversals aur continuation points ko identify karte hain. Is article mein hum ABCD pattern ke tafseelat aur istemal par baat karenge.

                ABCD Pattern: Samajh Aur Tareeqa Amal

                ABCD pattern ek price action pattern hai jo ke market mein ek specific sequence ko represent karta hai. Is pattern mein 4 distinct legs ya segments hote hain: AB leg, BC leg, CD leg, aur AD leg. Har leg ka specific ratio hota hai jo Fibonacci ratios par mabni hota hai.
                1. AB Leg: AB leg ek initial move hota hai jismein price ek direction mein move karta hai.
                2. BC Leg: BC leg AB leg ke opposite direction mein move karta hai. Is leg ka retracement Fibonacci levels par based hota hai.
                3. CD Leg: CD leg ek retracement move hota hai jismein price phir se AB leg ki direction mein move karta hai. Is leg ka length aur retracement Fibonacci levels par mabni hota hai.
                4. AD Leg: AD leg CD leg ki length ke approximately equal hota hai aur ismein price CD leg ki direction mein move karta hai. Is leg ka completion point Fibonacci extension levels par based hota hai.

                ABCD pattern ka tareeqa amal samajhne ke liye traders ko Fibonacci ratios ka istemal karna aana zaroori hai. Fibonacci ratios ki madad se traders har leg ka length aur retracement levels ko calculate kar sakte hain.

                ABCD Pattern Ke Mukaamaat Aur Istemal:

                ABCD pattern ke mukaamaat aur istemal ka mukhtasir tajziya yeh hai:
                1. Reversal Points Ki Tafteesh: ABCD pattern ka istemal karke traders potential reversal points ko tafteesh kar sakte hain. Jab price ABCD pattern ke levels par pohanchta hai, toh yeh ek potential reversal ka signal deta hai.
                2. Entry Aur Exit Points Ka Pata Lagana: ABCD pattern ke istemal se traders entry aur exit points ka pata lagate hain. Jab price CD leg ki completion point tak pohanchta hai, toh traders apne positions ko enter ya exit kar sakte hain.
                3. Stop Loss Aur Target Levels Ka Set Karna: ABCD pattern ke istemal se traders apne stop loss aur target levels ko bhi set kar sakte hain. Fibonacci retracement aur extension levels ki madad se traders apne risk ko manage kar sakte hain aur potential profits ko maximize kar sakte hain.
                4. Confirmation Ke Sath Trading: ABCD pattern ko trading signal ke tor par istemal karne se pehle, traders ko dusri technical analysis aur price action ki confirmation ka intezar karna chahiye. Isse unki trading decisions ko aur bhi mazbooti milti hai.

                ABCD Pattern Ke Nuqsanat Aur Savadhanian:

                ABCD pattern ka istemal karne se pehle traders ko kuch nuqsanat aur savadhanian ka bhi khayal rakhna chahiye:
                1. False Signals: Kabhi kabhi ABCD pattern false signals bhi de sakta hai, is liye traders ko dusri technical analysis aur confirmation ki zaroorat hoti hai.
                2. Market Context: ABCD pattern ko samajhne ke liye market context ka bhi zaroori hai. Agar overall market trend still strong hai, toh ek ABCD pattern ka impact kam ho sakta hai.
                3. Risk Management: ABCD pattern ke sath trading karte waqt, traders ko apne risk management par bhi ghor karna chahiye aur apne positions ko monitor karte rehna chahiye.
                ABCD pattern ek powerful technical analysis tool hai jo ke price action aur market trends ke baray mein maloomati faraham karta hai. Is pattern ka istemal karke traders potential reversal points ko identify kar sakte hain aur apni trading decisions ko mazbooti se le sakte hain. Magar, ABCD pattern ka istemal karne se pehle traders ko market context, risk management aur dusri technical analysis ki bhi zaroorat hoti hai. Samajhdari se ABCD pattern ka istemal karke traders apni trading performance ko behtar bana sakte hain.

                • #9 Collapse

                  ABCD Pattern ek technical analysis ka concept hai jo ke stock market ya forex trading mein istemal hota hai. Ye pattern price movement ko analyze karne ke liye istemal hota hai aur traders ko potential trading opportunities dhoondhne mein madad karta hai. ABCD Pattern ek geometric shape hota hai jo ke price movement ko represent karta hai. Ye typically ek trend reversal pattern hota hai, matlab ke jab ek trend khatam hota hai aur naya trend shuru hota hai, to ye pattern dikhai deta hai.

                  ABCD Pattern mein char main points hote hain:
                  Point A: Ye starting point hota hai jahan se trend shuru hota hai. Agar uptrend hai to ye sabse nichla point hota hai aur agar downtrend hai to ye sabse ooncha point hota hai.
                  Point B: Ye trend ke first retracement ka point hota hai. Agar uptrend hai to ye point upar hota hai aur agar downtrend hai to ye point neeche hota hai.
                  Point C: Ye trend ke second retracement ka point hota hai. Ye point typically Point A aur Point B ke darmiyan hota hai.
                  Point D: Ye last point hota hai jo trend ka completion point hota hai. Ye typically Point A aur Point B ke extension ka level hota hai.
                  ABCD Pattern ke istemal se traders trend reversal points ko identify kar sakte hain aur trading opportunities ko pakar sakte hain. Ye pattern Fibonacci retracement levels ke sath bhi istemal hota hai taake price movements ko aur accurately analyze kiya ja sake.

                  Yeh pattern price charts par dikhai deta hai jab ek trend khatam hone ki sambhavna hoti hai aur naya trend shuru hone wala hota hai. Iske through, traders trend reversal points ko anticipate kar sakte hain aur unhe apni trading strategies ke according trade kar sakte hain.

                  Is pattern ka istemal karke traders trend ki direction aur market ke future movements ko predict kar sakte hain. Isse unhe ek framework milta hai jisse woh price action ko analyze kar sakte hain aur trading decisions ko lenge. Lekin, ABCD Pattern ke saath saath, traders ko technical indicators aur fundamental analysis ka bhi istemal karna zaroori hota hai taake unki trading decisions ko validate kiya ja sake aur risks ko manage kiya ja sake.
                  ABCD Pattern ki kuch properties hain jo ise aur samajhne mein madadgar banaati hain:
                  Symmetry: ABCD Pattern ka ek mukhya gun hai uska symmetry. Yani ke, is pattern mein A se B, phir B se C, aur phir C se D ke beech ka distance approximately barabar hota hai. Ye symmetry traders ko pattern ko detect karne mein aur uski validity ko confirm karne mein madad karta hai.
                  Fibonacci Ratios: ABCD Pattern Fibonacci retracement levels ke sath closely associate hota hai. Is pattern mein price movements ko Fibonacci ratios jaise ki 0.618, 0.786, 1.272, aur 1.618 ke sath relate kiya jata hai. Ye ratios A se B, B se C, aur C se D ke beech ke distances mein paye ja sakte hain.
                  Completion at Point D: ABCD Pattern ka completion point D hota hai, jahan trend reversal ki sambhavna hoti hai. Is point par price action aur volume ki analysis ki jati hai taake confirm kiya ja sake ke pattern pura hua hai ya nahi.
                  Volume Confirmation: ABCD Pattern ki validity aur strength ko confirm karne ke liye volume ka bhi dhyaan diya jata hai. Agar pattern ke completion point par volume increase hoti hai, toh ye pattern ki strength ko aur bhi zyada confirm karta hai.
                  Price Projection: ABCD Pattern ke completion ke baad traders price projection calculate kar sakte hain jisse woh potential target levels aur stop-loss levels identify kar sake.
                  bottom line:
                  In properties ki madad se traders ABCD Pattern ko detect kar sakte hain aur uski validity ko confirm karke trading decisions lenge. Lekin, har ek property ko dhyaan se analyze karna zaroori hai aur multiple indicators ke sath pattern ko validate karna chahiye trading risk ko kam karne ke liye.
                  Is tarah se, ABCD Pattern traders ko market ke movement ko samajhne aur potential trades ko spot karne mein madad karta hai. Lekin, jaise har trading strategy ki tarah, iska bhi istemal karne se pehle thorough research aur risk management ka dhyaan rakhna zaroori hai.ABCD Pattern ka kaam hota hai market mein price movement ko analyze karna aur potential trading opportunities ko identify karna. Is pattern ka istemal traders aur investors market trends ko samajhne aur price action ko interpret karne mein karte hain.
                  • #10 Collapse

                    ABCD Pattern Kya Hai?

                    Forex trading mein, traders aksar mukhtalif chart patterns ko tafteesh karte hain taake woh future ki predictions bana sakein. Ek aham chart pattern jo traders ke liye ahem hai, woh hai ABCD pattern. ABCD pattern ek geometric pattern hai jo price action analysis mein istemal hota hai.

                    ABCD pattern ek symmetrical pattern hai, jise trend reversal ya trend continuation ka indication samjha jata hai. Is pattern mein, price ki movement ko ek sequence of lines se represent kiya jata hai jo specific proportions follow karte hain.

                    ABCD pattern ke char meyare hote hain: A, B, C, aur D. Yeh points market ke swings ya price fluctuations ko darust karte hain.

                    Aur A point se start hota hai jo ek uptrend ya downtrend ki shuruwat ko darust karta hai. Phir B point ek retracement ko darust karta hai, yaani trend mein thori si rukawat ya mudakhlat. C point phir se original trend ki direction mein jaane ka indication deta hai, aur D point end point hota hai, jo ke original trend ki confirmation deta hai.

                    ABC aur D lines ki length aur proportions ko Fibonacci ratios ke mutabiq tay kya jata hai. Ye Fibonacci ratios 0.618 aur 1.618 ka istemal karte hain, jo ke price retracement aur extension levels ko darust karte hain.

                    ABC pattern ka samajhna traders ke liye ahem hai, kyunki is se woh market ke trends ko samajh sakte hain aur future ki price movements ka andaza laga sakte hain. Is tareeqe se, ABCD pattern trading strategies ko improve karne mein madadgar hota hai.

                    Lekin, ABCD pattern ke istemal mein ghalatiyan bhi hoti hain. Kuch baar ye pattern clear nahi hota, ya phir false signals deta hai jo traders ko confuse kar deta hai. Isliye, is pattern ko samajhne ke liye traders ko sahi tafteesh aur training hasil karni chahiye.

                    Aakhri kahani mein, ABCD pattern forex trading mein ek ahem tool hai jo traders ko price action analysis mein madad deta hai. Lekin, isko samajhne ke liye practice aur experience zaroori hai. Is tareeqe se, traders ko ABCD pattern ko istemal karne se pehle mukhtalif factors ka tawajju dena chahiye aur sahi tafteesh karni chahiye taake woh sahi trading decisions le sakein.
                    • #11 Collapse


                      "ABCD Pattern: Trading Strategy and Analysis"

                      Forex aur stock market mein trading karne walay traders ke liye chart patterns ek ahem hissa hote hain jo unhe market trends aur reversals ko samajhne mein madad karte hain. Ek aham aur popular chart pattern jo traders ke liye useful ho sakta hai, woh hai "ABCD Pattern".
                      ABCD Pattern Ki Pehchan


                      ABCD pattern ek harmonic trading pattern hai jo market mein price movements ko capture karta hai. Yeh pattern typically trend reversal ya trend continuation ke indications deta hai. Is pattern ko pehchanne ke liye kuch mukhtalif factors ko mad e nazar rakha jata hai:
                      1. Structure: ABCD pattern mein char main points hote hain: Point A, Point B, Point C, aur Point D. Yeh points Fibonacci retracement levels ke saath correlated hote hain.
                      2. Ratio: Har point ki positions ko Fibonacci ratios ke saath relate kiya jata hai. Commonly istemal kiye jane wale ratios 0.618 aur 0.786 hote hain.
                      3. Validation: ABCD pattern ki validity ko confirm karne ke liye traders ko price action aur other technical indicators ka bhi istemal karna hota hai.
                      ABCD Pattern ka Tareeqa-e-Istemaal


                      ABCD pattern ko samajh kar traders mukhtalif trading strategies tay kar sakte hain:
                      1. Reversal Trading: ABCD pattern ko dekhte hue traders market ke reversal ke liye tayyari kar sakte hain. Agar pattern complete hone ke baad price reversal ka signal milta hai, toh traders apne positions ko adjust kar sakte hain.
                      2. Trend Continuation: Kabhi kabhi ABCD pattern trend continuation ke liye bhi useful ho sakta hai. Agar pattern ke completion ke baad price trend ke direction mein move karta hai, toh traders apne existing trend ke saath chal sakte hain.
                      3. Entry aur Exit Points: ABCD pattern ko dekhte hue traders apne entry aur exit points ko tay kar sakte hain. Agar pattern complete hone ke baad price reversal ka indication milta hai, toh traders apne positions ko enter ya exit kar sakte hain.
                      ABCD Pattern ka Risks aur Challenges


                      ABCD pattern ka istemaal karte waqt kuch challenges aur risks hote hain:
                      1. False Signals: Jaise ke har trading pattern ki tarah, ABCD pattern bhi false signals de sakta hai. Isliye traders ko confirmatory signals ka intezar karna zaroori hota hai.
                      2. Complexity: ABCD pattern ko samajhne aur identify karna kuch complex ho sakta hai, especially beginners ke liye. Isliye thorough research aur practice ki zaroorat hoti hai.
                      3. Market Context: ABCD pattern ko samajhne ke liye market context ko bhi mad e nazar rakha jana zaroori hai. Kisi bhi single pattern par rely karna risky ho sakta hai agar market context ko ignore kiya jaye.
                      ABCD Pattern aur Technical Analysis


                      ABCD pattern ko samajhne aur istemal karne ke liye technical analysis ka sahi tajziya zaroori hota hai. Technical indicators aur price action analysis ke saath ABCD pattern ko combine karke traders sahi trading decisions le sakte hain.
                      1. Fibonacci Levels: ABCD pattern ke points Fibonacci retracement levels ke saath correlate hote hain, isliye Fibonacci analysis ka istemal ABCD pattern ko samajhne mein madadgar ho sakta hai.
                      2. Price Action Analysis: ABCD pattern ko identify karne ke liye price action analysis bhi important hai. Traders ko market ki movements ko observe karke pattern ki confirmation ke liye price action analysis karna chahiye.


                      ABCD pattern ek important aur effective trading pattern hai jo traders ko market ke trends aur reversals ko samajhne mein madad karta hai. Is pattern ko samajhne aur istemal karne ke liye traders ko technical analysis aur price action ki samajh zaroori hoti hai. ABCD pattern ka sahi istemaal karke traders apne trading strategies ko improve kar sakte hain aur market ke mukhtalif movements ko sahi tareeqay se samajh sakte hain. Magar yaad rahe ke har trading pattern ki tarah, ABCD pattern ka bhi istemaal karne se pehle thorough research aur risk management ka intezar zaroori hai.


                      • #12 Collapse


                        ABCD PATTERN: Ek Taqatwar Technical Tool

                        Forex, stocks, commodities, cryptocurrencies – har ek market mein traders ki zindagi mein technical analysis ka ek ahem hissa hota hai. Yeh analysis unhe market trends aur potential trading opportunities ke bare mein maloomat faraham karta hai. Ek aham tool jo traders ke liye kaam ka hota hai wo hai ABCD pattern. Ye pattern traders ko market mein price action ka insight deta hai aur unhe potential price reversals aur trend changes ke bare mein agah karta hai. Is article mein, hum ABCD pattern ke bare mein mazeed maloomat aur uske istemal ki wajahat ko samjhenge.
                        ABCD Pattern: Pehchan aur Tareeqa Kar


                        ABCD pattern ek price action pattern hai jo market mein trend reversals ko identify karne ke liye istemal hota hai. Ye pattern Fibonacci retracement aur extension levels ke sath juda hota hai. Is pattern ka naam is liye ABCD rakha gaya hai kyun ke ye char points ko represent karta hai: A, B, C, aur D.
                        1. Point A (Start Point): Ye point trend ki shuruaat ko darust karta hai. Jab ek uptrend ya downtrend shuru hoti hai, tab ye point tay hota hai.
                        2. Point B (Retracement): Ye point trend mein ek retracement ya reversal ko darust karta hai. Agar trend up hai, to Point B down movement ko represent karta hai, aur agar trend down hai, to Point B up movement ko darust karta hai.
                        3. Point C (Extension): Ye point trend ka extension ya reversal ka indication hota hai. Agar trend up hai, to Point C higher high ko darust karta hai, aur agar trend down hai, to Point C lower low ko represent karta hai.
                        4. Point D (Completion): Ye point pattern ka completion point hota hai. Yahan trend ki expectations confirm hoti hain. Agar pattern bullish hai, to Point D higher low ya higher high ko darust karta hai, aur agar pattern bearish hai, to Point D lower high ya lower low ko represent karta hai.
                        ABCD Pattern Ki Tafseelat


                        ABCD pattern ki tafseelat samajhne ke liye, Fibonacci retracement aur extension levels ka istemal hota hai. Ye levels traders ko support aur resistance zones ke taur par madad faraham karte hain.
                        1. Fibonacci Retracement Levels: Fibonacci retracement levels 23.6%, 38.2%, 50%, 61.8%, aur 78.6% hote hain. In levels ka istemal trend ke retracement levels ko identify karne ke liye hota hai. Agar price ek uptrend mein hai, to retracement levels neeche se upar ki taraf jane wale points hote hain aur agar price ek downtrend mein hai, to retracement levels upar se neeche ki taraf jane wale points hote hain.
                        2. Fibonacci Extension Levels: Fibonacci extension levels 127.2%, 161.8%, aur 261.8% hote hain. In levels ka istemal trend ke extension levels ko identify karne ke liye hota hai. Ye levels trend ke direction mein hone wale potential movements ko darust karte hain.
                        ABCD Pattern Ka Istemal


                        ABCD pattern ka istemal karne ke liye, traders ko market charts ko closely observe karna hota hai. Agar ek ABCD pattern market mein develop hota hai, to traders ko entry aur exit points ko tay karne mein madad milti hai.
                        Bullish ABCD Pattern


                        Bullish ABCD pattern mein, trend up hota hai aur Point A se Point B tak price upar ki taraf move karta hai. Phir Point B se Point C tak price down jaata hai, lekin retracement levels ke saath mazeed up move hoti hai. Point C se Point D tak price phir se upar move karta hai, aur pattern complete hota hai.
                        Bearish ABCD Pattern


                        Bearish ABCD pattern mein, trend down hota hai aur Point A se Point B tak price neeche ki taraf move karta hai. Phir Point B se Point C tak price upar jaata hai, lekin retracement levels ke saath mazeed down move hoti hai. Point C se Point D tak price phir se neeche move karta hai, aur pattern complete hota hai.
                        ABCD Pattern Ke Fayde aur Nuksan


                        ABCD pattern ka istemal karne ke kai fayde aur nuksan hote hain.
                        Fayde:
                        1. Price Action Analysis: ABCD pattern traders ko price action ka acchi tarah se analysis karne mein madad karta hai.
                        2. Entry aur Exit Points: Pattern ke completion point par entry aur exit points ko identify karne mein madad milti hai.
                        3. Risk Management: Pattern ke use se traders apni risk management ko improve kar sakte hain.
                        Nuksan:
                        1. False Signals: Kabhi kabhi ABCD pattern false signals bhi generate kar sakta hai, jiski wajah se traders nuksan utha sakte hain.
                        2. Complexity: Pattern ki complexity ki wajah se beginners ko ise samajhne mein mushkil ho sakti hai.
                        ABCD Pattern Ke Sath Trading Strategies


                        ABCD pattern ke sath trading karne ke liye, kuch strategies hain jo traders istemal karte hain:
                        1. Fibonacci Retracement aur Extension Levels ka Istemal: Fibonacci levels ko ABCD pattern ke sath combine karke trading strategies banai ja sakti hain.
                        2. Divergence Analysis: ABCD pattern ke sath divergence analysis karke traders market mein potential reversals ko identify kar sakte hain.
                        3. Risk Management: Har trade mein risk management ka istemal karna zaroori hai, taake traders apne losses ko minimize kar sakein.
                        Mukhtalif Market Mein ABCD Pattern


                        ABCD pattern har market mein istemal kiya ja sakta hai, including Forex, stocks, commodities, aur cryptocurrencies. Is pattern ki versatility ki wajah se, traders ise alag alag markets mein istemal kar sakte hain.

                        ABCD pattern ek powerful technical tool hai jo traders ko market trends aur potential reversals ke bare mein maloomat faraham karta hai. Is pattern ka istemal karke, traders apni trading strategies ko improve kar sakte hain aur market mein successful trading kar sakte hain. Magar yaad rahe ke har trading decision ke liye thorough research aur analysis zaroori hai.

                        Is liye, jab tak traders ABCD pattern ko samajhne aur istemal karne mein comfortable nahi ho jaate, wo


                        • #13 Collapse

                          Forex Trading Mein ABCD Pattern Kya Hai?

                          The ABCD pattern is a popular technical analysis tool used by Forex traders to identify potential trend reversals or continuations in the market. It is based on the concept of Fibonacci ratios and consists of four key points: A, B, C, and D. Traders use this pattern to anticipate price movements and make informed trading decisions.

                          1. ABCD Pattern Ki Tareef

                          The ABCD pattern is a geometric formation that appears on price charts. It is composed of four consecutive price swings that form specific geometric shapes resembling the letters A, B, C, and D. This pattern is significant because it represents a potential trend reversal or continuation, providing traders with opportunities to enter or exit trades profitably.

                          2. ABCD Pattern Ka Structure

                          The structure of the ABCD pattern is crucial for traders to understand. It consists of four key points:
                          • A Point: The starting point of the pattern, marking the beginning of a trend.
                          • B Point: The first correction point after the trend begins, indicating a potential retracement.
                          • C Point: The second correction point, confirming the continuation or reversal of the trend.
                          • D Point: The completion point of the pattern, where traders look for potential entry or exit signals.

                          Understanding the structure of the ABCD pattern helps traders identify and interpret price movements accurately.

                          3. A Point

                          The A point is the initial point of the ABCD pattern and marks the beginning of a trend. In an uptrend, it represents the lowest point, while in a downtrend, it represents the highest point. Traders look for clear signs of trend initiation at the A point, such as a significant price move or a breakout from a consolidation phase.

                          4. B Point

                          The B point occurs after the A point and represents the first correction in the trend. It is typically a retracement from the initial move, indicating a temporary pause or reversal in the trend direction. Traders pay close attention to the B point to assess the strength of the trend and determine potential entry points for trades.

                          5. C Point

                          The C point is the second correction in the ABCD pattern and confirms the continuation or reversal of the trend. It often forms near key Fibonacci retracement levels, such as 0.618 or 0.786, providing traders with additional confirmation of trend direction. Identifying the C point accurately is essential for making informed trading decisions.

                          6. D Point

                          The D point is the completion point of the ABCD pattern and represents the potential reversal or continuation of the trend. It is calculated based on Fibonacci extensions from the A to B and C points, indicating possible price targets for the next move. Traders use the D point to set profit targets or initiate new trades based on the pattern's completion.

                          7. ABCD Pattern Ki Recognition

                          Recognizing ABCD patterns requires a combination of technical analysis skills and pattern recognition abilities. Traders scan price charts for formations that resemble the distinctive shape of the ABCD pattern and confirm their validity through additional analysis. Various tools and indicators, such as Fibonacci retracements, trendlines, and oscillators, can help traders identify and validate ABCD patterns effectively.

                          8. ABCD Pattern Ki Importance

                          The ABCD pattern is essential for Forex traders as it provides valuable insights into market trends and potential price movements. By recognizing and interpreting ABCD patterns correctly, traders can anticipate trend reversals or continuations with greater accuracy, leading to profitable trading opportunities. Incorporating the ABCD pattern into trading strategies enhances traders' ability to make informed decisions and achieve consistent results in the Forex market.

                          9. ABCD Pattern Ke Variations

                          While the basic ABCD pattern remains the same, variations may occur based on market conditions and price dynamics. Bullish and bearish variations of the ABCD pattern represent different trend directions and trading opportunities. Bullish ABCD patterns indicate potential uptrends, while bearish ABCD patterns suggest possible downtrends. Traders must learn to identify and interpret these variations to adapt their strategies accordingly and capitalize on market opportunities effectively.

                          10. ABCD Pattern Ka Istemal

                          Traders utilize the ABCD pattern in various ways to enhance their trading strategies and improve their performance in the Forex market. Some common uses of the ABCD pattern include:
                          • Identifying trend reversals: Traders look for completed ABCD patterns to signal potential trend reversals and adjust their positions accordingly.
                          • Setting profit targets: Traders use the D point of the ABCD pattern to set profit targets for their trades, based on Fibonacci extensions and other technical factors.
                          • Confirming trade entries: Traders wait for confirmation from the ABCD pattern before entering trades, ensuring that the trend is likely to continue in their favor.
                          • Managing risk: Traders incorporate ABCD patterns into their risk management strategies, placing stop-loss orders and managing position sizes based on the pattern's structure and validity.

                          By integrating the ABCD pattern into their trading approaches, traders can improve their decision-making processes and achieve better results over time.

                          11. ABCD Pattern Ke Benefits

                          The ABCD pattern offers several benefits to Forex traders, including:
                          • Enhanced market analysis: The ABCD pattern provides traders with a systematic approach to analyzing market trends and identifying potential trading opportunities.
                          • Improved trade timing: By waiting for confirmation from the ABCD pattern, traders can enter trades at optimal points, reducing the risk of premature entries or false signals.
                          • Better risk management: Traders can use the ABCD pattern to set appropriate stop-loss levels and manage their risk exposure effectively, minimizing potential losses in adverse market conditions.
                          • Increased profitability: Incorporating the ABCD pattern into trading strategies can lead to more profitable trades over time, as traders capitalize on high-probability setups and minimize unnecessary risks.

                          Overall, the ABCD pattern serves as a valuable tool for Forex traders, helping them navigate the complexities of the market and achieve their trading goals with greater consistency and success.

                          12. ABCD Pattern Ka Risk

                          While the ABCD pattern offers numerous benefits, it also comes with inherent risks that traders must be aware of and manage effectively. Some common risks associated with trading the ABCD pattern include:
                          • False signals: Like any technical analysis tool, the ABCD pattern is not foolproof and may produce false signals from time to time. Traders must exercise caution and verify pattern validity through additional analysis before taking action.
                          • Market volatility: The Forex market is inherently volatile, and price movements can be unpredictable at times. Traders should be prepared for unexpected market fluctuations and adjust their trading strategies accordingly to minimize potential losses.
                          • Overreliance on patterns: Relying too heavily on the ABCD pattern without considering other factors such as market fundamentals or sentiment can lead to suboptimal trading decisions. Traders should use the ABCD pattern as part of a comprehensive trading strategy and incorporate multiple sources of analysis for better results.

                          By acknowledging and addressing these risks, traders can mitigate potential drawbacks associated with trading the ABCD pattern and improve their overall performance in the Forex market.

                          13. ABCD Pattern Ka Backtesting

                          Backtesting is an essential step in validating trading strategies, including those based on the ABCD pattern. By testing historical data against predefined trading rules, traders can assess the effectiveness and reliability of their strategies and make necessary adjustments before applying them in live trading environments. When backtesting ABCD patterns, traders should consider the following factors:
                          • Data selection: Traders should use high-quality historical data that accurately reflects market conditions and price movements.
                          • Strategy development: Traders need to define clear entry and exit rules based on the ABCD pattern and test different variations to identify the most profitable approach.
                          • Performance evaluation: Traders should analyze the results of backtesting to assess the profitability, drawdowns, and other key performance metrics of their ABCD pattern-based strategies.
                          • Optimization: Traders can fine-tune their strategies by optimizing parameters such as stop-loss levels, profit targets, and position sizing to improve overall performance and reduce risk.

                          By conducting thorough backtesting, traders can gain confidence in their ABCD pattern-based strategies and make more informed decisions in live trading situations.

                          14. Conclusion

                          The ABCD pattern is a powerful tool for Forex traders, offering valuable insights into market trends and potential price movements. By understanding its structure, recognizing its variations, and integrating it into their trading strategies, traders can enhance their decision-making processes and achieve greater success in the Forex market. While the ABCD pattern comes with inherent risks, proper risk management and backtesting can help traders mitigate potential drawbacks and capitalize on profitable trading opportunities. Overall, the ABCD pattern serves as a cornerstone of technical analysis in Forex trading, providing traders with a systematic approach to analyzing market dynamics and making informed trading decisions.
                          • #14 Collapse


                            ABCD pattern ek popular harmonic trading pattern hai jo market mein price action ka analysis karne mein istemal hota hai. Yeh pattern Fibonacci retracement aur extension levels ke saath associate hota hai aur traders ko market mein potential reversal points aur trend continuation points identify karne mein madad karta hai. Chaliye dekhte hain ke ABCD pattern kya hota hai aur ise kaise trade kiya ja sakta hai:
                            Click image for larger version

Name:	download (52).png
Views:	74
Size:	4.4 کلوبائٹ
ID:	12895977

                            ABCD Pattern ki Bunyadi Tafseel:


                            ABCD pattern ek specific price structure hai jo market mein form hota hai. Is pattern mein char key points hote hain, jo A, B, C, aur D ke naam se jaane jate hain.
                            1. Point A (Starting Point): Point A ek trend ke starting point ko darshata hai. Yeh typically ek significant high ya low point hota hai, jahan se trend shuru hota hai.
                            2. Point B (Pullback): Point B ek retracement level ko represent karta hai, jahan trend temporarily reverse hota hai. Yeh ek correction period hota hai jismein price opposite direction mein move karta hai, lekin overall trend ko follow karta hai.
                            3. Point C (Resumption of Trend): Point C mein trend ki original direction mein move resume hota hai. Yeh ek pivot point hota hai jahan se trend wapas apni original direction mein move karta hai.
                            4. Point D (Completion Point): Point D ek extension level ko indicate karta hai, jahan trend apni original direction mein extend hota hai. Yeh point B aur C ke Fibonacci extension levels ke beech mein hota hai.
                            ABCD Pattern ka Trade Kaise Kiya Jata Hai:
                            1. Pattern Recognition: Sabse pehle traders ko ABCD pattern ko recognize karna hota hai. Iske liye price chart par trend ke starting point (A) aur uske baad ke retracement (B), resumption (C), aur completion (D) points ko dhyan se dekha jata hai.
                            2. Fibonacci Levels ka Istemal: ABCD pattern ke trade karne ke liye Fibonacci retracement aur extension levels ka istemal kiya jata hai. Point B aur Point C ke beech mein Fibonacci retracement levels ko draw kiya jata hai, jabki Point D ko Fibonacci extension levels ke saath match kiya jata hai.
                            3. Entry, Stop-loss, aur Target Levels: Entry point typically Point C ke paas ya uske thodi upar ya niche set kiya jata hai, jismein traders ko trend ki resumption ke confirmatory signals ka wait karna hota hai. Stop-loss orders Point C ke just opposite side par set kiya jata hai, jabki target levels Point D ke Fibonacci extension levels ke around set kiya jata hai.
                            ABCD Pattern ke Fawaid:
                            • Trend Reversals aur Continuations: ABCD pattern ke istemal se traders trend reversals aur continuations ko identify kar sakte hain, jo unhe trading opportunities provide karta hai.
                            • Clear Entry aur Exit Points: Is pattern mein clear entry aur exit points hote hain, jo traders ko trading decisions lene mein madad karta hai.
                            • Fibonacci Levels ke Saath Sambandh: ABCD pattern Fibonacci levels ke saath closely related hota hai, jo price movements ko aur accurate banata hai.
                            ABCD Pattern ke Nuksan:
                            • False Signals: Jaise ki har trading pattern mein hota hai, ABCD pattern bhi false signals generate kar sakta hai, isliye traders ko confirmatory signals aur risk management ka istemal karna chahiye.
                            • Complexity: ABCD pattern ka identify karna aur uska istemal karna beginners ke liye thoda challenging ho sakta hai, kyun ki ismein Fibonacci levels aur price structure ka detailed understanding ki zaroorat hoti hai.

                            ABCD pattern ek powerful trading tool hai jo traders ko market mein potential reversals aur continuations ko identify karne mein madad karta hai. Lekin, iske saath sahi risk management aur confirmatory signals ka istemal karna zaroori hai, taki false signals se bacha ja sake aur trading performance improve kiya ja sake.

                            • <a href="https://www.instaforex.org/ru/?x=ruforum">InstaForex</a>
                            • #15 Collapse


                              ABCD pattern ek prakar ka harmonic trading pattern hai jo market mein price action ka analysis karne mein istemal hota hai. Yeh pattern trend reversal aur trend continuation points ko identify karne mein madad karta hai. ABCD pattern Fibonacci retracement aur extension levels ke saath associate hota hai.


                              ABCD Pattern ki Bunyadi Tafseel:
                              1. Point A (Starting Point): ABCD pattern ka shuruaati point A hota hai, jo ki trend ka starting point hota hai. Yeh typically ek significant high ya low point hota hai.
                              2. Point B (Pullback): Point B ek retracement level ko represent karta hai, jahan trend temporarily reverse hota hai. Yeh ek correction period hota hai jismein price opposite direction mein move karta hai, lekin overall trend ko follow karta hai.
                              3. Point C (Resumption of Trend): Point C mein trend ki original direction mein move resume hota hai. Yeh ek pivot point hota hai jahan se trend wapas apni original direction mein move karta hai.
                              4. Point D (Completion Point): Point D ek extension level ko indicate karta hai, jahan trend apni original direction mein extend hota hai. Yeh point B aur C ke Fibonacci extension levels ke beech mein hota hai.
                              ABCD Pattern ka Trade Kaise Kiya Jata Hai:
                              1. Pattern Recognition: Sabse pehle traders ko ABCD pattern ko recognize karna hota hai. Iske liye price chart par trend ke starting point (A) aur uske baad ke retracement (B), resumption (C), aur completion (D) points ko dhyan se dekha jata hai.
                              2. Fibonacci Levels ka Istemal: ABCD pattern ke trade karne ke liye Fibonacci retracement aur extension levels ka istemal kiya jata hai. Point B aur Point C ke beech mein Fibonacci retracement levels ko draw kiya jata hai, jabki Point D ko Fibonacci extension levels ke saath match kiya jata hai.
                              3. Entry, Stop-loss, aur Target Levels: Entry point typically Point C ke paas ya uske thodi upar ya niche set kiya jata hai, jismein traders ko trend ki resumption ke confirmatory signals ka wait karna hota hai. Stop-loss orders Point C ke just opposite side par set kiya jata hai, jabki target levels Point D ke Fibonacci extension levels ke around set kiya jata hai.
                              4. Risk Management: Har trade mein risk management techniques ka istemal karna zaroori hai. ABCD pattern ko trade karte waqt, traders apne risk ko manage karne ke liye stop-loss orders ka istemal karte hain.
                              ABCD Pattern ke Fawaid:
                              • Trend Reversals aur Continuations: ABCD pattern ke istemal se traders trend reversals aur continuations ko identify kar sakte hain, jo unhe trading opportunities provide karta hai.
                              • Clear Entry aur Exit Points: Is pattern mein clear entry aur exit points hote hain, jo traders ko trading decisions lene mein madad karta hai.
                              • Fibonacci Levels ke Saath Sambandh: ABCD pattern Fibonacci levels ke saath closely related hota hai, jo price movements ko aur accurate banata hai.

                              ABC pattern ek powerful trading tool hai jo traders ko market mein potential reversals aur continuations ko identify karne mein madad karta hai. Lekin, iske saath sahi risk management aur confirmatory signals ka istemal karna zaroori hai, taki false signals se bacha ja sake aur trading performance improve kiya ja sake.


                              اب آن لائن

                              Working...
                              X