WHAT IS THE ABCD PATTERN DEFINITION
In fact best traders Mein all Ne yah learned liya hai ki Kis tarah kiss karna hai isase straight forward and simple rakhne ke liye isase pahle Keval trading game mein truly success Ho but Kaun Kahta Hai Ki trader effective formulas use nahin kar sakte Agar inke computer inke liye sim ke behind most work Karte Hain Yahan Tak ke jab har new price ki movement ke sath thousand ya hundred of thousand calculation hote hain signals right tool and know how ke sath trader ke liye ABC Ki Tarah easy Hote Hain trading ko complicate Nahin Hona chahie chart per appearing Hone Wali Line ki number greater Hogi level utani hi significant Hogi movement ka observing literally 1000 hour spend spending ke bad especially confluence ki level per Novaks Mein regular price ko configuration ko notice karna Began Kar Diya
MAKE MONEY WITH THE FIBONACCI ABC PATTERN
Understand Hon most problems Ek good sign hai problem indicate Karte Hain ke progress ho rahi hai wheels turning ho rahe hain and aap apne Goal ki taraf moving ho rahe hain Jab aapko koi problem Na Ho To beware Rahe FIR aapko really ek problem got hai problem progress ke Landmark Ki Tarah Hote Hain -scot Alexander Fibonacci level ko manually creating karna two problem present karta hai first Fibonacci line ki series Ke zariya created ki gai hai Jo har significant turn ya Pivot point par drawn Ja sakti hai: stock ke few times Zigged and Zagged hone ke bad ke resulting mein pivot points level ki ek cacophony create Karte Hain Jo chart ko unreadable Render sake
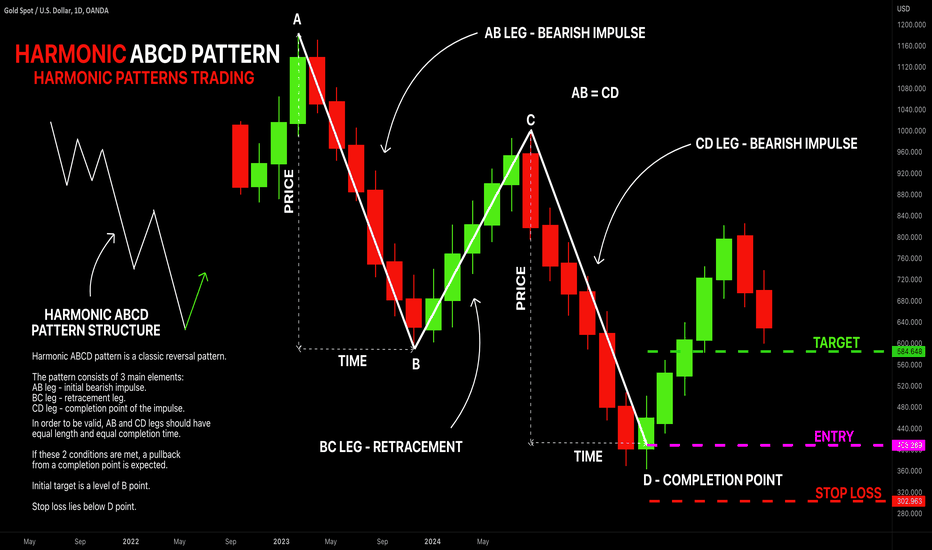
WHAT IS THE ABCD PATTERN
ABCD pattern 1 Diagonal lightning ke bolt Ki Tarah look jata hai and uncoming trading opportunity indicate karta hai yah Janna ke liye ek valuable pattern hai Kyunki yah Rhythmic Kya style reflect ki ka Karta Hai jinmen market often moves Karti Hain essential yah chart per four significant highs and low par mushtamil hai A Main Ek new prevailing trend form Hota Hai market B retrace hoti hai initial Trend C per resume Hota Hai aap next correction D per trade kar sakte hain
تبصرہ
Расширенный режим Обычный режим