Harmonic price chart patterns

No announcement yet.
`
X
  • وقت
  • دکھائیں
Clear All
new posts
  • #16 Collapse

    Forex Mein Harmonic Price Chart Patterns+=+=+

    Forex mein harmonic price chart patterns trading mein ek important tool hote hain. Ye patterns traders ko market ke direction aur potential reversals ke baray mein signals dete hain. Ye patterns Fibonacci retracement aur extension levels ke based hote hain.
    Harmonic Price Chart Patterns ka use primarily price reversals aur trend changes ko identify karne mein hota hai. Ye patterns market mein geometry aur Fibonacci ratios ko follow karte hain, jinhe traders aur investors Fibonacci retracement aur extension levels ke through calculate karte hain.
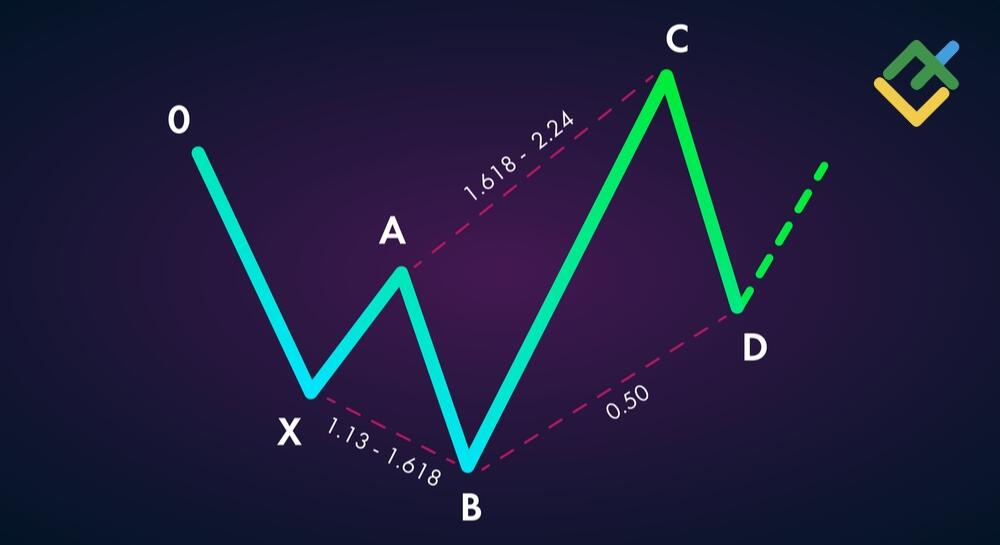


    Forex Mein Harmonic Price Chart Ke Common Patterns +=+=+

    Kuch common harmonic price chart patterns hain:
    1. ABCD Pattern: Ye pattern market mein trend change hone ka signal deta hai. Isme four legs hote hain: AB, BC, CD. CD leg usually AB leg ke opposite direction mein move karta hai.
    2. Gartley Pattern: Ye pattern bhi trend reversal ka signal deta hai. Isme four legs hote hain: XA, AB, BC, CD. Gartley pattern Fibonacci levels ko follow karta hai.
    3. Butterfly Pattern: Ye pattern bhi trend reversal ko indicate karta hai. Isme five legs hote hain: XA, AB, BC, CD, XD. Butterfly pattern mein BC leg AB leg ki extension hoti hai aur CD leg AB leg ki retracement hoti hai.
    4. Bat Pattern: Ye pattern bhi Fibonacci levels par based hota hai. Isme four legs hote hain: XA, AB, BC, CD. Bat pattern mein CD leg usually AB leg ki retracement hoti hai.
    5. Cypher Pattern: Ye pattern bhi Fibonacci levels ko follow karta hai. Isme five legs hote hain: XA, AB, BC, CD, XD. Cypher pattern mein CD leg usually XA leg ke 0.786 level tak move karta hai.

    In patterns ko samajh kar aur unki confirmation ke liye technical analysis tools ka istemal karke traders market mein entry aur exit points ka faisla karte hain. Harmonic price chart patterns ki sahi tarah se samajh aur istemal karne se traders ko trading mein faida hota hai.
    • <a href="https://www.instaforex.org/ru/?x=ruforum">InstaForex</a>
    • #17 Collapse

      **Harmonic Price Chart Patterns: Detailed Analysis Aur Trading Strategies**
      **Harmonic Price Chart Patterns** ek advanced technical analysis tool hain jo price movements ko predict karne aur market trends ko identify karne mein madad karte hain. Yeh patterns mathematical ratios aur geometric shapes par base hote hain, jo price action aur market psychology ko reflect karte hain. Is post mein, hum harmonic price chart patterns ke key types, characteristics, aur unki trading strategies ko discuss karenge.

      ### Harmonic Price Chart Patterns Kya Hain?

      **Harmonic Price Chart Patterns** aise chart patterns hain jo specific geometric shapes aur Fibonacci ratios ko follow karte hain. Yeh patterns market ke potential reversals aur continuations ko identify karte hain. Harmonic patterns price action ko precise points aur ratios ke zariye analyze karte hain, jisse traders ko accurate trading signals milte hain.

      ### Key Harmonic Patterns

      1. **Gartley Pattern:**
      - **Description:** Gartley pattern ek bullish ya bearish pattern hota hai jo price action ke four legs ko represent karta hai. Yeh pattern H5 (XABCD) structure ko follow karta hai aur Fibonacci ratios ke basis par trade signals provide karta hai.
      - **Characteristics:** Gartley pattern mein X se A, A se B, B se C, aur C se D ke points define kiye jate hain. D point par price reversal ya continuation ka signal milta hai.

      2. **Bat Pattern:**
      - **Description:** Bat pattern bhi ek harmonic pattern hai jo price action ke four legs ko represent karta hai aur Fibonacci ratios ke zariye trade signals ko define karta hai.
      - **Characteristics:** Bat pattern mein X se A, A se B, B se C, aur C se D ke points hote hain. Is pattern ka D point price reversal ke liye potential level hota hai.

      3. **Butterfly Pattern:**
      - **Description:** Butterfly pattern ek complex harmonic pattern hai jo market ke extreme points ko capture karta hai. Yeh pattern price action ke specific legs aur Fibonacci ratios ko follow karta hai.
      - **Characteristics:** Butterfly pattern X se A, A se B, B se C, aur C se D ke points ko define karta hai. Is pattern ka D point market ke strong reversal point ko indicate karta hai.

      4. **Crab Pattern:**
      - **Description:** Crab pattern ek extreme harmonic pattern hai jo price action ke precise ratios aur levels ko follow karta hai. Yeh pattern market ke overbought aur oversold conditions ko reflect karta hai.
      - **Characteristics:** Crab pattern mein X se A, A se B, B se C, aur C se D ke points hote hain. D point par price reversal ya continuation ka strong signal hota hai.

      ### Harmonic Patterns Ki Trading Strategies

      1. **Pattern Identification:**
      - **Description:** Harmonic patterns ko identify karne ke liye, chart patterns aur Fibonacci ratios ko analyze karein. Pattern ke specific legs aur ratios ko accurately define karein.
      - **Action:** Accurate identification se trading signals aur market trends ko better samajha ja sakta hai.

      2. **Entry Points:**
      - **Description:** Harmonic patterns ke D point par entry signals ko consider karein. Yeh point price reversal ya continuation ka strong indication hota hai.
      - **Action:** Pattern ke completion ke baad entry point ko identify karein aur trade execute karein.

      3. **Stop-Loss Aur Take-Profit Levels:**
      - **Description:** Stop-loss aur take-profit levels ko harmonic pattern ke specific points aur ratios ke basis par set karein. Yeh levels market ke potential movements aur risks ko manage karte hain.
      - **Action:** Stop-loss ko pattern ke invalidation point ke thoda bahar set karein aur take-profit levels ko previous support aur resistance levels ke basis par set karein.

      4. **Risk Management:**
      - **Description:** Risk management strategies ko implement karein taake trading risks ko control kiya ja sake. Position sizing aur risk-reward ratio ko consider karein.
      - **Action:** Harmonic patterns ko effective trading strategy ke sath combine karna aur risk management ko follow karna zaroori hai.

      ### Conclusion

      **Harmonic Price Chart Patterns** advanced technical analysis tools hain jo precise market reversals aur continuations ko identify karte hain. Gartley, Bat, Butterfly, aur Crab patterns ko samajhkar aur unki trading strategies ko implement karke, traders market trends ko accurately predict kar sakte hain. Harmonic patterns ke analysis aur risk management strategies ko combine karke, aap trading performance ko enhance kar sakte hain aur profitable trading opportunities ko capture kar sakte hain.

      اب آن لائن

      Working...
      X