Double Doji Candlestick Pattern characteristics in Forex.
X
  • وقت
  • دکھائیں
Clear All
new posts
  • #1 Collapse

    Double Doji Candlestick Pattern characteristics in Forex.
    Explained.

    Candlestick patterns ek important tool hain jin ka use forex market mein kiya jata hai. Double Doji candlestick pattern ek aisa pattern hai jis ko traders apne trading strategies mein istemal karte hain. Is article mein hum Double Doji candlestick pattern ke bare mein roman urdu mein baat karenge.

    Click image for larger version

Name:	images (9).jpeg
Views:	25
Size:	20.5 کلوبائٹ
ID:	12883911

    Doji candlestick pattern ek aisa pattern hai jismein candle ke open aur close price same hote hain. Is pattern ko dekh kar traders ko pata chalta hai ke market mein koi bhi trend nahi hai aur price range bound hai.

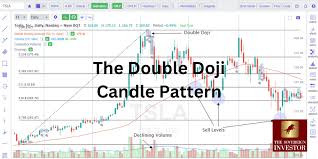
    Double Doji Candlestick Pattern Make.

    Double Doji candlestick pattern mein do consecutive doji candles hote hain. Matlab ke do candlesticks ke open aur close price same hote hain.

    Click image for larger version

Name:	images (3).png
Views:	22
Size:	5.4 کلوبائٹ
ID:	12883912

    Is pattern ko dekh kar traders ko pata chalta hai ke market mein koi bhi trend nahi hai aur price range bound hai.

    Double Doji Candlestick Pattern Use.

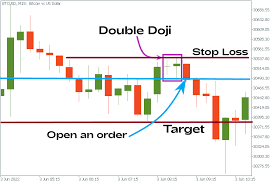
    Double Doji candlestick pattern ko istemal karne ke liye traders ko price action aur support/resistance levels ke bare mein pata hona chahiye. Agar market kisi support/resistance level ke paas hai aur do consecutive doji candles form ho rahe hain toh yeh ek strong signal hai ke price range bound hai aur market directionless hai.

    Click image for larger version

Name:	images (4).png
Views:	23
Size:	10.3 کلوبائٹ
ID:	12883913

    Traders aise situations mein range bound strategies istemal karte hain jaise ke range trading, breakouts aur reversals. Double Doji candlestick pattern ko confirm karne ke liye traders ko volume aur other technical indicators ka bhi istemal karna hota hai.
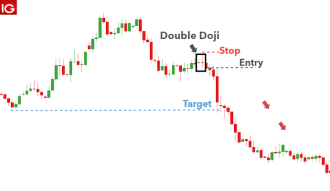
    Trading Strategy.

    Double Doji candlestick pattern ek useful tool hai jo traders ko market direction ke bare mein jankari deta hai. Is pattern ko istemal karne se traders ko market ki range bound movement ko samajhne mein madad milti hai aur woh apne trading strategies ko improve kar sakte hain.


  • <a href="https://www.instaforex.org/ru/?x=ruforum">InstaForex</a>
  • #2 Collapse

    Double Doji candlestick pattern forex market mein ek mukhtalif aur khaas pattern hai jo traders ke liye significance rakhta hai. Yeh pattern do consecutive doji candles se milta hai aur market ke direction mein uncertainty ya reversal ko indicate karta hai. Chaliye, is pattern ke kuch ahem characteristics aur unke interpretation par charcha karte hain:
    Formation

    Double Doji pattern tab banega jab do consecutive doji candles market chart par dikhai denge. Doji candles woh hote hain jinke opening aur closing price ek dusre ke bilkul qareeb hoti hai, aur woh aksar ek line ya cross ki tarah dikhte hain.
    Doji candles ki lambai bhi choti hoti hai aur volume normal se kam hota hai. Yeh doji candles ek dosre ke bilkul pass ya overlap ho sakte hain, lekin yeh zaroori nahi hai.

    Significance

    Double Doji pattern uncertainty aur indecision ko darsata hai market mein. Jab yeh pattern form hota hai, yeh indicate karta hai ke buyers aur sellers ke darmiyan kisi specific direction ka agreement nahi hai aur market consolidation phase mein hai.
    - Is pattern ko reversal signal ke roop mein bhi interpret kiya ja sakta hai, khaaskar agar yeh ek uptrend ya downtrend ke baad dikhai deta hai. Yeh reversal tab hota hai jab doji candles ke baad price mein significant movement hoti hai opposite direction mein.

    Confirmation

    Double Doji pattern ko confirm karne ke liye traders ko doji candles ke baad ki price action ko dekhna hota hai. Agar doji candles ke baad price mein significant movement hoti hai, toh yeh confirm karta hai ke pattern ka significance hai.
    - Agar double doji pattern uptrend ke baad dikhai deta hai aur price doji candles ke baad neeche jaata hai, toh yeh bearish reversal signal ho sakta hai. Similarly, agar pattern downtrend ke baad dikhai deta hai aur price doji candles ke baad upar jaata hai, toh yeh bullish reversal signal ho sakta hai.

    Trading Strategy


    Traders double doji pattern ke breakout ka wait karte hain aur phir us direction mein trade karte hain jahan breakout hota hai.
    - Stop-loss aur target levels ko set karna important hota hai taake traders apne risk ko manage kar sakein.
    - Hamesha zaroori hai ke traders aur bhi technical aur fundamental analysis ka istemal karein taake unki trading decisions ko validate kiya ja sake.
    • #3 Collapse

      Double doji candlestick pattern characteristics in forex.

      Double Doji Candlestick Pattern in Forex Trading

      Forex trading is a realm where traders employ various technical analysis tools to decipher market movements and make informed decisions. Among these tools, candlestick patterns hold a significant place due to their ability to provide insights into market sentiment. One such pattern that traders often look for is the Double Doji Candlestick Pattern.

      Doh Saika Mumul:

      Doh saika mumul, forex trading mein ek ahem technical analysis ka zariya hai jo ke market ke harkaton ko samajhne aur istiqamat se faida uthane mein madadgar sabit hota hai. Is mein se ek pattern jo traders aksar talaash karte hain, woh hai "Double Doji Candlestick Pattern".

      Introduction:

      The Double Doji Candlestick Pattern is characterized by the appearance of two consecutive doji candles on a price chart. A doji candlestick represents a situation where the opening and closing prices are virtually the same, resulting in a very small body with upper and lower wicks of varying lengths. When two such doji candles occur consecutively, it signals indecision and potential reversal in the market.

      Introduction:

      Doh saika mumul, ek mool takniqi misal hai jo ke price chart par do mufarid doji candles ke zahoor ka pata deta hai. Ek doji candlestick woh hoti hai jab kholne aur band hone ke prices lagbhag barabar hote hain, jo ke ek chhote se jism ke sath hoti hai aur upari aur nichli dandiyan mukhtalif lambaiyon ki hoti hain. Jab do aise doji candles ek ke baad ek nazar aati hain, to yeh market mein shak-o-shuba aur mukhtalif mor par ummed-e-badal ki nishaani deti hai.

      Characteristics of Double Doji Candlestick Pattern:

      Doh Saika Mumul ki Khasiyat:
      1. Indecision: The primary characteristic of the Double Doji Candlestick Pattern is indecision in the market. The consecutive appearance of two doji candles suggests a tug of war between buyers and sellers, where neither party has gained control over the price movement. This indecision often precedes significant market reversals.
      2. Shak-O-Shuba: Doh saika mumul ki bunyadi khasiyat shak-o-shuba hai. Do mufarid doji candles ka musalsal zahoor kharidari aur farokhtari ke darmiyan ek jang ka sabab samjha jata hai, jahan kisi bhi taraf ne qeemat ke harkat par qabu hasil nahi kiya hai. Yeh shak-o-shuba aksar ahem market ki mukhtalif moron se pehle ata hai.
      3. Reversal Signal: The Double Doji Candlestick Pattern often serves as a reversal signal. After a prolonged trend, the appearance of this pattern indicates a potential change in direction. For example, if the pattern forms after a prolonged uptrend, it suggests a possible trend reversal to the downside and vice versa.
      4. Mukhtalif Mor Par Ummed-e-Badal ki Nishaani: Doh saika mumul aksar ummed-e-badal ki nishaani ke tor par kaam karta hai. Lambi muddat takri ki surat mein, yeh pattern ka zahoor ek mumkin rukh ki tabdili ka izhar karta hai. Misal ke tor par, agar pattern lambi muddat takri ke baad banata hai, to yeh ek mumkin trend ka ulta janib badalne ki taraf ishara karta hai aur ulta iske baraks bhi.
      5. Confirmation: Traders often seek confirmation from other technical indicators or price action before acting on the Double Doji Candlestick Pattern. This confirmation could come from factors such as volume analysis, support and resistance levels, or other candlestick patterns forming alongside the double doji.
      6. Tasdeeq: Traders aksar double doji candlestick pattern par amal karne se pehle doosre takhleeqi saboot ya price action se tasdeeq talash karte hain. Is tasdeeq ko aam tor par volume analysis, support aur resistance levels ya doosre doji ke sath banne wale aur candlestick patterns se hasil kiya ja sakta hai.

      Conclusion:

      In conclusion, the Double Doji Candlestick Pattern is a valuable tool in forex trading for identifying potential market reversals. Its characteristics of indecision and reversal signals make it an essential element of technical analysis. However, traders should exercise caution and seek confirmation from other sources before making trading decisions solely based on this pattern.

      Nateeja:

      Akhri tor par, doh saika mumul candlestick pattern forex trading mein mumkinah market ki ummed-e-badal ki pehchan ke liye aik qeemti zariya hai. Iski shak-o-shuba aur ummed-e-badal ki nishaaniyon ki khasiyat isay takniqi tajziya ka ahem hissa banati hai. Magar traders ko ehtiyaat bartna chahiye aur is pattern par aik nahi balkay doosri sources se tasdeeq talash karne chahiye, trading faislon ko sirf is pattern par mabni na banaye.
      • #4 Collapse

        Forex market mein trading karte waqt, candlestick patterns ka istemal karke traders apne trading decisions ko improve kar sakte hain. Ek aham aur popular candlestick pattern jo traders ke liye madadgar sabit hota hai, woh hai Double Doji pattern. Is article mein, hum Double Doji Candlestick Pattern ki khasiyatayn par ghor karenge.

        1. Double Doji Candlestick Pattern Ki Pehchan

        Double Doji Candlestick Pattern ko pehchanne ka sabse pehla kadam hai do consecutive doji candles ko dekhna. Doji candles un candles ko represent karte hain jinmein opening price aur closing price aik doosre ke bohot qareeb hotay hain, jis se candle ki body almost nazar nahi aati. Agar ye do doji candles ek dusre ke close ke qareeb close hoti hain, to yeh Double Doji pattern kehlayega.Double Doji pattern ki pehchan karne ke liye, traders ko candles ke size aur shape ka bhi tawajjo deni chahiye. Ye pattern typically market mein choppy ya sideways conditions ke doran develop hota hai jab price mein kisi direction mein clear movement nahi hoti.

        2. Kamzor Market Trend Mein Double Doji Pattern

        Kamzor market trend mein, jahan price mein uncertainty aur indecision hoti hai, Double Doji pattern zyada mufeed hota hai. Aise market conditions mein, traders ko price ka future direction samajhna mushkil ho jata hai, aur Double Doji pattern unhein is uncertainty ka jawab dene mein madadgar sabit hota hai.Yeh pattern kamzor trend ko darust karta hai aur traders ko indicate karta hai ke market mein kisi bhi taraf ki strong movement ki kami hai. Agar ek uptrend ya downtrend ke baad Double Doji pattern develop hota hai, to ye ek potential reversal signal bhi ho sakta hai.

        3. Price Reversal Ka Ishara

        Double Doji pattern price reversal ka ek mukhtasir sa indicator hai. Agar market mein trend change hone ka indication chahiye, to Double Doji pattern ek potential signal provide kar sakta hai. Agar ye pattern upar ya niche ki taraf develop hota hai, to iska matlab hai ke market ka trend shayad change hone wala hai.Lekin, traders ko yaad rakhna chahiye ke Double Doji pattern sirf ek indicator hai aur iski confirmation ke liye dusre technical tools aur analysis ki zaroorat hoti hai.

        4. Trading Range Ki Pehchan

        Agar market trading range mein hai, yaani ke price ek range mein move kar raha hai aur kisi particular direction mein trend nahi ban raha, to Double Doji pattern asar andaz hota hai. Is pattern ki wajah se traders ko pata chalta hai ke market mein kisi bhi taraf ki koi strong movement nahi hai, aur ye indecision ko darust karta hai.Trading range mein Double Doji pattern ki pehchan karne se traders ko ye idea milta hai ke market mein kisi direction mein clear movement hone ke chances kam hain, aur iske mutabiq unhein apni trading strategies adjust karni chahiye.

        5. Volume Ki Ahmiyat

        Double Doji pattern ko confirm karne ke liye volume ki tafteesh zaroori hai. Low volume mein, ye pattern kam asar andaz hota hai, jabke high volume ke sath, iska reliability zyada hota hai. Volume ki analysis ke zariye traders Double Doji pattern ko confirm kar sakte hain aur uski authenticity ko barhawa de sakte hain.Volume ke sath Double Doji pattern ki tafteesh karke, traders ko ye pata lagta hai ke pattern ke piche kis tarah ki buying ya selling activity hai. Agar pattern high volume ke sath develop hota hai, to iska matlab hai ke market mein zyada interest hai aur pattern ki authenticity zyada hoti hai.

        6. Stop Loss Aur Target Level Tay Karna

        Double Doji pattern ko dekhte hue traders apne stop loss aur target levels ko tay kar sakte hain. Agar ye pattern price reversal ka indication deta hai, to traders apne positions ko manage karne ke liye appropriate stop loss aur target levels set kar sakte hain, taake unka risk kam ho aur potential profit zyada ho.Traders ko yaad rakhna chahiye ke stop loss aur target levels set karte waqt, wo apni risk tolerance aur trading plan ko dhyan mein rakhain. Stop loss levels ko tight rakhna chahiye taki losses minimize ho sakein, lekin wo itna tight nahi hona chahiye ke normal market volatility ke chalte positions jaldi hi stop out ho jayein.

        7. Technical Indicators Ki Sath Milap

        Double Doji pattern ko confirm karne ke liye traders technical indicators ka istemal bhi kar sakte hain. Maslan, agar RSI (Relative Strength Index) ya MACD (Moving Average Convergence Divergence) jaise indicators Double Doji pattern ke sath divergence show karte hain, to iska matlab hai ke pattern ki reliability zyada hai.Traders ko kisi bhi single indicator par depend karne se bachna chahiye, aur multiple indicators ka istemal karke pattern ki confirmation ko strengthen karna chahiye. Is tarah ke approach se traders ko sahi aur reliable trading signals milte hain jo unke trading decisions ko improve karte hain.

        8. Multiple Timeframes Par Tafteesh

        Double Doji pattern ko confirm karne ke liye traders multiple timeframes par tafteesh karte hain. Different timeframes par pattern ki tafteesh karke, traders ko ek mukammal picture milti hai market ke current situation ki, aur unhein sahi trading decision lene mein madad milti hai.Traders ko short-term aur long-term timeframes dono par focus rakhna chahiye taki unhein market ke different aspects ko samajhne mein madad mile. Short-term timeframes par pattern ki tafteesh unhein short-term price movements ke bare mein guide karegi, jabke long-term timeframes unhein overall market trend aur sentiment ke bare mein idea dega.

        9. Risk Management Ka Ahmiyat

        Double Doji pattern ki pehchan karke traders apna risk management behtar bana sakte hain. Risk management trading ka ek ahem hissa hai, aur Double Doji pattern ki pehchan karke traders apne positions ko manage karne ke liye appropriate risk management strategies adopt kar sakte hain.Risk management ke liye traders ko apne capital ko protect karne aur apni trading losses ko control karne ke liye kuch zaroori principles ko follow karna chahiye. Kuch risk management strategies Double Doji pattern ki pehchan karne mein traders ko madadgar sabit ho sakti hain, jaise ke:
        • Position Size Control: Har trade ke liye position size ko control karna zaroori hai. Double Doji pattern ki pehchan karne ke baad, traders ko apne trading plan ke mutabiq position size tay karna chahiye taki agar trade unsuccessful ho, to loss ko manage kiya ja sake.
        • Stop Loss Placement: Har trade mein appropriate stop loss level set karna zaroori hai. Double Doji pattern ki pehchan karne ke baad, traders ko stop loss level ko set karne mein cautious hona chahiye taake unka risk minimize ho sake aur unki trading capital protect rahe.
        • Risk-Reward Ratio: Har trade ke liye risk-reward ratio ko consider karna important hai. Double Doji pattern ki pehchan ke baad, traders ko dekhna chahiye ke unka potential profit kitna hai compared to unka potential loss. Agar risk-reward ratio favorable nahi hai, to trade avoid kiya ja sakta hai.

        10. Candlestick Patterns Ka Istemal

        Double Doji pattern ke sath dusre candlestick patterns ka bhi istemal kiya ja sakta hai. Maslan, agar Double Doji pattern ke sath kisi aur bullish ya bearish candlestick pattern ka confirmation milta hai, to traders ko iska matlab hai ke pattern ki authenticity zyada hai, aur unhein trading decisions lene mein zyada confidence hota hai.Traders ko kisi bhi single candlestick pattern par depend karna nahi chahiye, balki unhein multiple patterns ki tafteesh karni chahiye. Is tarah ke approach se traders ko sahi aur reliable trading signals milte hain jo unke trading decisions ko improve karte hain.

        11. Price Action Analysis

        Double Doji pattern price action analysis ka aham hissa hai. Price action analysis traders ko market ke mood aur sentiment ka andaza lagane mein madad deta hai, aur Double Doji pattern is analysis ka ek important part hai.Price action analysis mein traders candlestick patterns, support aur resistance levels, trend lines, aur chart patterns ka istemal karte hain. Double Doji pattern ke identification ke saath, traders ko price action analysis ka aur bhi behtar understanding hota hai, jisse wo market movements ko predict karne mein maharat hasil karte hain.

        12. Patience Aur Discipline

        Double Doji pattern ki pehchan karne ke liye patience aur discipline ki zaroorat hoti hai. Kabhi kabhi market mein pattern develop hone mein waqt lagta hai, aur traders ko patience se kaam lena hota hai taa ke wo sahi waqt par sahi decision le sakein. Discipline bhi zaroori hai taa ke traders apne trading plan ke mutabiq amal karein aur impulsive decisions se bach sakein.Patience aur discipline traders ki success ke liye zaroori hai. Double Doji pattern ko samajhne aur iska istemal karne mein patience aur discipline ke saath, traders apne trading career mein consistent aur profitable ho sakte hain.

        13. Market Sentiment Ka Asar

        Double Doji pattern market sentiment ka asar dikhata hai. Agar market mein uncertainty hai aur traders confused hain ke price ka future direction kya hoga, to Double Doji pattern unhein ek idea deta hai ke market ka sentiment kis taraf ja raha hai.Market sentiment ka analysis traders ko market ke behavior ko samajhne mein madad deta hai. Double Doji pattern ki identification ke baad, traders market sentiment ko assess kar sakte hain aur uske hisab se apne trading strategies ko adjust kar sakte hain.

        14. Backtesting Aur Practice

        Double Doji pattern ko samajhne ke liye traders ko backtesting aur regular practice ki zaroorat hoti hai. Backtesting karke traders apne trading strategies ko test kar sakte hain, aur practice karke pattern ki pehchan mein maharat hasil kar sakte hain.Backtesting ke zariye, traders apne trading strategies ko historical market data par test karke unki effectiveness ko evaluate kar sakte hain. Is tarah ke practice se traders apne weaknesses ko identify kar sakte hain aur apne trading skills ko improve kar sakte hain.

        15. Education Aur Learning

        Double Doji pattern ko samajhne aur istemal karne ke liye traders ko education aur learning par zyada tawajjo deni chahiye. Market dynamics aur trading strategies ke baare mein continuous learning traders ke liye zaroori hai, taa ke wo market ke changes aur trends ko samajh sakein aur apne trading skills ko improve kar sakein.Traders ko market ke latest developments aur trends ke bare mein updated rehna chahiye. Iske liye wo books, online courses, webinars, aur seminars ka istemal kar sakte hain. Education aur learning ke through, traders apne knowledge ko broaden kar sakte hain aur apne trading performance ko enhance kar sakte hain.

        In conclusion, Double Doji Candlestick Pattern Forex trading mein aham role ada karta hai, aur agar traders ise sahi tareeqe se samajh lein aur istemal karein, to ye unke trading decisions ko improve kar sakta hai. Double Doji pattern ki pehchan karne ke liye traders ko patience, discipline, aur continuous learning ki zaroorat hoti hai. Saath hi, traders ko apne risk management ko optimize karne aur market analysis ko strengthen karne ke liye technical skills aur practice par bhi focus karna chahiye.

        • #5 Collapse


          Double Doji Candlestick Pattern characteristics in Forex.

          Double Doji Candlestick Pattern, often a rare but significant occurrence in Forex trading, is a technical analysis formation that signifies indecision in the market. This pattern consists of two consecutive Doji candles, where the open and close prices are almost the same, indicating that neither bulls nor bears were able to gain control during the period. Understanding the characteristics and implications of the Double Doji pattern is essential for traders looking to make informed decisions in the Forex market.

          Click image for larger version

Name:	A 54.png
Views:	21
Size:	3.0 کلوبائٹ
ID:	12883959

          1. Identification:
          • A Double Doji pattern is identified by two consecutive candles with very small bodies, indicating that the open and close prices are almost the same.
          • The upper and lower wicks of the candles can vary in length, but the key is that the bodies are minimal, signifying indecision.

          2. Interpretation:
          • The Double Doji pattern suggests a state of indecision in the market, where neither buyers nor sellers are able to establish control.
          • It often occurs at key support or resistance levels, indicating a potential reversal or continuation of the existing trend.
          • Traders should look for confirmation from other technical indicators or price action signals before making trading decisions based on this pattern.

          3. Market Psychology:
          • The presence of two consecutive Doji candles indicates that the market participants are unsure about the direction of the market.
          • Bulls and bears are in a state of equilibrium, leading to a period of consolidation or a potential reversal in the trend.
          • Traders should be cautious and wait for further confirmation before entering a trade, as the Double Doji pattern alone may not be sufficient to predict future price movements accurately.

          4. Trading Strategies:
          • When the Double Doji pattern forms after a prolonged uptrend, it could signal a potential reversal to the downside. Traders may consider short positions with a stop-loss above the recent high.
          • Conversely, if the pattern appears after a downtrend, it could indicate a potential reversal to the upside. Traders may consider long positions with a stop-loss below the recent low.
          • It's crucial to combine the Double Doji pattern with other technical indicators or price action signals to increase the probability of a successful trade.

          5. Risk Management:
          • As with any trading strategy, risk management is essential when trading the Double Doji pattern.
          • Traders should always use stop-loss orders to limit potential losses in case the trade moves against them.
          • Additionally, traders should consider the risk-to-reward ratio before entering a trade to ensure that the potential reward justifies the risk.

          6. Conclusion:
          • The Double Doji Candlestick Pattern is a rare but powerful formation that can provide valuable insights into market sentiment and potential price movements.
          • Traders should use this pattern in conjunction with other technical analysis tools and price action signals to make informed trading decisions.
          • Proper risk management is essential when trading any pattern to protect capital and maximize returns.

          Overall, the Double Doji Candlestick Pattern is a valuable tool for Forex traders looking to identify potential reversals or continuations in the market. By understanding its characteristics and implications, traders can improve their trading decisions and increase their chances of success in the Forex market.
          • #6 Collapse

            Double Doji Candlestick Pattern characteristics in Forex.

            Click image for larger version

Name:	doji-candlestick-pattern_body_GBPZARDoubleDojicandlefinal.png.full.png
Views:	26
Size:	10.5 کلوبائٹ
ID:	12883974

            Dohra Doji:
            Yeh pattern do doji candlesticks se bana hota hai. Doji candlesticks chhotay jism aur barabar opening aur closing prices ke saath hotay hain.
            1. Samraat Ki Mareezgi: Double Doji pattern aksar market mein khaas tor par samraat ki mareezgi ko darust karti hai. Yeh samjha jaata hai ke buyers aur sellers ke darmiyan tawajjuh ki kami hai.
            2. Volume Ka Kam Hona: Is pattern ke sath amuman volume ka kam hona dekha jata hai. Yeh is baat ki nishaani ho sakti hai ke market mein interest kam hai aur tawajjuh ki kami hai.
            3. Mukhtalif Trend Ke Saath Paish Aata Hai: Double Doji pattern bullish ya bearish trend ke doran paish aa sakta hai. Is liye, isay trend ke mukhtalif stages mein daryaft kiya ja sakta hai.
            4. Confirmation Ki Zaroorat: Double Doji pattern ko confirm karne ke liye traders doji candlesticks ke baad ka price action dekhte hain. Agar price doji ke baad ek direction mein strong move karta hai, to yeh Double Doji pattern ki tasdeeq karta hai.
            5. Stop Loss Aur Entry Point: Traders ko Double Doji pattern ke istemal mein stop loss aur entry point tay karna hota hai. Is pattern ke sath amuman tight stop loss aur entry points ka istemal kiya jata hai.
            6. Mumkinati: Yeh pattern market ke trend ke badalne ki nishaani bhi ho sakti hai. Agar Double Doji pattern bullish trend ke baad paish aaye, to yeh bearish reversal ki mumkinati hai aur agar is pattern ke baad bearish trend shuru hoti hai, to yeh bullish reversal ki mumkinati hai.

            Double Doji candlestick pattern ko samajhna aur istemal karna traders ke liye ahem hai, lekin isay sirf doji candlesticks ki presence par base mat samjha jaye. Always confirm the pattern with other technical indicators and price action analysis.
            • #7 Collapse


              1. Aghaaz:

              Forex mein candlestick patterns ki tafteesh karte waqt Double Doji Pattern ek aham rol ada karta hai. Double Doji Pattern ka asal maqsad market mein indecision aur uncertainty ko darust karna hai. Ye ek aham technical analysis tool hai jo traders ko price action aur market sentiment ko samajhne mein madad deta hai. Is pattern ke appearance ka matlab hai ke market mein buyers aur sellers ke darmiyan koi clear consensus nahi hai.Double Doji Pattern ka aghaaz do consecutive doji candles ke appearance se hota hai, jinmein dono candles ke open aur close price barabar ya qareeb barabar hota hai. Ye doji candles market mein stability aur balance ko darust karte hain. Jab ye doji candles ek doosre ke qareeb aate hain, to yeh ek potential reversal ya continuation signal provide karte hain.

              2. Double Doji Candlestick Pattern Kya Hai?

              Double Doji Pattern ek pattern hai jo do consecutive doji candles se banta hai. Doji candles market mein uncertainty ya indecision ko indicate karte hain aur jab ye doosre ke qareeb aate hain to Double Doji Pattern banta hai.Is pattern ko pehchanna asaan hota hai kyunki dono doji candles ke size aur shape similar hoti hai. Ye pattern trading setups ko identify karne mein madad deta hai. Traders is pattern ko dekh kar market ki future direction ka idea bana sakte hain.

              3. Doji Candlestick Kya Hota Hai?

              Doji candlestick ek aise pattern hai jismein open aur close price barabar ya qareeb barabar hota hai. Ye market mein balance ya indecision ko indicate karta hai aur traders ke darmiyan tug-of-war ki situation darust karta hai.Doji candles ke alag-alag variations hote hain jaise ki long-legged doji, dragonfly doji, aur gravestone doji, jo har ek ke alag alag meanings hote hain. In variations ki understanding traders ko market ki sentiment ko samajhne mein madad deti hai.

              4. Double Doji Pattern ki Pehchan:

              Double Doji Pattern ko pehchane ke liye do consecutive doji candles dekhi jaati hain, jo ek doosre ke qareeb hote hain. Agar ye doji candles market mein trend ke against appear hote hain to ye reversal ka sign ho sakta hai.
              Is pattern ko confirm karne ke liye traders doosre technical indicators aur price action analysis ka istemal karte hain. Agar doji candles ke appearance ke sath sath market mein high volatility bhi hoti hai, to ye pattern aur bhi reliable ho jata hai.

              5. Market Mein Double Doji ka Taweel Asar:

              Double Doji Pattern market mein taweel asar ada kar sakta hai, khas kar agar ye significant support ya resistance level ke qareeb appear hota hai. Ye pattern trend reversal ya trend continuation ka ishaara ho sakta hai, lekin iski tasdiq ke liye doosri confirmatory signals ki zaroorat hoti hai. Traders ko ye samajhna zaroori hai ke double doji pattern ke appearance ke baad market ka behavior closely monitor karna zaroori hai taake wo sahi trading decision le sakein.

              6. Volume ki Ahmiyat:

              Double Doji Pattern ki tasdiq ke liye volume ka tawajjo dena zaroori hai. Agar ye pattern high volume ke saath appear hota hai to iska significance barh jata hai, lekin agar volume low hai to iski authenticity mein shak hota hai. Volume ki madad se traders double doji pattern ke validity ko confirm kar sakte hain. Volume ki kam ya zyada hone se traders ko market sentiment ka pata chalta hai aur unhein sahi trading decisions lene mein madad milti hai.

              7. Support aur Resistance ke Saath Taluq:

              Double Doji Pattern agar significant support ya resistance level ke qareeb appear hota hai to iska importance aur validity barh jati hai. Agar ye pattern support level ke qareeb appear karta hai to ye bullish reversal ka sign ho sakta hai, jabke agar resistance level ke qareeb appear karta hai to ye bearish reversal ka sign ho sakta hai. Support aur resistance levels ke saath double doji pattern ke appearance se traders ko market mein hone wale potential reversals ka idea milta hai.

              8. Double Doji Pattern aur Price Action:

              Price action traders Double Doji Pattern ko market sentiment aur price movement ko samajhne ke liye istemal karte hain. Jab ye pattern significant support ya resistance level ke qareeb appear hota hai to price action analysis ke saath mil kar ye ek powerful trading setup banata hai. Price action analysis ke zariye traders market ke short term aur long term direction ka idea bana sakte hain aur iske mutabiq apne trading strategies ko adjust kar sakte hain.

              9. Stop Loss aur Entry Points:

              Double Doji Pattern ko istemal karke traders apne stop loss aur entry points ko define kar sakte hain. Agar ye pattern trend reversal ke sign ke roop mein appear hota hai to traders apne entry aur exit points ko define karne ke liye iska istemal karte hain. Stop loss ko define karne ke liye ye pattern traders ko market ki direction ka idea deta hai. Stop loss ko define karke traders apni risk ko manage kar sakte hain aur apne trades ko protect kar sakte hain.

              10. Risk Management:

              Double Doji Pattern ki sahi samajh aur istemal se traders apni risk management ko improve kar sakte hain. Ye pattern market mein uncertainty ko indicate karta hai aur traders ko market ki volatility ka idea deta hai, jo unhein apne risk exposure ko control karne mein madad karta hai. Traders ko apne trades mein sahi risk reward ratio maintain karna chahiye aur double doji pattern ke appearance ke baad apne trades ko carefully manage karna chahiye.

              11. False Signals ka Ehtimaam:

              Kabhi-kabhi market mein false signals bhi ho sakte hain, is liye Double Doji Pattern ki confirmation ke liye doosri technical indicators ka istemal zaroori hai. Traders ko ye samajhna zaroori hai ke sirf Double Doji Pattern par bharosa karke trading decisions na len, balki iski confirmation ke liye doosre technical tools ka bhi istemal karna zaroori hai. False signals se bachne ke liye traders ko apni trading strategy ko backtest karke confirm karna chahiye aur sirf double doji pattern ke appearance par trade na karein.

              12. Backtesting aur Strategy Development:

              Double Doji Pattern ko pehchanne aur istemal karne ke liye traders ko apni strategy ko backtest karna zaroori hai. Backtesting ke zariye traders apne trading strategy ko improve kar sakte hain aur Double Doji Pattern ke sahi istemal ka tajurba hasil kar sakte hain. Backtesting ke dauran traders ko pichli market data par apni strategy ko apply karke dekhna chahiye ke kya double doji pattern unke trading setup ke liye reliable hai ya nahi.Strategy development mein backtesting ka istemal traders ko apni trading approach ko refine karne mein madad deta hai. Iske zariye traders apne trading rules ko define kar sakte hain aur market conditions ke hisab se apni strategy ko adjust kar sakte hain. Backtesting ke dauran traders ko apne trading strategy ki weaknesses aur strengths ka pata chalta hai aur wo apni strategy ko improve kar sakte hain.

              13. Khatima:

              Double Doji Candlestick Pattern forex trading mein ek ahem tool hai jo traders ko market ke movements ko samajhne aur apni trading decisions ko improve karne mein madad karta hai. Isko samajhna aur sahi tareeqe se istemal karna traders ke liye zaroori hai. Traders ko is pattern ki characteristics ko samajh kar iska sahi istemal karna chahiye taake wo market mein successful trading kar sakein.Double Doji Pattern ke zariye traders market ke indecision ko identify kar sakte hain aur potential reversals ya continuations ka pata laga sakte hain. Is pattern ki sahi samajh aur uska sahi istemal karke traders apne trading accuracy ko improve kar sakte hain aur consistent profits generate kar sakte hain. Isliye, traders ko double doji pattern ko samajhna aur uska istemal karna zaroori hai taake wo market mein successful trading kar sakein.

              • #8 Collapse


                Double Doji Candlestick Pattern: Forex Mein Ek Ahem Technical Signal

                Forex trading mein technical analysis ka istemal kar ke traders market trends ko samajhne aur munafa kamane ke liye mukhtalif patterns aur signals ko talaash karte hain. Ek aham aur mashhoor candlestick pattern jo traders ke darmiyan pasandida hai wo hai "Double Doji" candlestick pattern. Is article mein hum Double Doji candlestick pattern ke khaasiyat aur iske istemal ke bare mein guftagu karenge.

                1. Double Doji Candlestick Pattern Kya Hai? Double Doji candlestick pattern ek reversal pattern hai jo trend ke badalne ki possibility ko darust karta hai. Is pattern mein do achayi ya do burai ki doji candles nazar ati hain, jinmein dono ke open aur close prices barabar hoti hain. Yeh pattern normal market volatility aur price fluctuation ko darust karta hai.

                2. Characteristics: Double Doji candlestick pattern ke kuch khaasiyat darj zail hain:
                • Do consecutive doji candles: Double Doji pattern mein do achayi ya burai ki doji candles nazar ati hain. In doji candles mein open aur close prices barabar hote hain aur candle ke darmiyan ka body barabar ya bohot chhota hota hai.
                • Price action ke darmiyan koi substantial movement nahi hota: Double Doji pattern mein price action ke darmiyan koi significant movement nahi hoti. Ye indicate karta hai ke market mein uncertainty hai aur trend ki mukhtalif direction ki possibility hai.
                • Reversal ke indication: Double Doji pattern ek reversal ke possibility ko darust karta hai. Agar ye pattern uptrend ke baad nazar aye to ye bearish reversal ki possibility ko indicate karta hai, jabke agar ye downtrend ke baad nazar aye to ye bullish reversal ki possibility ko darust karta hai.

                3. Istemal aur Trading Strategy: Double Doji candlestick pattern ko istemal karne ke liye traders ko market ko closely observe karna hota hai. Agar ye pattern uptrend ya downtrend ke baad nazar aye to iska matlab hai ke trend ki mukhtalif direction ki possibility hai. Traders is pattern ke confirmation ke liye doji candles ke baad ki price action ko bhi dekhte hain. Agar doji ke baad price reversal confirm hoti hai to traders buy ya sell ki positions lete hain, depending on the direction of the confirmed reversal.

                4. Risk Management: Double Doji pattern ka istemal karte waqt, traders ko apni risk management strategy ko bhi dhyan mein rakhna chahiye. Stop-loss orders aur take-profit levels ko sahi tareeqay se set karna zaroori hai taake nuksan se bacha ja sake aur munafa maximize kiya ja sake.

                5. Conclusion: Double Doji candlestick pattern ek aham technical signal hai jo Forex trading mein trend reversal ki possibility ko darust karta hai. Halanki ye pattern keval ek indication hai aur iski confirmation ke liye doji ke baad ki price action ka bhi moolyankan zaroori hai. Traders ko is pattern ko samajh kar sahi tareeqay se istemal karna chahiye aur apni risk management strategy ko bhi mad e nazar rakhte hue trading decisions lena chahiye.

                • <a href="https://www.instaforex.org/ru/?x=ruforum">InstaForex</a>
                • #9 Collapse

                  "Double Doji" candlestick pattern ek mukhtalif aur ahem pattern hai jo ke forex trading mein dekha jata hai. Is pattern mein do doji candlesticks ek saath appear hote hain, jo ke market mein uncertainty ya indecision ko darust karte hain. Neechay "Double Doji" candlestick pattern ke tafseelat di gayi hai:

                  Double Candlestick Pattern

                  1. Tasweer (Overview)
                  - Double Doji candlestick pattern ek bearish ya bullish trend ke doran dekha jata hai aur yeh market mein uncertainty ya indecision ko indicate karta hai.
                  - Is pattern mein do doji candlesticks hote hain, jo ke kisi bhi direction mein significant movement ko darust nahi karte.

                  2.Characteristics
                  Do doji candlesticks ek saath appear hote hain, jinmein open aur close prices ek dusre ke qareeb hote hain.
                  - In candlesticks ke shadows (upper aur lower wicks) normal se zyada chhote hote hain, jo ke price movement ki kami ko darust karte hain.
                  - Double Doji pattern typically ek market reversal ko indicate nahi karta, balki yeh sirf market mein uncertainty ko show karta hai.

                  3. Interpretation (Tashreeh)
                  - Double Doji pattern dekha gaya to yeh indicate karta hai ke market mein uncertainty hai aur traders apne trading decisions ko hold kar sakte hain jab tak clear trend emerge na ho.
                  - Agar Double Doji pattern ek strong trend ke doran dekha jata hai, to yeh indicate karta hai ke market mein potential reversal ho sakta hai, lekin confirmatory signals ki zaroorat hoti hai.

                  4. Graphical Representation (Graphical Representation)
                  - Neechay di gayi hai ek misal jismein Double Doji candlestick pattern dikhaya gaya hai:

                  ```
                  ┌───┬───┬───┬───┬───┬───┐
                  │ │ │ │ │ │ │
                  │ │ │ │ │ │ │
                  │ │ │ │ │ │ │
                  │ │ │ │ │ │ │
                  └───┴───┴───┴───┴───┴───┘
                  Doji Doji
                  ```

                  Double Doji pattern ka sahi tajurba aur samajh traders ko market ke uncertain situations mein trading decisions ko samajhne mein madad karta hai. Lekin hamesha yaad rahe ke is pattern ke signals ko confirm karne ke liye aur doosre technical indicators ka istemal bhi zaroori hai.
                  ​​​​​​​

                  اب آن لائن

                  Working...
                  X