Forex Market Mein Unique Trend Indicators kea ha ?

No announcement yet.
`
X
  • وقت
  • دکھائیں
Clear All
new posts
  • #1 Collapse

    Forex Market Mein Unique Trend Indicators kea ha ?
    """"Forex Market Mein Unique Trend Indicators""""

    Forex market mein kuch unique trend indicators hote hain jo traders ke liye useful ho sakte hain.


    """"Forex Market Mein Unique Trend Indicators Ki Eqsaam""""

    Aapko aur kuch unique trend indicators ke baare mein bata dete hain jo Forex market mein use kiye ja sakte hain:
    1. Relative Strength Index (RSI): RSI ek momentum oscillator hai jo price ke overbought ya oversold conditions ko identify karta hai. Isse traders trend reversals aur potential entry/exit points ko analyze kar sakte hain.
    2. Fibonacci Retracement Levels: Fibonacci retracement levels price movements ko analyze karne ke liye use kiye jaate hain. Ye levels support aur resistance levels ko determine karne mein madadgar hote hain aur trend direction ko confirm karte hain.
    3. Volume Weighted Average Price (VWAP): VWAP indicator price aur volume ka combination hai jo market sentiment ko reflect karta hai. Traders ise trend confirmation aur market direction ke liye use karte hain.
    4. Stochastic Oscillator: Stochastic oscillator price range ke overbought ya oversold levels ko detect karta hai. Ye indicator momentum ko measure karta hai aur trend reversals ko anticipate karne mein madadgar hota hai.
    5. Aroon Indicator: Aroon indicator trend direction aur strength ko measure karta hai. Ye indicator highs aur lows ko analyze karke trend ke beginning aur end points ko identify karta hai.
    6. Williams %R: Williams %R indicator price ke extremes ko measure karta hai aur overbought ya oversold conditions ko detect karta hai. Isse traders potential reversals aur trend changes ko anticipate kar sakte hain.
    In indicators ka use karke traders market trends ko analyze karke better trading decisions le sakte hain. Har indicator apne unique features aur benefits ke saath aata hai, isliye traders ko apne trading style aur risk tolerance ke according suitable indicators ka selection karna chahiye.
  • <a href="https://www.instaforex.org/ru/?x=ruforum">InstaForex</a>
  • #2 Collapse

    Forex market mein trading karna ek challenging kaam hai, jahan traders ko market trends ko analyze karne ke liye kai tools aur indicators ka istemal karna padta hai. Trend indicators market mein ek ahem role ada karte hain, kyunki ye traders ko market ke direction ka pata lagane mein madad karte hain. Lekin, kuch unique trend indicators hain jo traders ke liye khaas taur par faidaymand sabit ho sakte hain.
    1. Ichimoku Kinko Hyo: Ichimoku Kinko Hyo ek popular trend indicator hai jo Japani technical analyst Goichi Hosoda ne develop kiya tha. Ye indicator multiple components par mabni hota hai, jaise ki Tenkan-sen, Kijun-sen, Senkou Span A, Senkou Span B, aur Chikou Span. Ichimoku indicator traders ko trend direction, support aur resistance levels ke sath sath entry aur exit points ka bhi idea deta hai.
    2. Parabolic SAR: Parabolic SAR (Stop and Reverse) ek dynamic trend indicator hai jo market ke direction ko identify karne mein madad karta hai. Ye dots ke form mein price chart par appear hota hai aur price ke sath sath move karta hai. Jab dots price ke upar hote hain, ye downtrend ko indicate karte hain, aur jab dots price ke niche hote hain, ye uptrend ko represent karte hain.
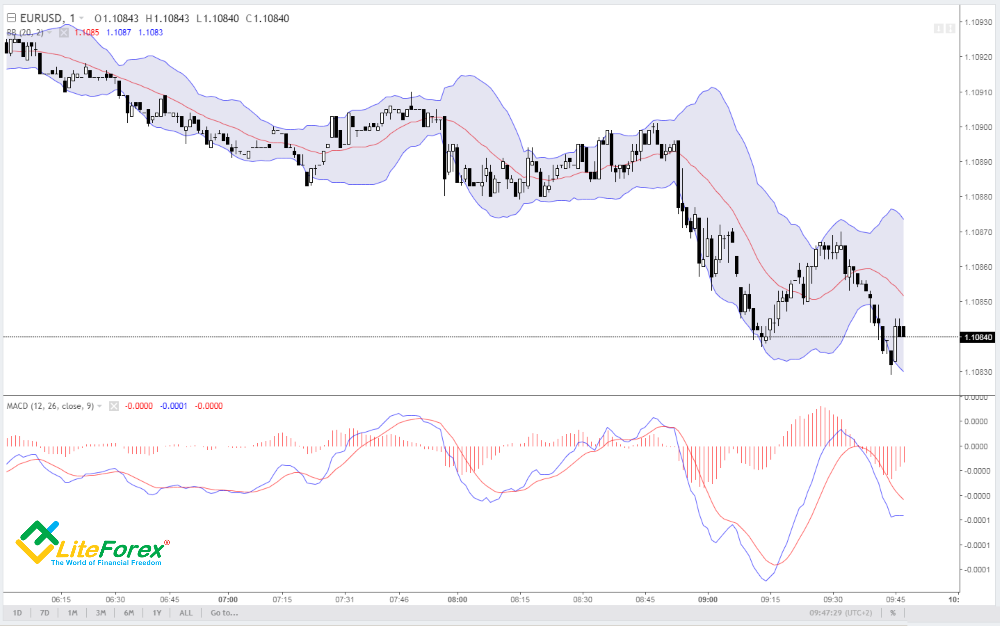
    3. Bollinger Bands: Bollinger Bands ek volatility-based indicator hai jo market ke volatility aur price ke range ko measure karta hai. Ye indicator price ke around ek upper band aur ek lower band banata hai, jo ki price ke fluctuations ko darust karta hai. Jab bands tighten hote hain, ye low volatility ko indicate karte hain, jabki jab bands expand hote hain, ye high volatility ko darust karte hain. Traders price ke movements ko analyze karne aur potential trend reversals ko identify karne ke liye Bollinger Bands ka istemal karte hain.
    4. Relative Strength Index (RSI): RSI ek momentum oscillator hai jo price ke strength aur speed ko measure karta hai. Ye indicator 0 se 100 tak ke range mein hota hai aur overbought aur oversold conditions ko identify karta hai. Jab RSI 70 se zyada ho jata hai, ye overbought market ko indicate karta hai aur jab RSI 30 se kam ho jata hai, ye oversold market ko represent karta hai. Traders RSI ka istemal karke potential trend reversals ko identify karte hain.

    In unique trend indicators ka istemal karke traders market trends ko analyze kar sakte hain aur better trading decisions le sakte hain. Lekin, hamesha yaad rakhein ke kisi bhi indicator ka istemal karne se pehle thorough research aur practice ki zarurat hoti hai, aur sirf indicators par hi nirbhar na rahein.


    • #3 Collapse

      Forex Market mein Unique Trend Indicators

      Forex market, jahan currency pairs ke buying aur selling ka exchange hota hai, aik dynamic aur ever-changing environment hai. Is market mein traders ko consistently profitable rehne ke liye trends ko samajhna aur unhe analyze karna zaroori hai. Trend indicators, jo market ke trend ko samajhne aur predict karne mein madad karte hain, traders ke liye bohot ahem hote hain. Lekin, traditional trend indicators ke ilawa, kuch unique trend indicators bhi hain jo traders ko unconventional aur effective insights provide karte hain.
      1. Volume-Weighted Average Price (VWAP): VWAP, market ke average price ko volume ke sath weight karta hai. Ye indicator, kisi specific time frame ke during market activity ko analyze karta hai aur traders ko average price aur volume ke mutabiq trend ke baray mein maloomat deta hai. VWAP ki madad se traders market ke real-time dynamics ko samajh sakte hain aur trading decisions ko improve kar sakte hain.
      2. Market Profile: Market profile, market ke structure ko visualize karne aur samajhne ke liye ek powerful tool hai. Ye indicator, trading session ke during price aur volume ke distribution ko chart mein represent karta hai. Market profile traders ko market ke key levels aur price action ke patterns ke baray mein insights provide karta hai, jo unhe better trading opportunities dhoondhne mein madad karta hai.
      3. Ichimoku Cloud: Ichimoku Cloud, Japanese origin ka aik complex trend indicator hai jo multiple components se bana hota hai. Ye indicator, trend direction, support aur resistance levels, aur momentum ke baray mein information provide karta hai. Ichimoku Cloud ki madad se traders market ke future trend ki probability ko assess kar sakte hain aur trading strategies ko optimize kar sakte hain.
      4. Bollinger Bands Width: Bollinger Bands Width, traditional Bollinger Bands indicator ka ek modification hai jo volatility ko measure karta hai. Ye indicator, Bollinger Bands ki width ko analyze karta hai aur volatility ke fluctuations ko identify karta hai. Bollinger Bands Width ki madad se traders volatility ke changes ko track kar sakte hain aur trading strategies ko adjust kar sakte hain.
      5. Average True Range (ATR): Average True Range, market ke volatility ko measure karne ke liye ek popular indicator hai. Ye indicator, price movements ka average range calculate karta hai aur volatility ke levels ko determine karta hai. ATR ki madad se traders market ke volatile periods aur choppy conditions ko identify kar sakte hain aur trading positions ko manage kar sakte hain.

      In unique trend indicators ka istemal karke traders forex market ke dynamics ko deeper level par samajh sakte hain aur more informed trading decisions le sakte hain. Lekin, har indicator ki apni limitations hoti hain, is liye traders ko apne trading strategies ko develop karte waqt in indicators ke saath risk management ko bhi consider karna zaroori hai.

      • #4 Collapse

        Forex Market mein Unique Trend Indicators

        Forex market, jahan currencies ki trading hoti hai, woh ek dynamic aur volatile environment hai jahan traders ko naye aur mukhtalif tareeqay se trend analysis karna padta hai. Trend analysis mein indicators ka istemal karna aham hota hai, jo traders ko market ke mukhtalif movements aur trends ka pata lagane mein madad karte hain. Yahan hum kuch unique trend indicators par baat karenge jo forex market mein aapki trading strategy ko mazeed behtar banane mein madadgar sabit ho sakte hain.
        1. Ichimoku Cloud: Ichimoku Cloud ek Japanese trend indicator hai jo price action, support aur resistance levels, aur trend direction ko ek saath dikhata hai. Ye indicator aam tor par lagatar trend ko identify karne mein madad karta hai aur traders ko entry aur exit points ka pata lagane mein help karta hai.
        2. Bollinger Bands: Bollinger Bands ek volatility indicator hai jo price ki volatility ko measure karta hai. Ye indicator price ke around ek upper aur lower band create karta hai jo price ke extremes ko darust karta hai. Traders is indicator ka istemal kar ke price ke reversals aur breakouts ko identify kar sakte hain.
        3. Relative Strength Index (RSI): RSI ek momentum oscillator hai jo overbought aur oversold conditions ko identify karta hai. Ye indicator price ki strength aur weakness ko measure karta hai aur traders ko potential reversals ka pata lagane mein madad karta hai.
        4. MACD (Moving Average Convergence Divergence): MACD ek trend-following momentum indicator hai jo moving averages ke convergence aur divergence ko measure karta hai. Ye indicator trend changes aur momentum ke shifts ko detect karne mein madad karta hai.
        5. Parabolic SAR: Parabolic SAR (Stop and Reverse) ek trend-following indicator hai jo price ke sath sath trend ke direction ko bhi show karta hai. Ye indicator price ke around dots create karta hai jo trend ke reversals ko indicate karte hain.

        In sabhi indicators ke istemal se traders forex market ke movements ko samajh kar apni trading strategy ko mazeed improve kar sakte hain. Lekin yaad rahe ke har indicator ke apne limitations hote hain aur ek indicator ka istemal kar ke trading decision lene se pehle market ke mukhtalif factors ko bhi ghor se dekha jaye.
        • #5 Collapse

          Forex Market mein trading karna ek challenging lekin exciting kaam hai. Har trader ko apni strategy banane ke liye kuch unique aur effective trend indicators ki zarurat hoti hai. In indicators ki madad se traders market ke mukhtalif trends ko samajh sakte hain aur munafa kamane ke liye sahi waqt pe trade kar sakte hain. Yahan, hum kuch unique trend indicators ke baare mein baat karenge jo forex market mein istemal kiye ja sakte hain:
          1. Ichimoku Kinko Hyo: Ichimoku Kinko Hyo ek Japanese trend indicator hai jo market trends ko analyze karne mein madad deta hai. Is indicator mein kuch alag-alag components shamil hote hain jaise ki Senkou Span A, Senkou Span B, Tenkan-sen, Kijun-sen, aur Chikou Span. In components ki madad se traders trend direction aur momentum ko determine kar sakte hain.
          2. Parabolic SAR (Stop and Reverse): Parabolic SAR bhi ek popular trend indicator hai jo price direction ko indicate karta hai. Is indicator mein dots yaar points form mein price ke upper ya lower side par appear hote hain. Agar dots price ke upper side par hain to yeh uptrend ko indicate karte hain, jabki agar price ke lower side par hain to yeh downtrend ko indicate karte hain.
          3. Bollinger Bands: Bollinger Bands bhi ek powerful trend indicator hai jo volatility aur price range ko measure karta hai. Is indicator mein ek middle band aur do outer bands hote hain jo price ke around move karte hain. Jab market volatile hota hai to Bollinger Bands wide ho jate hain aur jab market stable hota hai to yeh narrow ho jate hain. Traders is indicator ki madad se price ke direction aur volatility ka pata laga sakte hain.
          4. Relative Strength Index (RSI): RSI bhi ek popular trend indicator hai jo price ke momentum ko measure karta hai. Yeh indicator 0 se 100 tak ke range mein hota hai aur overbought aur oversold conditions ko indicate karta hai. Agar RSI 70 se zyada ho jata hai to yeh overbought condition ko darust karta hai, jabki agar RSI 30 se kam ho jata hai to yeh oversold condition ko darust karta hai.

          In unique trend indicators ki madad se traders forex market ke mukhtalif trends ko analyze kar sakte hain aur sahi waqt pe trade kar sakte hain. Lekin yaad rahe ke har indicator apne limitations ke saath ata hai, isliye traders ko in indicators ko sahi taur par samajhna aur istemal karna chahiye.
          • #6 Collapse

            ### Forex Market Mein Unique Trend Indicators Kya Hain?
            Forex trading mein trend indicators aapko market ke direction aur potential price movements ko identify karne mein madad karte hain. Yeh indicators aapko trend ke strength aur sustainability ko assess karne mein bhi help karte hain. Is post mein, hum kuch unique aur effective trend indicators ko explore karenge jo Forex market mein use kiye jate hain.

            **1. Ichimoku Cloud**:
            - **Description**: Ichimoku Cloud ek comprehensive trend indicator hai jo market ke overall trend, support, aur resistance levels ko visualize karne mein madad karta hai. Ismein paanch components hote hain: Tenkan-sen (Conversion Line), Kijun-sen (Base Line), Senkou Span A aur B (Leading Spans), aur Chikou Span (Lagging Line).
            - **Usage**: Agar price cloud ke upar hoti hai, to yeh bullish trend ko indicate karta hai, jabke cloud ke neeche price hona bearish trend ko indicate karta hai. Cloud ka width aur color bhi trend ke strength aur potential reversals ko identify karne mein madad karta hai.

            **2. Average True Range (ATR)**:
            - **Description**: ATR volatility indicator hai jo market ke price fluctuations ke range ko measure karta hai. Yeh trend ke strength ko directly measure nahi karta, lekin yeh market ki volatility aur potential price movements ko gauge karta hai.
            - **Usage**: High ATR values market ki high volatility aur large price movements ko indicate karti hain, jabke low ATR values stable aur low volatility market conditions ko dikhati hain. ATR ka use stop-loss levels aur trading ranges ko set karne ke liye bhi hota hai.

            **3. Parabolic SAR (Stop and Reverse)**:
            - **Description**: Parabolic SAR ek trend-following indicator hai jo price ke direction aur potential reversal points ko identify karne mein madad karta hai. Is indicator ka visual representation dots ki form mein hota hai jo price ke upar ya neeche plot hote hain.
            - **Usage**: Jab dots price ke upar hote hain, to yeh bearish signal hota hai, aur jab dots price ke neeche hote hain, to yeh bullish signal hota hai. Parabolic SAR ko stop-loss aur exit points set karne ke liye bhi use kiya jata hai.

            **4. Donchian Channels**:
            - **Description**: Donchian Channels price ke highest aur lowest points ko ek specific time period ke dauran plot karta hai, jo ek channel create karta hai. Yeh indicator trend-following aur breakout signals provide karta hai.
            - **Usage**: Jab price channel ke upper boundary ko break karti hai, to yeh bullish breakout signal hota hai, aur jab price lower boundary ko break karti hai, to yeh bearish breakout signal hota hai. Donchian Channels ko trend reversals aur entry/exit points identify karne ke liye use kiya jata hai.

            **5. Keltner Channels**:
            - **Description**: Keltner Channels volatility-based indicator hai jo price ke average true range ke saath moving average ko combine karta hai. Ismein ek central moving average aur uske upar aur neeche bands hote hain.
            - **Usage**: Price ke bands ke upar ya neeche hone se market ke trend aur volatility ka indication milta hai. Yeh channels trend-following aur volatility-based trading strategies ke liye use kiye jate hain.

            **Conclusion**:
            Forex market mein unique trend indicators aapko market ke direction aur potential movements ko accurately gauge karne mein madad karte hain. Ichimoku Cloud, ATR, Parabolic SAR, Donchian Channels, aur Keltner Channels jaise indicators ko use karke, aap apni trading strategy ko enhance kar sakte hain aur market trends ko better analyze kar sakte hain. In indicators ka sahi use aur combination aapko successful trading decisions lene mein madadgar sabit ho sakta hai.
            • #7 Collapse

              Forex Market Mein Unique Trend Indicators kea ha details

              Forex market mein unique trend indicators wo technical tools hote hain jo market ka trend identify karne mein traders ki madad karte hain. Yeh indicators price movements ka analysis karte hain aur traders ko signals provide karte hain taake wo market ki direction ke mutabiq apne trades place kar sakein. Kuch unique trend indicators jo Forex market mein widely use hote hain

              1. Ichimoku Cloud
              Overview

              Ichimoku Cloud ek comprehensive trend indicator hai jo multiple components ka use karke market trend, support, aur resistance levels ko identify karta hai. Ismein Tenkan-sen, Kijun-sen, Senkou Span A, Senkou Span B, aur Chikou Span lines shamil hoti hain.

              Unique Feature

              Ichimoku Cloud ke multiple elements ek complete trading system provide karte hain jo trend strength, direction, aur potential reversal points ko dikhate hain.

              2. Parabolic SAR (Stop and Reverse)

              Overview

              Parabolic SAR ek trend-following indicator hai jo price ke neeche ya upar dots ke form mein plot hota hai. Yeh indicator trend ke direction aur potential reversal points ko dikhata hai.

              Unique Feature

              Parabolic SAR apne simple dots ke zariye traders ko easy-to-read trend signals provide karta hai. Yeh typically trailing stop loss ke taur par bhi use hota hai.


              3. ADX (Average Directional Index)


              Overview


              ADX ek indicator hai jo trend ki strength ko measure karta hai. Ismein DI+ aur DI- lines shamil hoti hain jo trend ki direction aur ADX line trend ki strength ko represent karti hai.


              Unique Feature

              ADX market mein trending aur non-trending phases ko easily identify karne mein madad karta hai, jisse traders ko trend-following aur range-bound strategies mein differentiate karne mein asaani hoti hai.

              4. Donchian Channels

              Overview

              ​​​​​​​
              Donchian Channels ek trend indicator hai jo price ki high aur low levels ka moving range dikhata hai. Yeh upper, lower, aur middle bands ke form mein hota hai.

              Unique Feature


              Donchian Channels ka use trend breakouts ko identify karne ke liye hota hai. Yeh indicator historical price action ko analyze karke trend continuation ya reversal signals deta hai.


              5. Supertrend


              Overview

              ​​​​​​​
              Supertrend indicator ek trend-following tool hai jo price ke neeche ya upar ek line plot karta hai. Yeh ATR (Average True Range) ka use karke price action ke mutabiq move karta hai.


              Unique Feature

              Supertrend apni simple visualization aur accuracy ke liye jaana jata hai. Yeh trending markets
              • #8 Collapse


                Forex Market Mein Unique Trend Indicators kea ha details

                Introduction

                Forex market mein unique trend indicators ki zaroorat hai taa ki traders apne trades ko sahi se manage kar sakein.

                Neeche kuch unique trend indicators ke details diye gaye hain:

                1. Moving Average (MA):

                Yeh indicator trend ki direction aur strength ko show karta hai.

                2. Relative Strength Index (RSI):

                Yeh indicator trend ki strength aur momentum ko show karta hai.

                3. Bollinger Bands:

                Yeh indicator trend ki volatility aur strength ko show karta hai.

                4. Ichimoku Cloud:

                Yeh indicator trend ki direction aur strength ko show karta hai.

                5. Force Index:

                Yeh indicator trend ki strength aur momentum ko show karta hai.

                6. MACD (Moving Average Convergence Divergence):

                Yeh indicator trend ki direction aur strength ko show karta hai.

                7. Stochastic Oscillator:

                Yeh indicator trend ki strength aur momentum ko show karta hai.

                8. Parabolic SAR:

                Yeh indicator trend ki direction aur strength ko show karta hai.

                9. ADX (Average Directional Index):


                Yeh indicator trend ki strength aur direction ko show karta hai.

                10. CCI (Commodity Channel Index):

                Yeh indicator trend ki strength aur momentum ko show karta hai.


                Conclusion

                Yeh indicators traders ko apne trades ko sahi se manage karne mein madad karte hain. Lekin, yeh indicators ka use karne se pehle, traders ko apne risk management strategies ko bhi consider karna chahiye.Forex market mein unique trend indicators aapko market ke direction aur potential movements ko accurately gauge karne mein madad karte hain. Ichimoku Cloud, ATR, Parabolic SAR, Donchian Channels, aur Keltner Channels jaise indicators ko use karke, aap apni trading strategy ko enhance kar sakte hain aur market trends ko better analyze kar sakte hain. In indicators ka sahi use aur combination aapko successful trading decisions lene mein madadgar sabit ho sakta hai.
                Last edited by ; 02-09-2024, 09:57 PM.
                • #9 Collapse

                  Forex market mein unique trend indicators ka istemal trading ke liye kiya jata hai, jo traders ko market ke future movements ka andaza lagane mein madad dete hain. In indicators ka maksad market ki direction aur momentum ko samajhna hota hai, taake trading decisions zyada informed aur strategic hon.
                  Ek mashhoor trend indicator "Moving Average" hai. Yeh indicator market ke average price ko ek specific period ke liye calculate karta hai. Isse traders ko trend ki overall direction samajhne mein madad milti hai. Simple Moving Average (SMA) aur Exponential Moving Average (EMA) do main types hain. SMA ek period ke dauran market ke closing prices ka average nikalta hai, jabke EMA zyada recent prices ko zyada weightage deta hai, jo ki market ke changes ko jaldi capture kar sakta hai.

                  Doosra important indicator "Relative Strength Index" (RSI) hai. Yeh indicator market ki overbought ya oversold conditions ko identify karta hai. RSI ek scale par 0 se 100 tak measure kiya jata hai, aur agar RSI 70 ke upar hai, toh market overbought mana jata hai, jabke 30 ke neeche hone par market oversold hota hai. Yeh information traders ko potential reversal points identify karne mein madad deti hai.

                  "Moving Average Convergence Divergence" (MACD) bhi ek unique trend indicator hai. Yeh indicator do moving averages ke beech ke relationship ko analyze karta hai. MACD line aur signal line ke crossovers market ke trend changes ke signals de sakte hain. Jab MACD line signal line ke upar hoti hai, toh yeh bullish signal hota hai, aur jab neeche hoti hai, toh bearish signal hota hai.

                  Ek aur useful indicator "Bollinger Bands" hai. Yeh indicator market ke volatility ko measure karta hai aur price movements ke boundaries define karta hai. Bollinger Bands teen lines se mil kar bana hota hai: ek middle band jo moving average hota hai, aur do outer bands jo standard deviations ko represent karte hain. Jab price outer bands ke paas hoti hai, toh market ki volatility zyada hoti hai, aur jab price middle band ke paas hoti hai, toh market stable hoti hai.

                  "Average True Range" (ATR) bhi volatility ko measure karne ke liye use hota hai. ATR market ke price fluctuations ko track karta hai aur traders ko market ki current volatility ke baare mein information deta hai. High ATR values indicate karte hain ke market zyada volatile hai, jabke low ATR values indicate karte hain ke market stable hai.

                  In indicators ka istemal trading strategies ko refine karne aur risk management ko improve karne ke liye hota hai. Lekin, kisi bhi trend indicator ko use karne se pehle, traders ko inki limitations aur market conditions ko samajhna zaroori hai. Indicators ko market ki overall analysis aur apne trading plan ke sath mila kar use karna chahiye, taake best results achieve kiye ja sakein


                  • #10 Collapse

                    Forex Market Mein Unique Trend Indicators


                    Forex market, yaani foreign exchange market, duniya ka sab se bara aur liquid financial market hai. Is market mein currencies ka trading hota hai, aur yahan par trend indicators ka istemal traders aur investors ke liye bohot ahem hai. Is maqalay mein hum unique trend indicators ke baare mein tafseeli guftagu kareinge.
                    1. Trend Indicators Ki Ahmiyat


                    Trend indicators wo tools hain jo market ke trend ko samajhne aur pehchanne mein madadgar hote hain. Inka istemal karke traders ye jaan sakte hain ke market kis direction mein ja raha hai, taake wo behtar trading decisions le sakein.
                    2. Moving Averages


                    Moving averages sab se mashhoor trend indicators hain. Ye price data ka average nikaalte hain aur trend ki direction ka andaza lagate hain. Simple Moving Average (SMA) aur Exponential Moving Average (EMA) do maqbool tareeqe hain jo traders istemal karte hain.
                    3. Average Directional Index (ADX)


                    Average Directional Index (ADX) trend ki strength ko measure karta hai. ADX ki value 0 se 100 tak hoti hai. 20 se neeche ADX ka matlab hai ke market mein trend nahi hai, jabke 20 se upar trend ki strength zyada hoti hai.
                    4. Bollinger Bands


                    Bollinger Bands do lines hain jo moving average ke 2 standard deviations ke as-paas banti hain. Ye indicator market ki volatility ko measure karta hai. Jab price bands ke bahar chala jata hai, to ye signal hota hai ke market mein zyada volatility hai.
                    5. MACD (Moving Average Convergence Divergence)


                    MACD ek powerful trend indicator hai jo moving averages ke beech ke difference ko measure karta hai. Iska istemal trend reversal aur momentum ki pehchan karne ke liye hota hai. Jab MACD line signal line ko cross karti hai, to ye buy ya sell signal hota hai.
                    6. Ichimoku Cloud


                    Ichimoku Cloud ek comprehensive indicator hai jo support, resistance, momentum aur trend ki direction sab kuch ek hi nazar mein dikhata hai. Isme multiple lines hoti hain jo trader ko market ka overall view deti hain.
                    7. Parabolic SAR


                    Parabolic SAR (Stop and Reverse) ek unique indicator hai jo price ke saath move karta hai. Ye indicator trend reversal points ko identify karta hai. Jab price indicator ke upar hota hai, to ye bearish signal hota hai, aur jab neeche hota hai, to ye bullish signal hota hai.
                    8. Fibonacci Retracement


                    Fibonacci retracement levels market ke potential reversal points ko identify karte hain. Ye levels price action ke basis par determine kiye jate hain, aur ye trader ko samajhne mein madad dete hain ke price kis level par wapas aa sakta hai.
                    9. Commodity Channel Index (CCI)


                    Commodity Channel Index (CCI) price ke trend ko measure karta hai. Iska istemal overbought ya oversold conditions ko identify karne ke liye hota hai. CCI ka value 0 se zyada hona bullish signal hota hai, jabke 0 se kam hona bearish signal hota hai.
                    10. Williams %R


                    Williams %R bhi ek momentum indicator hai jo market ki overbought ya oversold conditions ko dikhata hai. Iski value -20 se upar hone par market overbought hota hai, jabke -80 se neeche hone par oversold hota hai.
                    11. Trend Lines


                    Trend lines market ke price action ko visualize karne ka asan tareeqa hain. Ye lines price ke peaks aur troughs ko connect karke draw ki jati hain. Trend lines se traders ko market ke bullish ya bearish trends ka andaza hota hai.
                    12. Keltner Channels


                    Keltner Channels bhi volatility ko measure karte hain. Ye indicator moving average ke as-paas bante hain aur average true range ko istemal karte hain. Jab price channels ke bahar hota hai, to ye zyada volatility aur potential price movement ka indication hota hai.
                    13. Rate of Change (ROC)


                    Rate of Change (ROC) indicator price ki change ko percentage mein measure karta hai. Ye ek momentum indicator hai jo price movement ki speed ko dikhata hai. Jab ROC positive hota hai, to ye bullish trend ki taraf ishara karta hai, aur jab negative hota hai, to bearish trend ki taraf.
                    14. Conclusion


                    Forex market mein unique trend indicators ka istemal trading strategies ko behtar banata hai. Har indicator ki apni khasiyat aur istemal ka tareeqa hota hai. Traders ko chahiye ke wo in indicators ko samjhein aur apne trading decisions ko behtar banane ke liye inka istemal karein. Market ki volatility aur trends ko samajh kar, traders na sirf risk ko manage kar sakte hain balki profit bhi kama sakte hain.

                    In indicators ka istemal karke traders apne trading experience ko behtar bana sakte hain, lekin hamesha yaad rahe ke market ki unpredictability ki wajah se risk management bhi zaroori hai.
                    • #11 Collapse

                      Forex market mein unique trend indicators ka istemal trading ke liye bohot ahmiyat rakhta hai. Yeh indicators traders ko market ke trends samajhne aur unhe analyse karne mein madad dete hain. Is maqalay mein hum kuch unique trend indicators ka jaiza lenge jo Forex trading mein behtareen results de sakte hain.
                      1. Introduction to Forex Trading


                      Forex trading duniya ka sabse bara aur liquid financial market hai. Ismein currencies ka kharid-farokht hota hai. Traders market ke trends ko samajhne ke liye indicators ka istemal karte hain.
                      2. Importance of Trend Indicators


                      Trend indicators market ke overall direction ko samajhne mein madadgar hote hain. Yeh traders ko yeh jaanne mein madad dete hain ke kab buy ya sell karna hai.
                      3. Moving Averages


                      Moving averages, jaise ke Simple Moving Average (SMA) aur Exponential Moving Average (EMA), bohot mashhoor indicators hain. Yeh price ki average ko ek specific period ke liye calculate karte hain aur market ke trend ko identify karne mein madad dete hain.
                      4. Average True Range (ATR)


                      ATR volatility ko measure karne ka ek indicator hai. Yeh traders ko market ki volatility ka andaza lagane mein madad karta hai, jo entry aur exit points tay karne ke liye bohot faida mand hai.
                      5. Relative Strength Index (RSI)


                      RSI ek momentum oscillator hai jo overbought aur oversold conditions ko measure karta hai. Yeh indicator 0 se 100 tak ke scale par kaam karta hai, aur 70 se upar ke values overbought aur 30 se neeche ke values oversold indicate karte hain.
                      6. MACD (Moving Average Convergence Divergence)


                      MACD trend-following momentum indicator hai. Yeh do moving averages ke darmiyan ke relationship ko dikhata hai aur trends ke potential reversal points identify karne mein madad karta hai.
                      7. Bollinger Bands


                      Bollinger Bands price volatility ko measure karne ke liye banaye gaye hain. Yeh bands moving average ke aas paas create hote hain aur price fluctuations ko track karne mein madadgar hote hain.
                      8. Parabolic SAR


                      Parabolic SAR trend direction ko dikhata hai aur potential reversal points ko identify karta hai. Iska istemal traders ko stop-loss levels set karne mein bhi madad deta hai.
                      9. Stochastic Oscillator


                      Stochastic oscillator momentum ko measure karta hai aur overbought ya oversold conditions ko identify karne mein madad karta hai. Yeh bhi 0 se 100 ke scale par kaam karta hai.
                      10. Fibonacci Retracement Levels


                      Fibonacci retracement levels market ke pullbacks aur reversals ko identify karne ke liye use hote hain. Yeh levels key support aur resistance points ko highlight karte hain.
                      11. Ichimoku Cloud


                      Ichimoku Cloud ek comprehensive indicator hai jo support, resistance, momentum aur trend direction ko ek hi nazar mein dikhata hai. Yeh traders ko market ke overall trend ko samajhne mein madad karta hai.
                      12. Volume Indicators


                      Volume indicators market ki activity ko measure karte hain. Jab volume high hota hai, to yeh trend ke strength ko dikhata hai, jabke low volume trends ki reliability ko kam kar deta hai.
                      13. Unique Custom Indicators


                      Kuch traders apne khud ke custom indicators bhi develop karte hain. Yeh indicators specific market conditions ya personal trading strategies ko madde nazar rakhte hain.
                      14. Conclusion


                      Forex market mein unique trend indicators ka istemal trading strategies ko behtar banata hai. Yeh indicators traders ko market ke trends ko samajhne aur behtareen decisions lene mein madad karte hain. Agar traders in indicators ko sahi tarah se samjhein aur istemal karein, to yeh unke liye successful trading ki ultimate raah khol sakte hain.
                      • #12 Collapse

                        Forex market mein unique trend indicators ka istemal price movements aur market trends ko samajhne ke liye hota hai. Yahan kuch notable trend indicators hain:
                        ### 1. **Ichimoku Cloud**
                        - **Description**: Yeh indicator trend, momentum, aur support/resistance levels ko ek hi chart par dikhata hai.
                        - **Components**: Five lines (Tenkan-sen, Kijun-sen, Senkou Span A, Senkou Span B, aur Chikou Span) trend ki strength aur direction ka pata lagate hain.

                        ### 2. **Average Directional Index (ADX)**
                        - **Description**: ADX trend ki strength ko measure karta hai, na ki direction ko.
                        - **Interpretation**: ADX value 20 se upar hone par strong trend aur 20 se neeche hone par weak trend ko indicate karta hai.

                        ### 3. **Parabolic SAR (Stop and Reverse)**
                        - **Description**: Yeh indicator price ke chart par dots ke through trend direction dikhata hai.
                        - **Function**: Agar dots price ke upar hain, to trend bearish hai; agar neeche hain, to bullish trend hai.

                        ### 4. **Supertrend Indicator**
                        - **Description**: Yeh trend-following indicator price action ke saath chalta hai.
                        - **Use**: Supertrend green color mein bullish trend aur red mein bearish trend ko indicate karta hai.

                        ### 5. **Aroon Indicator**
                        - **Description**: Yeh indicator trend ki strength aur reversal points ko track karta hai.
                        - **Components**: Aroon Up aur Aroon Down lines ke through trend ki direction aur strength dikhata hai.

                        ### 6. **Market Profile**
                        - **Description**: Market profile price levels par trading volume ko display karta hai, jo support aur resistance levels ko samajhne mein madad karta hai.
                        - **Use**: Yeh trader ko trend direction aur potential reversal points identify karne mein help karta hai.

                        ### 7. **Keltner Channels**
                        - **Description**: Yeh indicator volatility aur trend direction ko measure karta hai.
                        - **Components**: Keltner channels price ke aas-paas ke bands banata hai, jisse trend aur potential reversals ko identify kiya ja sakta hai.

                        ### Key Considerations:
                        - **Combination**: Indicators ko saath mein istemal karke confirmation aur accuracy badhai ja sakti hai.
                        - **Backtesting**: Indicators ko use karne se pehle backtesting zaroor karein taake unki effectiveness samajh sakein.
                        - **Market Context**: Indicator signals ko market context aur news events ke sath analyze karna na bhoolen.

                        Yeh unique trend indicators aapki trading strategies ko enhance kar sakte hain.
                        • <a href="https://www.instaforex.org/ru/?x=ruforum">InstaForex</a>
                        • #13 Collapse

                          Forex Market Mein Unique Trend Indicators Kya Hain?
                          Forex market mein trading karte waqt, traders ko market ke trend ka pata karna bohot zaroori hota hai. Unique trend indicators wo tools hain jo price movements ko analyze karke market ki direction ko samajhne mein madad dete hain. Ye indicators traders ko entry aur exit points identify karne mein bhi madadgar hote hain. Is maqala mein, hum kuch unique trend indicators par roshni dalenge jo forex trading mein ahem kirdar ada karte hain.

                          1. Moving Averages (MA)
                          Moving averages sabse maqbool trend indicators hain. Ye price data ka average lekar ek smooth line banate hain jo market ke trend ko dikhati hai. Do tarah ki moving averages hoti hain: Simple Moving Average (SMA) aur Exponential Moving Average (EMA). EMA recent prices ko zyada weightage deta hai, is liye ye zyada responsive hota hai market ki changes ke liye.

                          2. Average True Range (ATR)
                          ATR volatility ko measure karta hai aur traders ko market ki stability ka andaza lagane mein madad karta hai. Jab ATR high hota hai, iska matlab market mein volatility zyada hai, aur jab low hota hai, to market relatively stable hota hai. Ye indicator trend ke strength ko bhi dikhata hai, jisse traders ko trend reversal ya continuation ka pata chalta hai.

                          3. Relative Strength Index (RSI)
                          RSI ek momentum oscillator hai jo overbought aur oversold conditions ko measure karta hai. Ye 0 se 100 tak ke scale par hota hai, jahan 70 se zyada ki reading overbought aur 30 se kam ki reading oversold condition ko dikhati hai. Traders in readings ka istemal karte hain taake wo market ke potential reversal points ko identify kar saken.

                          4. Parabolic SAR
                          Parabolic Stop and Reverse (SAR) indicator price ki direction aur trend reversals ko identify karta hai. Ye trader ko stop loss set karne mein madad karta hai. Jab price indicator ke upar hoti hai, to trend bearish hota hai, aur jab price indicator ke neeche hoti hai, to trend bullish hota hai.

                          5. Bollinger Bands
                          Bollinger Bands price ke volatility ko measure karne ke liye use hota hai. Ye three lines ka set hota hai: ek moving average line aur do standard deviation lines. Jab price bands ke upar ya neeche hoti hai, to ye indicate karta hai ke market extreme conditions mein hai aur potential reversal ho sakta hai.

                          In unique trend indicators ka istemal karke traders market ki direction aur potential reversals ka andaza laga sakte hain. Lekin in indicators ko sirf ek tool ke tor par istemal karna chahiye, dusre analysis tools aur risk management strategies ke sath milakar. Is tarah, traders apne decisions ko behtar bana sakte hain aur apni trading strategy ko mazid majboot kar sakte hain.


                          اب آن لائن

                          Working...
                          X