Forex Market Mein Unique Trend Indicators kea ha ?
X
  • وقت
  • دکھائیں
Clear All
new posts
  • #1 Collapse

    Forex Market Mein Unique Trend Indicators kea ha ?
    """"Forex Market Mein Unique Trend Indicators""""

    Forex market mein kuch unique trend indicators hote hain jo traders ke liye useful ho sakte hain.


    """"Forex Market Mein Unique Trend Indicators Ki Eqsaam""""

    Aapko aur kuch unique trend indicators ke baare mein bata dete hain jo Forex market mein use kiye ja sakte hain:
    1. Relative Strength Index (RSI): RSI ek momentum oscillator hai jo price ke overbought ya oversold conditions ko identify karta hai. Isse traders trend reversals aur potential entry/exit points ko analyze kar sakte hain.
    2. Fibonacci Retracement Levels: Fibonacci retracement levels price movements ko analyze karne ke liye use kiye jaate hain. Ye levels support aur resistance levels ko determine karne mein madadgar hote hain aur trend direction ko confirm karte hain.
    3. Volume Weighted Average Price (VWAP): VWAP indicator price aur volume ka combination hai jo market sentiment ko reflect karta hai. Traders ise trend confirmation aur market direction ke liye use karte hain.
    4. Stochastic Oscillator: Stochastic oscillator price range ke overbought ya oversold levels ko detect karta hai. Ye indicator momentum ko measure karta hai aur trend reversals ko anticipate karne mein madadgar hota hai.
    5. Aroon Indicator: Aroon indicator trend direction aur strength ko measure karta hai. Ye indicator highs aur lows ko analyze karke trend ke beginning aur end points ko identify karta hai.
    6. Williams %R: Williams %R indicator price ke extremes ko measure karta hai aur overbought ya oversold conditions ko detect karta hai. Isse traders potential reversals aur trend changes ko anticipate kar sakte hain.
    In indicators ka use karke traders market trends ko analyze karke better trading decisions le sakte hain. Har indicator apne unique features aur benefits ke saath aata hai, isliye traders ko apne trading style aur risk tolerance ke according suitable indicators ka selection karna chahiye.
  • <a href="https://www.instaforex.org/ru/?x=ruforum">InstaForex</a>
  • #2 Collapse

    Forex market mein trading karna ek challenging kaam hai, jahan traders ko market trends ko analyze karne ke liye kai tools aur indicators ka istemal karna padta hai. Trend indicators market mein ek ahem role ada karte hain, kyunki ye traders ko market ke direction ka pata lagane mein madad karte hain. Lekin, kuch unique trend indicators hain jo traders ke liye khaas taur par faidaymand sabit ho sakte hain.
    1. Ichimoku Kinko Hyo: Ichimoku Kinko Hyo ek popular trend indicator hai jo Japani technical analyst Goichi Hosoda ne develop kiya tha. Ye indicator multiple components par mabni hota hai, jaise ki Tenkan-sen, Kijun-sen, Senkou Span A, Senkou Span B, aur Chikou Span. Ichimoku indicator traders ko trend direction, support aur resistance levels ke sath sath entry aur exit points ka bhi idea deta hai.
    2. Parabolic SAR: Parabolic SAR (Stop and Reverse) ek dynamic trend indicator hai jo market ke direction ko identify karne mein madad karta hai. Ye dots ke form mein price chart par appear hota hai aur price ke sath sath move karta hai. Jab dots price ke upar hote hain, ye downtrend ko indicate karte hain, aur jab dots price ke niche hote hain, ye uptrend ko represent karte hain.
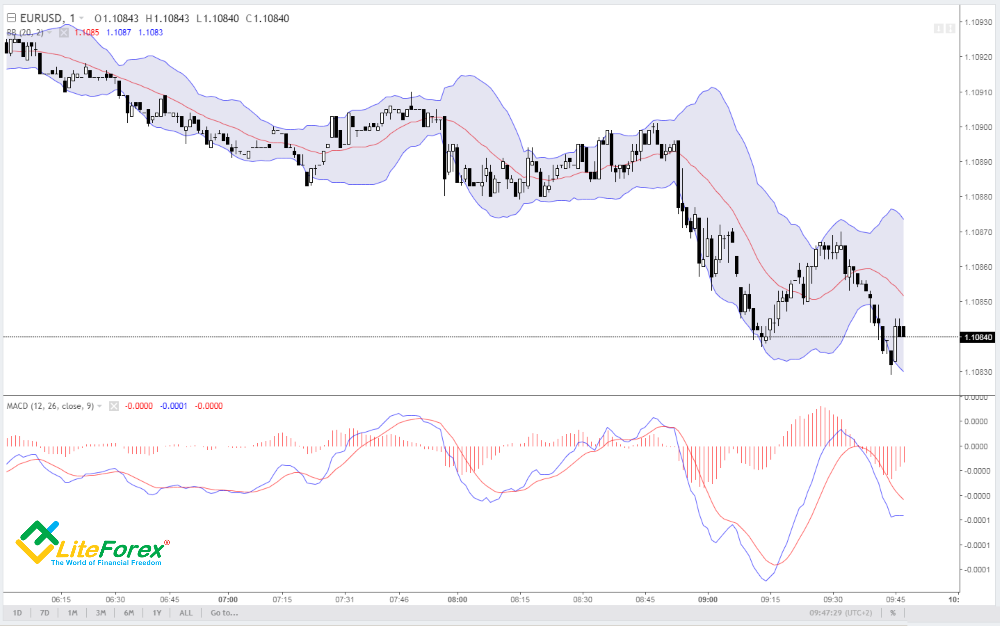
    3. Bollinger Bands: Bollinger Bands ek volatility-based indicator hai jo market ke volatility aur price ke range ko measure karta hai. Ye indicator price ke around ek upper band aur ek lower band banata hai, jo ki price ke fluctuations ko darust karta hai. Jab bands tighten hote hain, ye low volatility ko indicate karte hain, jabki jab bands expand hote hain, ye high volatility ko darust karte hain. Traders price ke movements ko analyze karne aur potential trend reversals ko identify karne ke liye Bollinger Bands ka istemal karte hain.
    4. Relative Strength Index (RSI): RSI ek momentum oscillator hai jo price ke strength aur speed ko measure karta hai. Ye indicator 0 se 100 tak ke range mein hota hai aur overbought aur oversold conditions ko identify karta hai. Jab RSI 70 se zyada ho jata hai, ye overbought market ko indicate karta hai aur jab RSI 30 se kam ho jata hai, ye oversold market ko represent karta hai. Traders RSI ka istemal karke potential trend reversals ko identify karte hain.

    In unique trend indicators ka istemal karke traders market trends ko analyze kar sakte hain aur better trading decisions le sakte hain. Lekin, hamesha yaad rakhein ke kisi bhi indicator ka istemal karne se pehle thorough research aur practice ki zarurat hoti hai, aur sirf indicators par hi nirbhar na rahein.


    • #3 Collapse

      Forex Market mein Unique Trend Indicators

      Forex market, jahan currency pairs ke buying aur selling ka exchange hota hai, aik dynamic aur ever-changing environment hai. Is market mein traders ko consistently profitable rehne ke liye trends ko samajhna aur unhe analyze karna zaroori hai. Trend indicators, jo market ke trend ko samajhne aur predict karne mein madad karte hain, traders ke liye bohot ahem hote hain. Lekin, traditional trend indicators ke ilawa, kuch unique trend indicators bhi hain jo traders ko unconventional aur effective insights provide karte hain.
      1. Volume-Weighted Average Price (VWAP): VWAP, market ke average price ko volume ke sath weight karta hai. Ye indicator, kisi specific time frame ke during market activity ko analyze karta hai aur traders ko average price aur volume ke mutabiq trend ke baray mein maloomat deta hai. VWAP ki madad se traders market ke real-time dynamics ko samajh sakte hain aur trading decisions ko improve kar sakte hain.
      2. Market Profile: Market profile, market ke structure ko visualize karne aur samajhne ke liye ek powerful tool hai. Ye indicator, trading session ke during price aur volume ke distribution ko chart mein represent karta hai. Market profile traders ko market ke key levels aur price action ke patterns ke baray mein insights provide karta hai, jo unhe better trading opportunities dhoondhne mein madad karta hai.
      3. Ichimoku Cloud: Ichimoku Cloud, Japanese origin ka aik complex trend indicator hai jo multiple components se bana hota hai. Ye indicator, trend direction, support aur resistance levels, aur momentum ke baray mein information provide karta hai. Ichimoku Cloud ki madad se traders market ke future trend ki probability ko assess kar sakte hain aur trading strategies ko optimize kar sakte hain.
      4. Bollinger Bands Width: Bollinger Bands Width, traditional Bollinger Bands indicator ka ek modification hai jo volatility ko measure karta hai. Ye indicator, Bollinger Bands ki width ko analyze karta hai aur volatility ke fluctuations ko identify karta hai. Bollinger Bands Width ki madad se traders volatility ke changes ko track kar sakte hain aur trading strategies ko adjust kar sakte hain.
      5. Average True Range (ATR): Average True Range, market ke volatility ko measure karne ke liye ek popular indicator hai. Ye indicator, price movements ka average range calculate karta hai aur volatility ke levels ko determine karta hai. ATR ki madad se traders market ke volatile periods aur choppy conditions ko identify kar sakte hain aur trading positions ko manage kar sakte hain.

      In unique trend indicators ka istemal karke traders forex market ke dynamics ko deeper level par samajh sakte hain aur more informed trading decisions le sakte hain. Lekin, har indicator ki apni limitations hoti hain, is liye traders ko apne trading strategies ko develop karte waqt in indicators ke saath risk management ko bhi consider karna zaroori hai.

      • #4 Collapse

        Forex Market mein Unique Trend Indicators

        Forex market, jahan currencies ki trading hoti hai, woh ek dynamic aur volatile environment hai jahan traders ko naye aur mukhtalif tareeqay se trend analysis karna padta hai. Trend analysis mein indicators ka istemal karna aham hota hai, jo traders ko market ke mukhtalif movements aur trends ka pata lagane mein madad karte hain. Yahan hum kuch unique trend indicators par baat karenge jo forex market mein aapki trading strategy ko mazeed behtar banane mein madadgar sabit ho sakte hain.
        1. Ichimoku Cloud: Ichimoku Cloud ek Japanese trend indicator hai jo price action, support aur resistance levels, aur trend direction ko ek saath dikhata hai. Ye indicator aam tor par lagatar trend ko identify karne mein madad karta hai aur traders ko entry aur exit points ka pata lagane mein help karta hai.
        2. Bollinger Bands: Bollinger Bands ek volatility indicator hai jo price ki volatility ko measure karta hai. Ye indicator price ke around ek upper aur lower band create karta hai jo price ke extremes ko darust karta hai. Traders is indicator ka istemal kar ke price ke reversals aur breakouts ko identify kar sakte hain.
        3. Relative Strength Index (RSI): RSI ek momentum oscillator hai jo overbought aur oversold conditions ko identify karta hai. Ye indicator price ki strength aur weakness ko measure karta hai aur traders ko potential reversals ka pata lagane mein madad karta hai.
        4. MACD (Moving Average Convergence Divergence): MACD ek trend-following momentum indicator hai jo moving averages ke convergence aur divergence ko measure karta hai. Ye indicator trend changes aur momentum ke shifts ko detect karne mein madad karta hai.
        5. Parabolic SAR: Parabolic SAR (Stop and Reverse) ek trend-following indicator hai jo price ke sath sath trend ke direction ko bhi show karta hai. Ye indicator price ke around dots create karta hai jo trend ke reversals ko indicate karte hain.

        In sabhi indicators ke istemal se traders forex market ke movements ko samajh kar apni trading strategy ko mazeed improve kar sakte hain. Lekin yaad rahe ke har indicator ke apne limitations hote hain aur ek indicator ka istemal kar ke trading decision lene se pehle market ke mukhtalif factors ko bhi ghor se dekha jaye.
        • <a href="https://www.instaforex.org/ru/?x=ruforum">InstaForex</a>
        • #5 Collapse

          Forex Market mein trading karna ek challenging lekin exciting kaam hai. Har trader ko apni strategy banane ke liye kuch unique aur effective trend indicators ki zarurat hoti hai. In indicators ki madad se traders market ke mukhtalif trends ko samajh sakte hain aur munafa kamane ke liye sahi waqt pe trade kar sakte hain. Yahan, hum kuch unique trend indicators ke baare mein baat karenge jo forex market mein istemal kiye ja sakte hain:
          1. Ichimoku Kinko Hyo: Ichimoku Kinko Hyo ek Japanese trend indicator hai jo market trends ko analyze karne mein madad deta hai. Is indicator mein kuch alag-alag components shamil hote hain jaise ki Senkou Span A, Senkou Span B, Tenkan-sen, Kijun-sen, aur Chikou Span. In components ki madad se traders trend direction aur momentum ko determine kar sakte hain.
          2. Parabolic SAR (Stop and Reverse): Parabolic SAR bhi ek popular trend indicator hai jo price direction ko indicate karta hai. Is indicator mein dots yaar points form mein price ke upper ya lower side par appear hote hain. Agar dots price ke upper side par hain to yeh uptrend ko indicate karte hain, jabki agar price ke lower side par hain to yeh downtrend ko indicate karte hain.
          3. Bollinger Bands: Bollinger Bands bhi ek powerful trend indicator hai jo volatility aur price range ko measure karta hai. Is indicator mein ek middle band aur do outer bands hote hain jo price ke around move karte hain. Jab market volatile hota hai to Bollinger Bands wide ho jate hain aur jab market stable hota hai to yeh narrow ho jate hain. Traders is indicator ki madad se price ke direction aur volatility ka pata laga sakte hain.
          4. Relative Strength Index (RSI): RSI bhi ek popular trend indicator hai jo price ke momentum ko measure karta hai. Yeh indicator 0 se 100 tak ke range mein hota hai aur overbought aur oversold conditions ko indicate karta hai. Agar RSI 70 se zyada ho jata hai to yeh overbought condition ko darust karta hai, jabki agar RSI 30 se kam ho jata hai to yeh oversold condition ko darust karta hai.

          In unique trend indicators ki madad se traders forex market ke mukhtalif trends ko analyze kar sakte hain aur sahi waqt pe trade kar sakte hain. Lekin yaad rahe ke har indicator apne limitations ke saath ata hai, isliye traders ko in indicators ko sahi taur par samajhna aur istemal karna chahiye.

          اب آن لائن

          Working...
          X