What is Slow Stochastic Trading Indicator
X
  • وقت
  • دکھائیں
Clear All
new posts
  • #1 Collapse

    What is Slow Stochastic Trading Indicator
    Slow Stochastic Trading introduction,

    Slow Stochastic, ek technical analysis indicator hai jo trading mein istemal hota hai. Ye indicator market ke momentum aur overbought/oversold conditions ko samajhne mein madad karta hai. Isay trading strategies mein shamil karke traders apne faislay mein sahayak hone ke liye istemal karte hain.Stochastic indicator, Dr. George Lane ke tajaweez par mabni hai. Isay 0 se 100 tak ke range mein darust karnay ka maqsad hota hai. Yeh do lines se munsalik hota hai: %K line aur %D line.Slow Stochastic, trading mein ek aham tool hai jo market trends aur momentum ko samajhne mein madad karta hai.


    Click image for larger version

Name:	SlowStoch1_602x345.png
Views:	54
Size:	43.0 کلوبائٹ
ID:	12844047

    Components of Slow Stochastic indicator,

    %K Line:
    • %K line, current closing price ko past ki range mein set kiye gaye high aur low prices ke darmiyan adjust karta hai.
    • Iski formula ye hai: %K = [(Current Close - Lowest Low) / (Highest High - Lowest Low)] * 100
    • %K line, market ke momentum ko represent karta hai.
    %D Line:
    • %D line, %K line ki simple moving average hoti hai aur smoothing ke liye istemal hoti hai.
    • Iski formula ye hai: %D = 3-day simple moving average of %K line
    • %D line, %K ki volatility ko kam karti hai aur trends ko samajhne mein madad karti hai.
    How Slow Stochastic Works,

    Slow Stochastic, market ke momentum aur overbought/oversold conditions ko samajhne mein madad karta hai. Yeh traders ko ye batata hai ke market kitna strong hai aur kya woh extreme levels par hai.

    Overbought and Oversold Conditions,
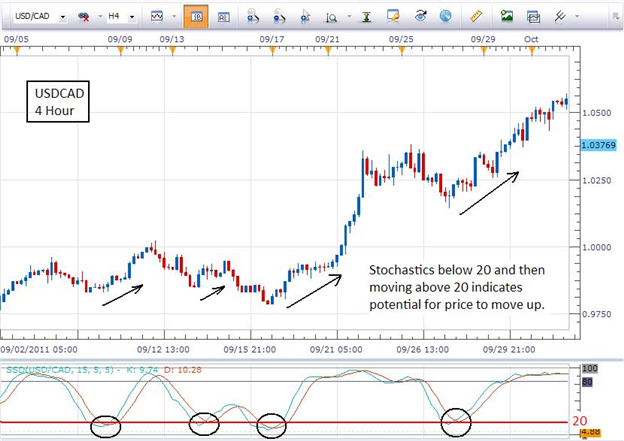
    • %K aur %D lines 0 se 100 ke darmiyan ghoomte hain. Traditionally, 80 ke upar %K ko overbought aur 20 ke niche ko oversold mana jata hai.
    • Overbought condition, market mein zyada khareedari ko darust karti hai aur oversold condition, zyada farokht ko darust karti hai.
    Crossings and Signals,
    • %K line, %D line ko cross karti hai, jo traders ko signals provide karta hai.
    • Agar %K line %D line ko neeche se upar cross karti hai, to ye ek buying signal hai. Wahi agar %K line %D line ko upar se neeche cross karti hai, to ye ek selling signal hai.
    Use of Slow Stochastic in Trading,

    Slow Stochastic ko trading strategies mein istemal karne ke liye kuch muddat par amal karna zaroori hai.
    • Slow Stochastic, existing trend ko confirm karne mein madad karta hai. Agar market uptrend mein hai aur %K line %D line ko upar se cross karti hai, to ye ek aur confirmatory signal hai.
    Divergence and Convergence:
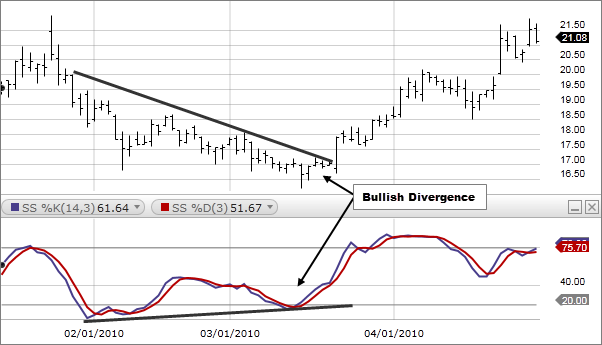
    • Divergence, jab market ki movement aur stochastic lines mein farq hota hai, ko darust karta hai.
    • Convergence, jab market aur stochastic lines ek dusre ke kareeb hote hain, ko indicate karta hai.
    Support and Resistance Levels:
    • Overbought aur oversold conditions, support aur resistance levels ko identify karne mein madad karte hain. Agar market overbought hai aur %K line 80 ko cross karta hai, to yeh ek potential resistance point hai.
    • Slow Stochastic ka istemal karte waqt, kuch zaroori tadabeer aur tahqiqati asoolon ka bhi khayal rakhna zaroori hai.
    • Slow Stochastic ko dusre indicators ke sath istemal karke confirmation hasil ki ja sakti hai. Yeh strategy ko aur bhi mazboot bana sakta hai.Har trading strategy mein risk management ka ehmiyat hota hai. Stop-loss orders ka istemal karke traders apne nuksan ko control mein rakh sakte hain.
    • Different timeframes par Slow Stochastic ka istemal karke traders market ki mukhtalif layers ko samajh sakte hain.
    Click image for larger version

Name:	sddefault.jpg
Views:	52
Size:	69.9 کلوبائٹ
ID:	12844048

    Additional Note,

    Iska istemal karke traders apne faislay mein mazbooti aur asani hasil kar sakte hain. Lekin, har ek trading indicator ki tarah, Slow Stochastic ka istemal bhi mushkil market conditions mein hosla afzai aur doosre confirmatory indicators ke sath karna zaroori hai.

  • <a href="https://www.instaforex.org/ru/?x=ruforum">InstaForex</a>
  • #2 Collapse

    ;;;;Forex Mein Slow Stochastic Trading Indicator;;;;

    Forex mein Slow Stochastic Trading Indicator ek mashhoor technical analysis ka aala hai jo traders istemal karte hain market trends aur momentum ka andaza lagane ke liye. Ye indicator price ki relative momentum ko measure karta hai.
    Slow Stochastic Indicator aam tor par do lines se milta hai: %K line aur %D line. Ye lines aam taur par 0 se 100 ke darmiyan hoti hain.


    ;;;;Forex Mein Slow Stochastic Trading Indicator;;;;

    Slow Stochastic Indicator ka istemal karne ka tareeqa kuch is tarah hai:
    1. Overbought aur Oversold Levels ki Pehchan: Slow Stochastic Indicator ko overbought aur oversold levels ko pehchanne ke liye istemal kia jata hai. Overbought level typically 80 se zyada hota hai aur oversold level 20 se kam hota hai. Jab %K line %D line ko upar se cross karke overbought level ko cross karta hai, ye ek indication hai ke market overbought ho sakta hai aur reversal ka samay aya ho sakta hai. Jab %K line %D line ko niche se cross karke oversold level ko cross karta hai, ye ek indication hai ke market oversold ho sakta hai aur upward reversal ka samay aya ho sakta hai.
    2. Divergence ki Pehchan: Divergence ko identify karne ke liye Slow Stochastic Indicator ka istemal kia jata hai. Agar price trend aur Slow Stochastic Indicator ke trend mein koi difference hota hai, jaise ke price new high banata hai magar Slow Stochastic Indicator naya high nahi banata hai, toh ye ek divergence signal hai aur reversal ka indication ho sakta hai.
    3. Cross Signals: %K line aur %D line ke cross signals bhi istemal kie jate hain. Jab %K line %D line ko upar se cross karta hai, ye ek buy signal hai. Jab %K line %D line ko niche se cross karta hai, ye ek sell signal hai.
    4. Confirmation ke Liye: Slow Stochastic Indicator ko doosre technical indicators aur price action ke saath istemal kia jata hai taake confirm kiya ja sake ke trade ki entry aur exit ke waqt sahi samay hai.

    Ye tareeqay traders ke tajurbaat aur trading strategy par mabni hote hain, aur har trader apne apne tareeqay se Slow Stochastic Indicator ka istemal karta hai.zarurat parne par kisi bhi wazehi ya khas tajziya ke liye, aap technical analysis textbooks, online tutorials, ya trading forums jaise resources se madad le sakte hain. Har trader apne trading style aur risk tolerance ke mutabiq Slow Stochastic Indicator ka istemal karta hai, is liye zaroori hai ke aap is indicator ko apne trading strategy ke saath sahi taur par integrate karein aur iski performance ko test karne ke liye demo account ya backtesting ka istemal karein.
    • #3 Collapse

      What is slow stochastic trading indicator

      Click image for larger version

Name:	n.png
Views:	52
Size:	37.7 کلوبائٹ
ID:	12844067


      "Slow Stochastic" ek prachin tajaweezat aur technical analysis ke kshetra mein ek mahatva purna indicator hai, jo market trends aur price momentum ko samajhne mein madad karta hai. Yeh indicator traders ko market entry aur exit points ka andaza lagane mein madad karta hai.

      Slow Stochastic Trading Indicator Kya Hai: Slow Stochastic ek momentum oscillator hai, jo market ke overbought (jahan price bahut upar gaya ho) ya oversold (jahan price bahut neeche gaya ho) conditions ko pehchanne mein madad karta hai. Yeh indicator market mein hone wale trend reversals ko bhi darust taur par suggest karta hai.

      Slow Stochastic Ke Components:
      1. %K Line: Yeh line current closing price ke basis par calculate hoti hai aur market ki current momentum ko darust taur par darust taur par represent karti hai.
      2. %D Line: %D line %K line ki simple moving average hoti hai aur isse volatility ko kam karke ek smooth line dikhata hai.
      3. Overbought and Oversold Levels: Slow Stochastic 0 se 100 ke beech range mein hota hai. Traditional taur par, 80 ke upar ka level overbought condition ko darust karta hai, jabki 20 ke neeche ka level oversold condition ko represent karta hai.

      Slow Stochastic Ka Istemal: Traders slow stochastic indicator ka istemal karke market mein hone wale potential trend reversals ya trend continuation points ko pehchanne mein madad lete hain. Jab %K line %D line ko neeche se cross karta hai aur 20 level ko upar chala jata hai, toh yeh ek bullish signal ban sakta hai, jo indicate karta hai ki market mein buying interest badh gaya hai. Wahi agar %K line %D line ko upar se cross karta hai aur 80 level ko neeche chala jata hai, toh yeh ek bearish signal ho sakta hai, jo indicate karta hai ki selling pressure badh gaya hai.

      Conclusion: Slow Stochastic trading indicator ka istemal karke traders apne trading strategies ko refine karte hain aur market ke short-term price movements ko samajhne mein madad lete hain. Yeh ek versatile tool hai jo market trends aur momentum ko analyze karne mein sahayak hota hai.


      • #4 Collapse

        Stock market mein kamiyabi hasil karne ka ek tareeqa hai slow stochastic trading indicator ka istemal karna. Ye ek aham tool hai jo investors aur traders ko market trends ko samajhne mein madad deta hai. Is article mein hum slow stochastic trading indicator ke baray mein mukhtasir maloomat faraham karenge.

        Slow Stochastic Kya Hai?

        Slow stochastic trading indicator ek technical analysis tool hai jo market trends ko samajhne aur price movements ka andaza lagane mein madad karta hai. Ye ek momentum oscillator hai jo security ki current price ko uske high aur low prices ke reference par measure karta hai. Slow stochastic trading indicator ka basic maqsad yeh hota hai ke market ki strength aur weakness ko zahir karna.

        Slow Stochastic Kaise Kaam Karta Hai?

        Slow stochastic indicator ko do lines se represent kiya jata hai: %K line aur %D line. %K line, jo ke fast line kehlati hai, security ki current price aur uske high aur low prices ke darmiyan ka farq darust karti hai. %D line, jo ke slow line kehlati hai, %K line ka simple moving average hota hai.

        Slow stochastic indicator ki values 0 aur 100 ke darmiyan hoti hain. Jab %K line %D line ko neeche se cross karta hai, ye ek sell signal hai aur jab %K line %D line ko oopar se cross karta hai, ye ek buy signal hai.

        Slow Stochastic Trading Indicator Ka Istemal Kaise Kiya Jata Hai?

        Slow stochastic trading indicator ka istemal market trends ko samajhne aur entry aur exit points tay karnay mein hota hai. Agar %K line %D line ko neeche se cross karke upar ja rahi hai aur values 20 se neeche hain, to ye ek buy signal hai. Aur agar %K line %D line ko oopar se cross karke neeche ja rahi hai aur values 80 se oopar hain, to ye ek sell signal hai.

        Nateeja

        Slow stochastic trading indicator ek powerful tool hai jo investors aur traders ko market trends ka andaza lagane mein madad karta hai. Iska istemal karke, log behtar trading decisions le sakte hain aur zyada kamiyabi hasil kar sakte hain.

        Is tareeqay se, slow stochastic trading indicator market analysis ke liye ek mufeed aur zaroori tool hai jo investors aur traders ko apni trading strategies ko behtar banane mein madad deta hai.
        • #5 Collapse

          Slow Stochastic Trading Indicator - Dheere Stochastic Trading Indicator:


          Click image for larger version

Name:	download - 2024-02-27T154427.335.jpeg
Views:	51
Size:	23.3 کلوبائٹ
ID:	12844126

          Dheere Stochastic Trading Indicator Kya Hai:

          "Dheere Stochastic" ek technical analysis ka indicator hai jo market trend aur momentum ko evaluate karne mein madad karta hai. Yeh indicator traders ko market ke overbought ya oversold conditions ka pata lagane mein aur trend reversal ko anticipate karne mein madad karta hai.

          Dheere Stochastic Kaise Kaam Karta Hai:

          Dheere Stochastic indicator do lines se mil kar bana hota hai: %K line aur %D line. Yeh indicator price ki current position ko historical price range ke mawafiq measure karta hai.
          1. %K Line:
            • %K line market ke current closing price ko calculate karta hai aur historical price range ke mawafiq normalize karta hai.
            • %K line volatility ko darust karte hue market ki momentum ko darust karta hai.
          2. %D Line:
            • %D line %K line ka simple moving average hota hai, jo market ki general trend ko darust karta hai.
            • %D line ko istemal karke traders trend direction ko confirm karte hain.

          Dheere Stochastic Ke Significance - Ahmiyat:
          1. Overbought aur Oversold Conditions Ka Pata Lagana:
            • Dheere Stochastic traders ko batata hai jab market overbought (zayada khareedne wala) ya oversold (zayada bechne wala) ho sakta hai.
            • Overbought conditions mein price ka girna jazbati hota hai, jabki oversold conditions mein price ka barhna mumkin hai.
          2. Trend Reversals Ka Pehle Pata Lagana:
            • Dheere Stochastic indicator trend reversals ko pehle identify karne mein madad karta hai.
            • Jab %K line %D line ko cross karta hai, yeh ek potential trend reversal ko indicate kar sakta hai.
          3. Divergence Ko Identify Karna:
            • Divergence, yani jab price aur indicator ki movement mein farq hota hai, Dheere Stochastic se identify kiya ja sakta hai.
            • Divergence market trend ke potential changes ko indicate kar sakti hai.
          4. Trading Signals Provide Karna:
            • Dheere Stochastic trading signals generate karta hai, jaise ki buy ya sell signals, jo traders ko market mein entry aur exit points ka pata lagane mein madad karte hain.

          Dheere Stochastic Trading Indicator ek versatile tool hai jo market analysis mein istemal hota hai aur traders ko market conditions ko samajhne mein aur sahi trading decisions lene mein madad karta hai.
          • #6 Collapse

            What is slow stochastic trading indicator


            Slow Stochastic Indicator ek technical analysis tool hai jo traders ko market momentum aur overbought/oversold conditions ka pata lagane mein madad karta hai. Ye indicator primarily price action ko analyze karta hai aur trading signals generate karta hai.


            Is indicator mein do lines hoti hain:
            1. %K Line: Ye line current closing price aur specified time period ke price range ko represent karti hai. Formula ke mutabiq, %K line ko calculate karne ke liye recent closing price ko specified time period ke highest high aur lowest low se compare kiya jata hai.
            2. %D Line (Signal Line): %D line %K line ka smoothed version hota hai. Isko calculate karne ke liye %K line ka simple moving average (SMA) liya jata hai. Commonly, %D line ke liye 3-day ya 5-day SMA ka istemal hota hai.

            Slow Stochastic Indicator ka basic concept ye hai ki jab market uptrend mein hota hai aur prices recent highs ke kareeb hote hain, to indicator overbought conditions indicate karta hai. Jab market downtrend mein hota hai aur prices recent lows ke kareeb hote hain, to indicator oversold conditions indicate karta hai.

            Key Points:
            1. Overbought Conditions: Agar %K line %D line ko top se neeche cross karta hai aur %K line 80 level ko cross karke neeche aata hai, to ye overbought condition ho sakti hai. Isse market mein possible reversal ya trend change ka signal milta hai.
            2. Oversold Conditions: Agar %K line %D line ko neeche se upar cross karta hai aur %K line 20 level ko cross karke upar aata hai, to ye oversold condition ho sakti hai. Isse market mein possible reversal ya trend change ka signal milta hai.
            3. Divergence: Traders slow stochastic indicator mein divergence dhundte hain, jisme price action aur indicator ke movement mein contradiction hoti hai. Divergence, possible trend reversal ko indicate kar sakti hai.
            4. Confirmation: Traders is indicator ke signals ko confirm karne ke liye dusre technical analysis tools aur indicators ka bhi istemal karte hain, jaise ki trend lines, moving averages, ya support/resistance levels.

            Slow Stochastic Indicator market volatility aur price trends ko analyze karne mein madad karta hai, lekin iska istemal samajhdar taur par karna important hai. Yeh ek tool hai aur iske saath prudent risk management aur confirmatory signals ka dhyan rakhna zaroori hai.
            • #7 Collapse


              Slow Stochastic Trading Indicator Kya Hai?

              Slow Stochastic trading indicator ek ahem technical analysis tool hai jo traders ko market ke momentum aur trend ki samajhne mein madad karta hai. Yeh indicator price ki current position ko uski past price range ke sath compare karta hai aur isse traders ko overbought ya oversold conditions ka pata lagta hai. Slow Stochastic indicator ka istemal traders market ke entry aur exit points ka faisla karne mein madad ke liye karte hain.
              Click image for larger version

Name:	stochastic_double_slow.png
Views:	48
Size:	15.6 کلوبائٹ
ID:	12844190
              Slow Stochastic Indicator Ki Tashkeel

              Slow Stochastic indicator ki tashkeel mein do lines hoti hain:
              1. %K Line: Yeh line current price ko uski past price range ke sath compare karti hai. %K line ka formula is tarah hota hai: %K = ((Close - Lowest Low) / (Highest High - Lowest Low)) * 100
              2. %D Line: Yeh line %K line ka moving average hota hai. Iska maqsad current price ki volatility ko kam karna aur signal ko smooth karna hota hai. %D line ko usually 3-period moving average se calculate kiya jata hai.

              Slow Stochastic Indicator Ka Istemal

              Slow Stochastic indicator ka istemal traders market ke overbought aur oversold conditions ka pata lagane ke liye karte hain. Jab %K line 80 ke ooper hoti hai aur %D line ko cross kar ke neeche jaati hai, to yeh market ko overbought indicate karta hai aur traders ko bechne ka signal deta hai. Ussi tarah, jab %K line 20 ke neeche hoti hai aur %D line ko cross kar ke upar jaati hai, to yeh market ko oversold indicate karta hai aur traders ko khareedne ka signal deta hai.

              Slow Stochastic Indicator Ke Faide

              Slow Stochastic indicator ke istemal se traders ko kuch faide milte hain:
              1. Trend Ke Samajh: Indicator ke istemal se traders ko market ke trend aur momentum ki samajh mein madad milti hai.
              2. Entry Aur Exit Points: Indicator traders ko potential entry aur exit points provide karta hai, jisse unka trading strategy improve hota hai.
              3. Overbought Aur Oversold Conditions Ka Pata: Indicator ke istemal se traders ko market ke overbought aur oversold conditions ka pata lagta hai, jisse unka risk management behtar hota hai.

              Slow Stochastic trading indicator ek mufeed tool hai jo traders ko market ke momentum aur trend ki samajhne mein madad karta hai. Lekin, hamesha yaad rahe ke kisi bhi technical indicator ka istemal karte waqt, dusre technical aur fundamental factors ko bhi madde nazar rakha jaye aur sahi risk management ke sath kaam kiya jaye.

              • #8 Collapse

                Slow Stochastic Trading Indicator

                ek technical analysis tool hai jo trading market mein use kiya jata hai. Is indicator ki madad se trader market ki trend aur price action ko samajh sakta hai. Slow Stochastic Trading Indicator ka use karke trader market ki entry aur exit points ko bhi decide kar sakta hai.
                Click image for larger version

Name:	images (1).png
Views:	52
Size:	18.4 کلوبائٹ
ID:	12844298

                Stochastic Oscillator ek momentum indicator hai jo market ki trend aur price action ko measure karta hai. Is indicator ki madad se trader market ki overbought aur oversold levels ko bhi determine kar sakta hai. Stochastic Oscillator ko 1950s mein George Lane ne develop kiya tha.

                Slow Stochastic Oscillator Working.

                Slow Stochastic Oscillator bhi Stochastic Oscillator ka hi ek version hai. Is indicator mein Stochastic Oscillator ke slow moving averages ka use kiya jata hai. Is indicator ke slow moving averages ki wajah se iska name Slow Stochastic Oscillator rakha gaya hai.

                Slow Stochastic Trading Indicator Strategy.

                Slow Stochastic Trading Indicator ka use karne ke liye trader ko iska formula samajhna hoga. Slow Stochastic Oscillator ka formula niche diya gaya hai:

                %K = (Current Close - Lowest Low) / (Highest High - Lowest Low) * 100
                %D = 3-day SMA of %K

                Is formula ke anusar, Slow Stochastic Oscillator mein 14-day period ka use kiya jata hai. Is indicator ke %K aur %D lines hote hain jo 0 se 100 ke beech mein move karte hain.

                Slow Stochastic Trading Indicator ka use karke trader market ki trend aur price action ko samajh sakta hai. Agar %K line %D line ko upar se cross karta hai to ye ek buy signal hai aur agar %K line %D line ko neeche se cross karta hai to ye ek sell signal hai.

                Click image for larger version

Name:	images.png
Views:	44
Size:	21.5 کلوبائٹ
ID:	12844299

                Slow Stochastic Trading Indicator ek useful tool hai jise trader market analysis ke liye use karte hain. Is indicator ki madad se trader market ki trend aur price action ko samajh sakta hai. Slow Stochastic Trading Indicator ke use se trader market mein entry aur exit points ko bhi decide kar sakta hai.


                • #9 Collapse

                  Slow Stochastic Trading Indicator

                  Introduction


                  Slow Stochastic is a significant technical analysis tool widely used in financial markets, including stocks, forex, and commodities. This indicator assists traders in identifying potential trend reversals and overbought or oversold conditions in an asset's price. The Slow Stochastic Trading Indicator is an extension of the original Stochastic Oscillator, designed to provide a smoother representation of market momentum and reduce false signals.

                  Click image for larger version

Name:	images (16).png
Views:	46
Size:	21.5 کلوبائٹ
ID:	12844313

                  Understanding Slow Stochastic

                  The Slow Stochastic comprises two lines – %K and %D – and is calculated using the closing prices of a specific time period. The %K line represents the current closing price relative to the highest and lowest prices over a set period. Meanwhile, the %D line is a moving average of the %K line and further smoothens the fluctuations. Typically, a common setting for Slow Stochastic involves a 14-day time frame, but this can be adjusted based on a trader's preference.

                  Slow Stochastic values range from 0 to 100, with levels above 80 indicating overbought conditions and levels below 20 suggesting oversold conditions. These extreme levels often signify potential reversals in the price trend. Traders commonly use the crossover of the %K and %D lines, along with overbought/oversold conditions, to make informed trading decisions.

                  Click image for larger version

Name:	images (17).png
Views:	44
Size:	20.3 کلوبائٹ
ID:	12844314

                  Trading Strategies using Slow Stochastic
                  • a. Trend Reversal Signals: Slow Stochastic is effective in identifying potential trend reversals. When the %K line crosses above the %D line, it generates a bullish signal, suggesting a potential upward trend. Conversely, a crossover where %K falls below %D indicates a bearish signal, signaling a potential downtrend. Traders often wait for these crossovers to confirm a change in market sentiment.
                  • b. Overbought and Oversold Conditions: Overbought and oversold conditions are key aspects of Slow Stochastic analysis. When the indicator's values exceed 80, the market is considered overbought, indicating a potential reversal to the downside. On the other hand, values below 20 suggest oversold conditions, signaling a potential reversal to the upside. Traders may use these extreme levels to anticipate changes in the price direction.
                  Click image for larger version

Name:	images (18).png
Views:	44
Size:	3.8 کلوبائٹ
ID:	12844315
                  • c. Divergence: Divergence occurs when the price of an asset and the Slow Stochastic indicator move in opposite directions. This can be a powerful signal of a potential trend reversal. For instance, if the price is making new highs, but the Slow Stochastic fails to reach new highs, it could indicate weakening upward momentum. Conversely, if the price is making new lows, but the Slow Stochastic does not follow suit, it may signal a weakening downtrend.
                  • #10 Collapse


                    What is Slow Stochastic Trading Indicator?

                    Answer:

                    Slow Stochastic Trading Indicator Kya Hai:

                    Slow Stochastic Trading Indicator ek popular technical analysis tool hai jo forex trading mein istemal hota hai. Ye indicator price ke momentum aur trend reversals ko identify karne mein madad karta hai.

                    Kis Tarah Kaam Karta Hai:

                    1. Banawat:

                    Slow Stochastic Indicator do lines se bana hota hai: %K aur %D. %K line current closing price ka relationship measure karti hai past n periods ke highest aur lowest prices ke saath, jabke %D line %K line ka moving average hota hai.

                    2. Overbought aur Oversold Levels:

                    Slow Stochastic Indicator overbought (80 ke upar) aur oversold (20 ke neeche) levels ko indicate karta hai. Jab %K line overbought ya oversold levels ko cross karta hai, toh yeh trend reversal ka potential signal hota hai.

                    Tabeer aur Trading:

                    1. Momentum aur Trend Reversals:

                    Slow Stochastic Indicator price ke momentum ko measure karta hai aur trend reversals ko anticipate karta hai. Jab %K aur %D lines ek doosre ko cross karte hain, yeh trend direction mein changes ka signal deta hai.

                    2. Divergence:

                    Divergence analysis mein, Slow Stochastic Indicator ke signals ko doosre technical indicators ke saath compare kiya jata hai. Agar price higher highs banata hai lekin %K aur %D lines lower highs banate hain, toh yeh bearish divergence signal ho sakta hai, aur vice versa.

                    Click image for larger version

Name:	image_search_1709042314559.png
Views:	52
Size:	146.4 کلوبائٹ
ID:	12844326

                    Trading Strategy:


                    1. Crossing Signals:

                    Traders typically %K aur %D lines ke cross ko trading signals ke liye istemal karte hain. Agar %K line %D line ko upar se cross karti hai, toh yeh ek bullish signal hai, jabke agar %K line %D line ko neeche se cross karti hai, toh yeh ek bearish signal hai.

                    2. Overbought aur Oversold Levels:

                    Overbought aur oversold levels par bhi trading strategies banayi ja sakti hain. Jab indicator overbought levels ko touch karta hai, toh traders short positions enter kar sakte hain, aur jab oversold levels ko touch karta hai, toh traders long positions enter kar sakte hain.

                    Nateeja:

                    Slow Stochastic Trading Indicator, forex traders ke liye ek important tool hai trend reversals aur momentum ke assess karne mein. Lekin, hamesha market context aur doosre technical indicators ko bhi tajziya karna zaroori hai trading decisions ke liye.
                    • #11 Collapse

                      Slow Stochastic Trading Indicator -


                      Click image for larger version

Name:	b.jpeg
Views:	45
Size:	23.3 کلوبائٹ
ID:	12844340
                      1. Introduction: Slow Stochastic Trading Indicator ek technical analysis tool hai jo market trends aur momentum ko assess karne mein madad karta hai. Ye indicator price ki movement ko analyze karke potential entry aur exit points identify karta hai.

                      2. Stochastic Indicator Ki Tafseelat:
                      • Slow Stochastic Indicator, market mein momentum ko measure karne ke liye istemal hota hai.
                      • Ye indicator price ki current position ko compare karta hai uski recent trading range ke saath.

                      3. Components of Slow Stochastic:
                      • %K Line: %K line current price ko recent trading range ke hisaab se darust karti hai.
                      • %D Line: %D line %K line ki moving average hoti hai aur isse smoothness milti hai.

                      4. Entry Points:
                      • Overbought and Oversold Zones: Slow Stochastic 0% se 100% tak ki scale par hota hai. Generally, agar %K line 80% ko cross kare toh ye overbought signal hai aur agar 20% ko cross kare toh ye oversold signal hai.
                      • Crossover: Buy signal tab generate hota hai jab %K line %D line ko neeche se upar cross kare, aur sell signal tab hota hai jab %K line %D line ko oopar se neeche cross kare.

                      5. Setting Stop Loss and Take Profit:
                      • Stop Loss: Set karein stop loss level jise risk control ho sake, jese ke recent price action ya support/resistance levels.
                      • Take Profit: Take profit level ko set karein, jismein profit secure ho sake. Ye level historical price movement ya resistance/support ke basis par decide kiya ja sakta hai.

                      6. Risk Management:
                      • Risk-Reward Ratio: Apni trade ki risk-reward ratio ko dhyan mein rakhein, taki aapko loss hone par bhi overall profit mil sake.

                      7. Monitoring aur Adaptation:
                      • Apni trade ko monitor karte rahiye aur market conditions ke mutabiq apne trading plan ko adjust karein.

                      Slow Stochastic Indicator ek versatile tool hai jo market trends aur reversals ko identify karne mein madad karta hai. Lekin, hamesha dhyan rakhein ke kisi bhi indicator ko standalone na samjha jaye aur sath mein aur bhi factors ko consider kiya jaye trading decisions ke liye.
                      • #12 Collapse


                        Slow Stochastic Trading Indicator

                        1. Slow Stochastic Indicator Ki Tafseelat
                        • Slow Stochastic Indicator Ki Tareef: Slow Stochastic Indicator ek technical analysis tool hai jo traders ko market trends aur momentum ko analyze karne mein madad deta hai. Ye indicator price movements ko compare karta hai current price range ke saath.
                        • Ahmiyat: Slow Stochastic Indicator ka istemal traders ko overbought aur oversold conditions identify karne mein madad karta hai, jo unhein potential trading opportunities provide karta hai.

                        2. Slow Stochastic Indicator Ka Tareeqa Kar
                        • Calculation Method: Slow Stochastic Indicator ko calculate karne ke liye, recent price ka closing price aur price range ko consider kiya jata hai. Phir iska result 0 se 100 tak ka ek range mein aata hai.
                        • Components: Slow Stochastic Indicator do lines se bana hota hai: %K line aur %D line. %K line current price ke basis par calculate hoti hai jabke %D line %K line ka moving average hoti hai.

                        Slow Stochastic Indicator Ke Istemal
                        • Overbought Aur Oversold Conditions: Slow Stochastic Indicator ka istemal karke traders overbought aur oversold conditions ko identify karte hain. Jab %K line 80 ke upar jati hai, toh ye overbought condition indicate karta hai aur jab %K line 20 ke neeche jati hai, toh ye oversold condition indicate karta hai.
                        • Divergence Analysis: Slow Stochastic Indicator ko divergence analysis ke liye bhi istemal kiya jata hai. Agar price uptrend mein hai aur %K line downtrend mein hai, toh ye bearish divergence signal hai.

                        Slow Stochastic Indicator Ka Istemal Trading Mein
                        • Entry Aur Exit Points: Slow Stochastic Indicator traders ko entry aur exit points tay karne mein madad karta hai. Agar %K line %D line ko cross karke upar se neeche jaati hai, toh ye selling signal hai, jabke agar %K line %D line ko cross karke neeche se upar jaati hai, toh ye buying signal hai.
                        • Confirmation Ke Liye: Slow Stochastic Indicator ko confirm karne ke liye traders doosre technical indicators ke saath istemal karte hain jaise ki moving averages aur volume indicators.

                        Conclusion


                        Slow Stochastic Indicator ek important technical analysis tool hai jo traders ko market trends aur momentum ko analyze karne mein madad deta hai. Is indicator ka istemal karke traders overbought aur oversold conditions ko identify kar sakte hain aur potential trading opportunities tay kar sakte hain. Lekin, traders ko is indicator ke signals ko confirm karne ke liye doosre technical indicators ke saath istemal karna chahiye aur risk management ka bhi khaas khayal rakhna chahiye jab wo Slow Stochastic Indicator ke sath trading karte hain.


                        Last edited by ; 28-02-2024, 06:29 PM.
                        • #13 Collapse

                          Forex Trading Main Slow Stochastic Indicator

                          Forex trading mein Slow Stochastic Indicator ek ahem tool hai jo traders ko market trends aur entry/exit points ka andaza lagane mein madad deta hai.
                          Click image for larger version

Name:	images.jpeg
Views:	21
Size:	100.9 کلوبائٹ
ID:	12885932
                          Tareef

                          Slow Stochastic Indicator ek technical analysis tool hai jo market ka momentum aur overbought/oversold conditions ko samajhne mein madad deta hai. Yeh indicator usually ek range-bound oscillator ke tor par istemal kiya jata hai.

                          Slow Stochastic Indicator Ki Tashkeel

                          Slow Stochastic Indicator do lines se milta hai: %K aur %D. %K line, jo bhi current closing price aur price range ko measure karta hai, jabke %D line %K ki moving average hoti hai.

                          Slow Stochastic Indicator Ke Signals

                          Slow Stochastic Indicator ke signals ko do tarah se interpret kiya ja sakta hai: overbought aur oversold. Jab %K line %D line ko upar se cross karke niche ati hai, ye ek sell signal hai aur yeh overbought condition ko darust karti hai. Jab %K line %D line ko niche se cross karke upar ati hai, ye ek buy signal hai aur yeh oversold condition ko darust karti hai.

                          Kaise Kaam Karta Hai?
                          ​​​​​​​Slow Stochastic indicator, price movements ko analyze karke ek oscillator produce karta hai jo 0 se 100 tak ke range mein hota hai. Is indicator mein do lines hoti hain: %K line aur %D line. %K line, market ke current closing price aur ek nishchit samay ka past price ke darmiyan ka relationship darust karti hai. Jabke %D line, %K line ka moving average hota hai.

                          Slow Stochastic Indicator Ke Istemal Ka Tareeqa

                          Slow Stochastic Indicator ko istemal karne ke liye, traders ko market trends aur price movements ko samajhna zaroori hai. Iske baad, wo indicator ki signals ko confirm karte hue apne trades execute karte hain.

                          Faide

                          Slow Stochastic Indicator ke istemal se traders ko market ka trend samajhne mein asani hoti hai aur overbought/oversold conditions ko pehchanne mein madad milti hai. Iske saath hi, ye indicator market entry aur exit points ka bhi andaza lagane mein madadgar sabit hota hai.

                          Nuqsanat

                          Har ek trading indicator ki tarah, Slow Stochastic Indicator ke bhi kuch nuqsanat hain. Ye lagging indicator hai, iska matlab hai ke ye price movements ke peechay reh jata hai, jis se traders ko late entry ya exit ka khatra ho sakta hai.

                          Slow Stochastic Indicator Ka Istemal Strategy Ke Sath

                          Slow Stochastic Indicator ko trading strategy ke hissay ke tor par istemal kiya ja sakta hai. Kuch traders isko dusre indicators ke saath combine karte hain taake more accurate signals hasil kiye ja sakein.

                          Slow Stochastic Indicator Ki Limitations
                          Har ek trading indicator ki tarah, Slow Stochastic indicator ki bhi kuch limitations hain. Kuch key limitations shamil hain:False signals ka risk, especially jab market mein high volatility ho.Choppy market conditions mein kam karne ki samasya.Lagging nature, jo kuch cases mein late entry ya exit ka sabab banta hai.

                          Risk Management

                          Har trading strategy ke sath sahi risk management ka hona zaroori hai. Slow Stochastic Indicator ke signals par pura bharosa kar ke trades execute karne se pehle, traders ko apne risk tolerance aur position size ka bhi khayal rakhna chahiye.

                          Slow Stochastic Indicator Ke Mazid Istemal

                          Slow Stochastic Indicator ke mukhtalif settings aur timeframes par istemal kiya ja sakta hai, jaise ke shorter timeframes for day trading ya longer timeframes for swing trading. Har trader apne preference ke mutabiq iska istemal karta hai.
                          • #14 Collapse

                            **Slow Stochastic Trading Indicator Kya Hai?**
                            Slow Stochastic trading indicator ek popular momentum oscillator hai jo market ke overbought aur oversold conditions ko identify karne mein madad karta hai. Yeh indicator traders ko market trends aur potential reversals ke signals provide karta hai. Slow Stochastic indicator ko samajhna aur sahi tareeke se use karna traders ke liye profitable trading strategies develop karne mein madadgar ho sakta hai. Aayiye detail mein dekhtay hain ke Slow Stochastic trading indicator kya hota hai aur isse trading mein kaise use kiya jata hai.

                            **Slow Stochastic Indicator Ki Pehchaan:**

                            Slow Stochastic indicator ko George Lane ne develop kiya tha aur yeh momentum oscillator hai jo price movements ki speed aur direction ko measure karta hai. Is indicator mein do lines hoti hain: %K line aur %D line. Yeh lines market ke momentum aur potential reversals ko identify karne mein help karti hain.

                            1. **%K Line:**
                            - %K line current closing price aur specified period ke lowest aur highest prices ke beech ka relationship ko measure karti hai.
                            - Formula: %K = [(Current Close - Lowest Low) / (Highest High - Lowest Low)] x 100

                            2. **%D Line:**
                            - %D line %K line ka moving average hoti hai, jo ki typically 3-period simple moving average hota hai.
                            - %D line ko smoothing effect provide karta hai aur signals ko more reliable banata hai.

                            **Slow Stochastic Indicator Ka Use:**

                            1. **Overbought Aur Oversold Conditions:**
                            - Slow Stochastic indicator ko overbought aur oversold conditions ko identify karne ke liye use kiya jata hai. Jab %K aur %D lines 80 ke above level par hoti hain, to market overbought condition mein hoti hai aur selling pressure ka indication hota hai. Jab yeh lines 20 ke below level par hoti hain, to market oversold condition mein hoti hai aur buying pressure ka indication hota hai.

                            2. **Crossovers:**
                            - %K line aur %D line ke crossovers trading signals generate karte hain. Jab %K line %D line ko upar se niche cross karti hai, to yeh sell signal hota hai. Jab %K line %D line ko niche se upar cross karti hai, to yeh buy signal hota hai. Crossovers ko potential trend reversals ke signals ke taur par dekha jata hai.

                            3. **Divergence Analysis:**
                            - Divergence analysis Slow Stochastic indicator ko use karke market trends aur reversals ko identify karne mein madad karta hai. Agar price new highs bana rahi hai lekin %K line aur %D line lower highs bana rahi hain, to yeh bearish divergence hota hai aur potential reversal ka signal hota hai. Similarly, agar price new lows bana rahi hai lekin %K line aur %D line higher lows bana rahi hain, to yeh bullish divergence hota hai aur potential buying opportunities ko indicate karta hai.

                            4. **Trend Confirmation:**
                            - Slow Stochastic indicator trend confirmation ke liye bhi use hota hai. Agar %K aur %D lines overbought ya oversold conditions ko indicate kar rahi hain, to traders trend continuation ya reversal ke signals ko confirm karne ke liye additional technical indicators aur analysis ka use kar sakte hain.

                            **Risk Management:**

                            - Slow Stochastic indicator ko use karte waqt risk management zaroori hai. Stop-loss aur take-profit levels ko define karein aur trading capital ka sirf ek chhota portion (usually 1-2%) risk karein. Market conditions aur indicator signals ko closely monitor karna bhi important hai.

                            **Conclusion:**

                            Slow Stochastic trading indicator ek powerful tool hai jo market ke overbought aur oversold conditions ko identify karne aur potential reversals ko signal karne mein madad karta hai. %K aur %D lines ke crossovers, divergence analysis, aur trend confirmation ke through traders effective trading decisions le sakte hain. Sahi tareeke se use karke aur risk management ko follow karte hue, Slow Stochastic indicator forex trading mein significant advantage provide kar sakta hai.
                            • <a href="https://www.instaforex.org/ru/?x=ruforum">InstaForex</a>
                            • #15 Collapse

                              Forex Mein Slow Stochastic Trading Indicator:!:!:!:!

                              Forex mein Slow Stochastic Trading Indicator aik technical analysis tool hota hai jo traders use karte hain market ka momentum aur overbought ya oversold conditions ko assess karne ke liye. Is indicator ko "stochastic oscillator" bhi kaha jata hai.

                              Slow Stochastic Indicator do lines par mushtamil hota hai:
                              1. %K Line: Jo actual closing price aur price range ka comparison karti hai.
                              2. %D Line: Jo %K line ka simple moving average hota hai, aur zyada smooth aur stable signal provide karta hai.
                              Forex Mein Slow Stochastic Trading Indicator Ke Components:!:!:!:!

                              Slow Stochastic Indicator ke kuch important components hain jo isko kaam karne mein madad dete hain:
                              1. %K Line: Ye main line hoti hai jo price ka comparison karti hai. Isko calculate karne ka formula hai:

                                %K=(Current Close−Lowest Low)(Highest High−Lowest Low)×100\%K = \frac{{(Current\ Close - Lowest\ Low)}}{{(Highest\ High - Lowest\ Low)}} \times 100%K=(Highest High−Lowest Low)(Current Close−Lowest Low)​×100
                                • Current Close: Current period ki closing price.
                                • Lowest Low: Chosen period ke lowest low price.
                                • Highest High: Chosen period ke highest high price.
                              2. %D Line: Ye %K line ka simple moving average (SMA) hota hai. Usually, 3-period SMA use kiya jata hai. Formula hai:

                                %D=SMA(%K,3 periods)\%D = SMA(\%K, 3\ periods)%D=SMA(%K,3 periods)
                              3. Time Period: Ye wo duration hoti hai jo lowest low aur highest high ko calculate karne ke liye use hoti hai. Forex trading mein 14-period time frame commonly use hota hai.
                              4. Overbought and Oversold Levels: In levels ko define karne ke liye usually 80 aur 20 use hote hain. Jab %K aur %D lines 80 se zyada hoti hain toh market overbought hota hai, aur jab ye lines 20 se kam hoti hain toh market oversold hota hai.
                              5. Crossovers: Jab %K line %D line ko upar ya neeche cross karti hai toh wo trading signals generate karti hain.
                                • Bullish Signal (Buy Signal): Jab %K line %D line ko neeche se upar cross karti hai.
                                • Bearish Signal (Sell Signal): Jab %K line %D line ko upar se neeche cross karti hai.
                              Ye components milkar Slow Stochastic Indicator banate hain jo traders ko market trends aur price movements ko samajhne mein madad karte hain.

                              اب آن لائن

                              Working...
                              X