Rounding Bottom Pattern in forex trading....
X
  • وقت
  • دکھائیں
Clear All
new posts
  • #1 Collapse

    Rounding Bottom Pattern in forex trading....
    1. Rounding Bottom Pattern Ki Pehchan

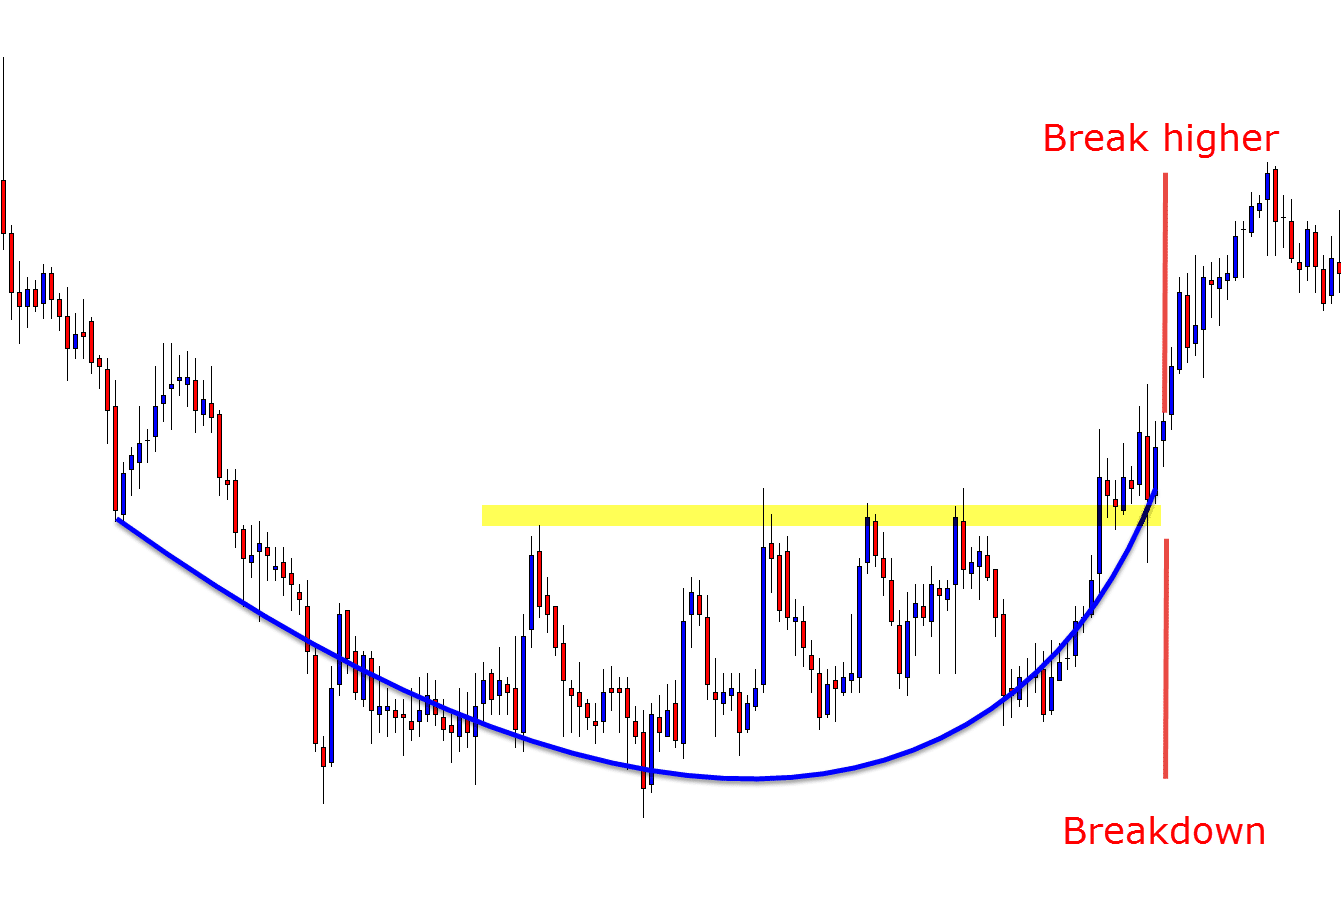
    Rounding Bottom pattern ko identify karne ke liye, traders ko price chart par ek U-shaped curve dhundhna hota hai. Yeh curve typically downtrend ke baad dekha jata hai aur ek gradual recovery ko indicate karta hai. Is curve ka bottom point downtrend ke neeche hota hai aur phir gradual recovery ke baad price wapas upar ki taraf mudti hai. Traders ko dhyan dena chahiye ke is pattern mein curve ka shape smooth hona chahiye, agar curve mein kisi bhi jagah sharp angles ya abrupt changes hote hain toh woh actual Rounding Bottom pattern nahi ho sakta.

    2. Rounding Bottom Ka Maqsad

    Rounding Bottom pattern ka maqsad hota hai indicate karna ke asset ka price downtrend se recovery shuru kar chuka hai aur ab upar ki taraf jaane ka mood hai. Yeh pattern market mein ek reversal ko signal karta hai aur traders ko bullish trend ke possibility ke baare mein sochne par majboor karta hai. Is pattern ko identify karne se pehle traders ko confirmatory signals aur indicators ka bhi dhyaan dena chahiye taake wo sahi maayno mein pattern ko identify kar sakein aur false signals se bach sakein.

    3. Rounding Bottom Ka Tareeqa-e-Amal

    Is pattern ko identify karne ke liye, traders ko price movements ko closely observe karna hota hai. Is pattern mein ek U-shaped curve ki shape hoti hai jisme price initially downtrend mein hoti hai, phir gradual recovery ke baad ek saath jhuk kar wapas upar ki taraf mudti hai. Traders ko ye bhi dhyan mein rakhna chahiye ke Rounding Bottom pattern ka bottom point pehle downtrend ke neeche hota hai aur phir gradual recovery ke baad price wapas upar ki taraf jaati hai, isliye is pattern ko identify karne ke liye patience aur observation ki zaroorat hoti hai.

    4. Rounding Bottom Aur Market Psychology

    Rounding Bottom pattern ki interpretation mein market psychology ka bhi ek important role hota hai. Is pattern ko dekh kar traders samajhte hain ke market mein bearish sentiment khatam ho chuki hai aur bullish sentiment shuru ho rahi hai. Yeh indicate karta hai ke investors ke beech optimism badh rahi hai. Lekin traders ko dhyan mein rakhna chahiye ke Rounding Bottom pattern sirf ek indicator hai, aur doosri factors jaise fundamental analysis aur overall market conditions ko bhi consider karna important hai pattern ko confirm karne ke liye.

    5. Rounding Bottom Ki Importance

    Rounding Bottom pattern traders ke liye ek important tool hai kyun ke isse future price movements ka idea milta hai. Jab traders is pattern ko identify karte hain, toh unhe ek potential trend reversal ka indication milta hai, jisse wo apne trading strategies ko adjust kar sakte hain. Is pattern ko identify karne ke liye traders ko market ke overall trend ko analyze karna hota hai saath hi saath doosre technical indicators aur confirmatory signals ka bhi istemal karna hota hai taake wo accurate predictions kar sakein.

    6. Rounding Bottom Ka Time Frame

    Rounding Bottom pattern ka time frame kisi bhi timeframe par ho sakta hai, jaise kuch weeks ya phir months ke liye. Is pattern ko identify karne mein time frame ka dhyaan rakhna zaroori hai taake sahi prediction ki ja sake. Chhoti time frames par Rounding Bottom pattern ki identification karna thoda mushkil ho sakta hai kyunki volatility ke wajah se false signals bhi generate ho sakte hain. Isliye traders ko time frame ko choose karte waqt volatility aur overall market conditions ka bhi dhyaan dena chahiye.

    7. Rounding Bottom Ka Confirmation

    Rounding Bottom pattern ko confirm karne ke liye traders doosri indicators aur tools ka bhi istemal karte hain jaise volume, moving averages, aur price action. Jab ye confirmatory indicators bhi Rounding Bottom pattern ko support karte hain, toh traders confident hote hain apne trading decisions mein. Is pattern ko confirm karne ke liye traders ko doosre technical indicators ka bhi analysis karna hota hai taake wo false signals se bach sakein aur sahi trading decisions le sakein.

    8. Rounding Bottom Vs. Double Bottom

    Rounding Bottom pattern ko kabhi kabhi Double Bottom pattern ke saath compare kiya jata hai, lekin dono mein difference hota hai shape aur structure mein. Double Bottom pattern mein typically do bottoms hote hain jo ek dusre se alag hote hain, jabki Rounding Bottom mein ek gradual curve hoti hai. Traders ko dhyan mein rakhna chahiye ke dono patterns ka interpretation alag hota hai aur sahi identification ke liye traders ko price movements aur pattern ka structure closely analyze karna chahiye.

    9. Rounding Bottom Aur Trading Strategies

    Traders Rounding Bottom pattern ko dekh kar apni trading strategies ko modify karte hain. Jab ye pattern identify hota hai, toh traders long positions lena shuru karte hain ya phir existing positions ko hold karte hain taake unhe potential profits mil sakein. Lekin traders ko dhyan mein rakhna chahiye ke pattern sirf ek indicator hai aur doosre factors jaise overall market conditions aur fundamental analysis bhi consider karna important hai trading decisions lene ke liye.

    10. Rounding Bottom Aur Risk Management

    Is pattern ki understanding traders ko better risk management karne mein madad karta hai. Jab traders is pattern ko samajhte hain, toh wo apne stop loss levels ko set kar sakte hain aur apne positions ko effectively manage kar sakte hain. Traders ko apne trading positions ko enter karte waqt risk reward ratio ka bhi dhyaan dena chahiye taake wo apne losses ko minimize kar sakein aur potential profits maximize kar sakein.

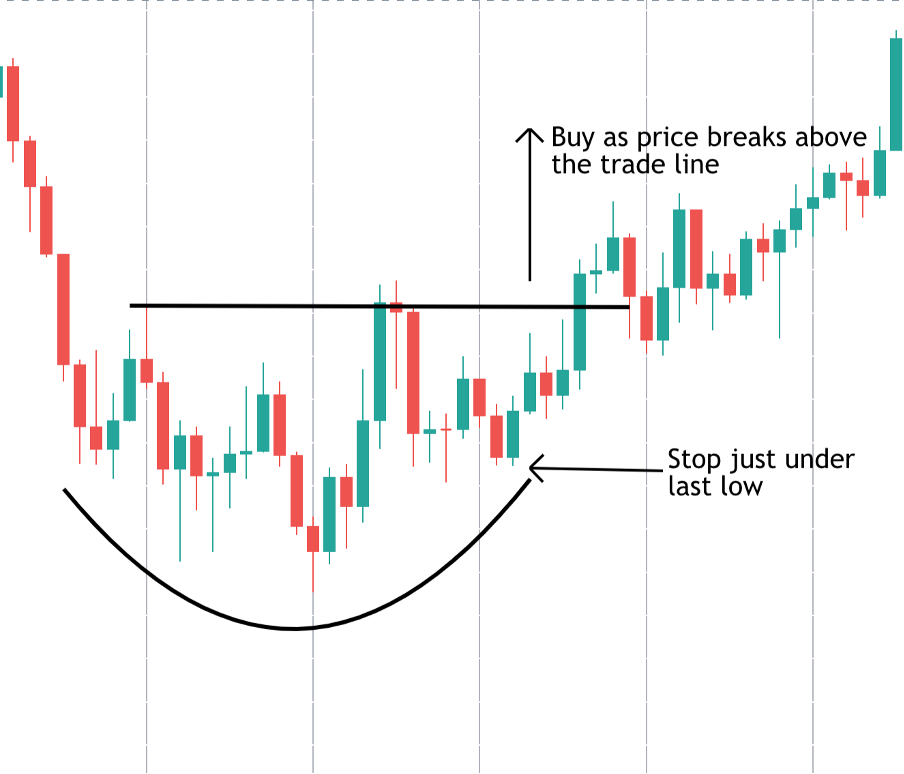
    11. Rounding Bottom Aur Entry Points

    Traders is pattern ko dekh kar apne entry aur exit points ko bhi decide karte hain. Jab ye pattern confirm ho jata hai, toh traders apne entry points ko identify karke apni positions ko enter karte hain taake wo potential profits kamayein. Lekin traders ko entry points ko choose karte waqt overall market conditions aur pattern ka confirmation bhi consider karna important hai taake wo sahi trading decisions le sakein.

    12. Rounding Bottom Aur Stop Loss

    Stop loss levels ko set karne mein bhi Rounding Bottom pattern ki importance hoti hai. Traders apne stop loss levels ko set karke apne positions ko protect karte hain aur apne losses ko minimize karne ka tareeqa follow karte hain. Stop loss levels ko set karte waqt traders ko volatility aur overall market conditions ka bhi dhyaan dena chahiye taake wo apne positions ko effectively manage kar sakein.

    13. Rounding Bottom Aur Price Targets

    Is pattern ke pehchan karne ke baad traders price targets ko bhi set karte hain. Jab ye pattern confirm hota hai, toh traders apne price targets ko identify karte hain jisse wo apne trades ka potential profit calculate kar sakein. Lekin traders ko price targets ko set karte waqt overall market conditions aur pattern ka confirmation bhi consider karna important hai taake wo realistic price targets ko set kar sakein.

    14. Rounding Bottom Aur False Signals

    Traders ko dhyan mein rakhna chahiye ke kabhi kabhi Rounding Bottom pattern false signals bhi de sakta hai. Isliye dusri confirmatory indicators ka bhi istemal karna zaroori hai taake sahi trading decisions li ja sakein. False signals ko identify karne ke liye traders ko doosre technical indicators ka bhi analysis karna hota hai taake wo accurate predictions kar sakein aur sahi trading decisions le sakein.

    15. Rounding Bottom Ka Example

    Ek example ke roop mein, agar ek stock ka price downtrend mein tha aur phir gradual recovery ke baad U-shaped curve banata hai, toh ye ek potential Rounding Bottom pattern ho sakta hai. Traders is pattern ko identify karke apne trading decisions le sakte hain. Lekin traders ko dhyan mein rakhna chahiye ke pattern sirf ek indicator hai aur sahi identification ke liye traders ko overall market conditions aur doosre technical indicators ka bhi analysis karna hota hai.

    16. Rounding Bottom Ka Istemal

    Rounding Bottom pattern ko analyze karke traders apne investment decisions ko support karte hain. Is pattern ko dekh kar traders market trends ko better understand karke apne trading strategies ko improve kar sakte hain. Lekin traders ko dhyan mein rakhna chahiye ke pattern sirf ek indicator hai aur sahi trading decisions lene ke liye traders ko doosre factors jaise fundamental analysis aur overall market conditions ka bhi dhyaan dena chahiye.

    17. Rounding Bottom Aur Trend Reversal

    Is pattern ka sabse bada maqsad hota hai trend reversal ko indicate karna. Jab ye pattern confirm hota hai, toh traders ek potential trend reversal ka indication samajhte hain aur apne trading strategies ko uss direction mein adjust karte hain. Lekin traders ko dhyan mein rakhna chahiye ke pattern sirf ek indicator hai aur sahi identification ke liye traders ko overall market conditions aur doosre technical indicators ka bhi analysis karna hota hai.

    18. Rounding Bottom Ka Observation

    Traders ko price movements ko closely observe karna hota hai Rounding Bottom pattern ko identify karne ke liye. Jab ye pattern observe hota hai, toh traders uss direction mein apne trading decisions lete hain jisse wo potential profits earn kar sakein. Lekin traders ko dhyan mein rakhna chahiye ke pattern sirf ek indicator hai aur sahi identification ke liye traders ko overall market conditions aur doosre technical indicators ka bhi analysis karna hota hai.

    19. Rounding Bottom Aur Volatility

    Is pattern ke identification mein volatility ka bhi ek important role hota hai. Rounding Bottom pattern ek gradual recovery ko indicate karta hai jisse traders volatility ko bhi dhyan mein rakhte hain apne trading decisions ke liye. Lekin traders ko dhyan mein rakhna chahiye ke volatility ke wajah se false signals bhi generate ho sakte hain, isliye sahi identification ke liye traders ko overall market conditions aur doosre technical indicators ka bhi analysis karna hota hai.

    20. Rounding Bottom Aur Long-Term Investing

    Rounding Bottom pattern ko long-term investing ke liye bhi istemal kiya ja sakta hai. Jab ye pattern confirm hota hai, toh investors apne long-term investment decisions ko support karte hain aur future price trends ko anticipate karke apne investments ko manage karte hain. Lekin investors ko dhyan mein rakhna chahiye ke pattern sirf ek indicator hai aur sahi identification ke liye investors ko fundamental analysis aur overall market conditions ka bhi dhyaan dena chahiye.
  • <a href="https://www.instaforex.org/ru/?x=ruforum">InstaForex</a>
  • #2 Collapse


    Rounding Bottom Pattern aur Uski Ahmiyat Forex Trading Mein

    Forex trading mein, Rounding Bottom pattern ek ahem technical analysis tool hai jo ke price action ke patterns ko identify karne aur future price movements ko anticipate karne mein madadgar hota hai. Is article mein, hum Rounding Bottom pattern ke maqsad aur uski tafseelat ke baare mein baat karenge.

    Rounding Bottom Pattern Kya Hai?

    Rounding Bottom pattern ek chart pattern hai jo ke price action analysis ke zariye market mein aane wale reversals ko indicate karta hai. Is pattern mein, price initially downtrend mein hota hai lekin phir gradual recovery dikhata hai, jisse chart par ek rounded bottom shape ban jata hai. Is pattern ko samajhne ke liye, traders ko price ke dips aur subsequent recoveries par nazar rakhni hoti hai jo ke ek smooth curve banate hain.

    Rounding Bottom Pattern Ki Tafseelat

    Rounding Bottom pattern ka asal maqsad downtrend ke baad ek bullish reversal ko identify karna hai. Is pattern mein, price gradually neeche se upar ki taraf shift hota hai aur ek rounded bottom shape banata hai. Jab price trend apne previous support level se upar jaata hai aur phir usay break karta hai, to yeh ek potential entry point create karta hai.

    Rounding Bottom Pattern Ka Istemal

    Rounding Bottom pattern ka istemal traders ko bullish reversals ko anticipate karne aur long positions ke entry points ko identify karne mein madad karta hai. Jab market mein Rounding Bottom pattern dikhayi deta hai, to traders ko yeh signal milta hai ke downtrend khatam ho raha hai aur bullish trend shuru hone wala hai. Is pattern ke hone par, traders apne entry points ko set kar sakte hain aur long positions le sakte hain.

    Rounding Bottom Pattern Ke Fawaid
    1. Bullish Reversal Signal: Rounding Bottom pattern ek bullish reversal signal hai jo ke market ke trend ka reversal indicate karta hai.
    2. Entry Points Ki Identifications: Is pattern ke hone par traders ko clear entry points mil jate hain jisse wo apne trades ko execute kar sakte hain.
    3. Risk Management: Rounding Bottom pattern ke istemal se, traders apne stop-loss orders ko set karke apni risk management ko improve kar sakte hain.

    • #3 Collapse

      Description of Pattern.
      Rounding Bottom Pattern ka matlab hai "Gol Tala Hissa". Yeh Stock Market mein ek bullish trend pattern hai. Is pattern ki madad se traders and investors stock ki price ke baray mein predict karte hain.

      Click image for larger version

Name:	images (40).jpeg
Views:	53
Size:	56.2 کلوبائٹ
ID:	12843971

      Is pattern ke bare mein baat karte hue hum iske kuch headings discuss karen ge:

      1. Introduction:
      Rounding Bottom Pattern ek technical analysis tool hai jo stock price movements ko analyze karta hai. Yeh pattern usually long term timeframes mein dekha jata hai.

      2. Formation:
      Is pattern mein price initially down trend mein hota hai phir gradual recovery hota hai aur phir price ko round bottom shape mein reach karta hai.

      3. Confirmation:
      Is pattern ki confirmation ke liye traders ko volume ke sath sath price movements ko bhi dekhna hota hai. Agar price apne support level se upar jata hai aur volume bhi increase hota hai to yeh pattern confirm hota hai.

      Click image for larger version

Name:	images (41).jpeg
Views:	46
Size:	73.0 کلوبائٹ
ID:	12843972

      4. Targets:
      Rounding Bottom Pattern ke targets ko calculate karne ke liye traders ko pattern ke height ko measure karna hota hai. Iske baad traders ko is height ko breakout point se add karna hota hai. Isse traders ko apne profit targets mil jate hain.

      5. Stop Loss:
      Stop loss ki placement bahut important hoti hai. Agar price trend change ho jata hai to traders ko apni positions ko close karna chahiye. Iske liye stop loss ka use kiya jata hai.

      Click image for larger version

Name:	images (75).png
Views:	47
Size:	25.8 کلوبائٹ
ID:	12843973

      In conclusion, Rounding Bottom Pattern traders and investors ke liye ek powerful tool hai jo stock price movements ko predict karne mein help karta hai. Is pattern ki madad se traders ko profitable trades karne mein help milti hai.


      • #4 Collapse

        Rounding bottom pattern in forex trading....

        Click image for larger version

Name:	bb.png
Views:	49
Size:	25.2 کلوبائٹ
ID:	12843977


        Rounding Bottom, jo ke "saayeh daari" ya "rounding bottom" ke naam se bhi mashhoor hai, ek technical analysis pattern hai jo ke forex trading mein istemal hota hai. Yeh pattern market mein trend reversal ko darust karnay mein madadgar hota hai aur traders ko potential buying opportunities ke baray mein malumat farahem karta hai.

        Rounding Bottom Kya Hai? (Rounding Bottom Pattern Ki Tafseelat):

        Rounding Bottom pattern ek reversal pattern hai jo ke downtrend ke baad aata hai. Is pattern mein price initially girta hai lekin phir gradual taur par izafay ke saath dobara barhne lagta hai. Yeh pattern ek U shape banata hai, jismein price pehlay se kam hoti hai, phir thori izafay ke baad tezi se barhti hai, aur phir mazeed izafay ke saath peak ko choo jati hai. Is U shape ko dekhte hue ise "rounding bottom" kehte hain.

        Rounding Bottom Pattern Kaise Tashkeel Pata Hai? (Identification of Rounding Bottom Pattern):

        Rounding Bottom pattern ko pehchanne ke liye traders ko price chart ko dhyan se dekhna hota hai. Downtrend ke baad, jab price gradual taur par izafay ke saath barhne lagta hai aur ek U shape banata hai, to yeh rounding bottom pattern ka pehla indication hota hai. Important hai ke is pattern mein price ka barhna gradual ho, tezi se nahi, aur peak ki taraf jaaye.

        Rounding Bottom Pattern Ka Matlab Kya Hai? (Implications of Rounding Bottom Pattern):

        Rounding Bottom pattern ka matlub hai ke market mein bearish trend khatam ho sakta hai aur bullish trend shuru hone wala hai. Is pattern ko dekh kar traders ko yeh malumat milta hai ke selling pressure kamzor ho rahi hai aur buying interest barh rahi hai.

        Trading Strategies Ke Liye Rounding Bottom Pattern Ka Istemal:
        1. Long Position: Jab traders rounding bottom pattern ko pehchantay hain, toh yeh unko indication deta hai ke ab market mein buying ka potential hai. Is situation mein traders long position, yaani ke asset ko khareedna (buy) consider karte hain.
        2. Target Setting: Rounding Bottom pattern ke baad traders apne target prices set karte hain. Yeh target prices unko guide karte hain ke kab apne positions ko close karna hai.
        3. Confirmation Ke Liye Wait Karna: Rounding Bottom pattern ko confirm karne ke liye, traders doosre technical indicators ka istemal karte hain jaise ke volume analysis, moving averages, aur trend lines.

        Conclusion (Khaatima):

        Rounding Bottom pattern ek powerful tool hai jo ke traders ko market trends aur reversals ke baray mein malumat farahem karta hai. Isko samajh kar, investors apni trading strategies ko behtar bana sakte hain aur market movements ko sahi taur par interpret karke apne trading decisions ko optimize kar sakte hain, especially in the context of forex trading.
        • #5 Collapse

          Rounding bottom pattern in forex trading....

          Click image for larger version

Name:	6666.png
Views:	45
Size:	25.2 کلوبائٹ
ID:	12844000


          Rounding Bottom Pattern, jo ke technical analysis ka hissa hai, forex trading mein aik aham chart pattern hai. Is pattern ko traders market mein hone wale trend ka pata lagane aur future price movements ko samajhne ke liye istemal karte hain. Yeh pattern aksar trend reversal ko darust karne mein madad karta hai, jab market mein pehle se mojood bearish trend ko indicate karta hai.


          Rounding Bottom Ka Hulool:

          Rounding Bottom Pattern ka nam is wajah se hai ke jab yeh pattern chart par nazar aata hai, toh uska shape ek sair (round) ki tarah hota hai. Yeh pattern market mein downtrend ke baad aata hai aur bullish trend ke hone ki tajaweez deta hai. Is pattern ko do main parts mein taksim kia ja sakta hai:
          1. Downtrend Phase (Girawat ki Daur): Is phase mein market mein pehle se girawat (downtrend) hota hai. Traders is phase mein bearish trend ko dekhte hain aur price mein neeche ki taraf girne ka trend hota hai.
          2. Rounding Bottom Formation (Sair Ki Shape): Jab market mein girawat ki daur khatam hoti hai, toh price mein stability aati hai aur ek sair ki tarah shape ban jati hai. Yeh sair ki shape bullish reversal ko darust karti hai.


          Rounding Bottom Pattern Ke Asarat:
          1. Trend Reversal Indicator: Rounding Bottom Pattern aksar trend reversal ko indicate karta hai. Jab yeh pattern complete hota hai, toh yeh traders ko batata hai ke bearish trend khatam ho sakta hai aur ab market mein bullish trend ka aghaz hone wala hai.
          2. Price Target: Traders is pattern ke istemal se future price target bhi tay kar sakte hain. Yeh pattern complete hone par, traders ko ek potential price target mil jata hai jo market mein hone wale bullish movement ko estimate karne mein madad karta hai.
          3. Volume Confirmation: Is pattern ke asarat ko aur bhi mazboot banane ke liye, traders volume ko bhi madde nazar rakhte hain. Agar volume bhi saath mein badta hai jab rounding bottom complete hota hai, toh yeh us reversal ko aur bhi mazbooti deta hai.


          Challenges and Considerations:
          1. False Signals: Har chart pattern ki tarah, rounding bottom pattern bhi kabhi-kabhi galat signals dene ka khatra laita hai. Is liye traders ko mawafiq risk management aur confirmation ke liye doosre technical indicators ka istemal karna chahiye.
          2. Market Conditions: Rounding Bottom Pattern ko samajhna market ke conditions par bhi depend karta hai. Kabhi-kabhi market mein volatility ya economic factors ke asarat se yeh pattern kamzor ho sakta hai.


          Conclusion:

          Rounding Bottom Pattern ek ahem technical analysis tool hai jo traders ko market mein hone wale trend reversal ka pata lagane mein madad karta hai. Lekin, is pattern ka istemal samajhdarana aur doosre technical tools ke saath karna zaroori hai taake galat signals se bacha ja sake aur trading decisions sahi ho.
          • #6 Collapse

            Rounding Bottom Pattern

            Rounding Bottom Pattern forex trading mein ek bullish reversal pattern hai. yeh ek "U" ya katore jaisi aakruti banata hai, jo ek lambi downtrend ke bad banta hai. pattern ki banavat is tarah hoti hai:
            • decline: pattern ki shuruaat kimat mein ek lambi girvat se hoti hai. yeh girvat tej ya dhimi ho sakti hai, lekin yeh aamtaur per kai hafton ya mahinon tak chalti hai.
            • consolidation: girvat ke bad, kimat ek range mein consolidate hoti hai. is dauran, kharidar aur bechnewale niyantran ke liye lad rahe hote hain.
            • upswing: jab kharidar niyantran hasil karte hain, to kimat badhane lagti hai. yeh upswing tej ya dhimi ho sakti hai, lekin yeh aamtaur per kai hafton ya mahinon tak chalti hai.

            rounding bottom pattern ko kai tarah se trade kiya ja sakta hai. ek tarika hai breakout per trade karna. breakout tab hota hai jab kimat pattern ke upri trendline se upar nikalti hai. ek aur tarika hai pullback per trade karna. pullback tab hota hai jab kimat breakout ke bad thodi gir jaati hai.

            rounding bottom pattern ek vishwasniiya reversal pattern hai, lekin yah 100% sahi nahin hai. pattern ko trade karne se pahle, apne stop-loss order ko theek se rakhna jaruri hai.

            How to trade
            • pattern ki pahchan karne ke liye daily ya weekly chart ka istemal karen.
            • breakout ya pullback per trade karne ke liye ek entry point chunen.
            • apne stop-loss order ko pattern ke niche rakhen.
            • ek target price chunen jo pattern ki unchai ke barabar ho.

            rounding bottom pattern forex trading mein ek behtarin tool hai. is pattern ko samajhkar aur iska istemal karke, aap apne trade mein safalta ki sambhavna badha sakte hain.

            yahan kuchh atirikt sansadhan diye gaye hain jo aapko upyogi lag sakte hain:
            • rounding bottom pattern per investopedia ka lekh:
            • rounding bottom pattern per tradingview ka lekh: [Invalid URL remove kiya gaya]
            • rounding bottom pattern per babypips ka lekh: [Invalid URL remove kiya gaya]
            • #7 Collapse


              Forex Trading Mein Rounding Bottom Pattern

              Forex trading mein mukhtalif chart patterns traders ke liye ahem signals hote hain jo unhe market ki movement ka andaza lagane mein madad karte hain. Ek aham aur mukhtasir pattern jo traders ke liye mufeed ho sakta hai, woh hai "Rounding Bottom" pattern.
              Click image for larger version

Name:	images.png
Views:	43
Size:	6.4 کلوبائٹ
ID:	12844186
              Rounding Bottom Pattern Kya Hai?

              Rounding Bottom pattern ek bullish reversal pattern hai jo market ke trend ko indicate karta hai. Is pattern mein price initially neeche girne ke baad gradual taur par upar ki taraf move karta hai aur ek "U" shape banata hai. Is shape ko "Rounding Bottom" ya "Saucer Bottom" bhi kaha jata hai. Yeh pattern market mein bearish trend ke bad ek possible trend reversal ko darust karta hai.

              Rounding Bottom Pattern Ki Tashkeel

              Rounding Bottom pattern ki tashkeel main do hisson se hoti hai:
              1. Downtrend Phase (Neecay ki taraf trend): Is phase mein price ek bearish trend mein hoti hai aur neeche ki taraf move karti hai.
              2. Base Formation Phase (Bunyadi Tashkeel ki Phase): Jab price neeche se upar ki taraf move karna shuru karti hai aur ek "U" shape banati hai, tab base formation phase shuru hoti hai. Is phase mein price gradual taur par upar ki taraf move karti hai.

              Rounding Bottom Pattern Ka Tafsili Tafseel

              Rounding Bottom pattern ke tafsili tafseel mein, traders ko kuch cheezon par tawajjo deni chahiye:
              1. Volume: Base formation phase mein volume ka bhi tawajjo dena zaroori hai. Agar volume gradually increase ho raha hai jab price upar ki taraf move kar rahi hai, to yeh pattern mazbooti ke sath confirm hota hai.
              2. Neckline Breakout: Jab price base formation phase ke baad neckline ko cross kar ke upar ki taraf move karta hai, tab pattern confirm hota hai. Traders ko is breakout ko confirm karne ke liye volume ki bhi tawajjo deni chahiye.
              3. Target: Rounding Bottom pattern ke target ko calculate karne ke liye, traders neckline se pattern ke peak tak ka distance lete hain aur phir us distance ko breakout point par add karte hain. Yeh target price ka mukhtasir hisaab hota hai jahan traders ko munafa hasil karne ka mauqa mil sakta hai.

              Rounding Bottom pattern ek mukhtasar aur mufeed bullish reversal pattern hai jo traders ko market ke trend reversal ko samajhne mein madad karta hai. Is pattern ki sahi samajh aur istemal se traders munafa hasil kar sakte hain. Lekin, hamesha yaad rahe ke kisi bhi pattern ya stratiji ka istemal karte waqt risk ko samajhna aur uske saath deal karna zaroori hai.

              • #8 Collapse

                Rounding Bottom Pattern ek technical analysis concept hai jo stocks ya anya financial instruments ke chart par dekha jata hai. Ye pattern typicaly market mein trend reversal ko darust karta hai,

                1. Recognition of Rounding Bottom Pattern:

                Rounding Bottom Pattern ko recognize karne ke liye traders ko stock ka chart dekh kar price ke stable hone aur gradual increase hone ka pattern dekhna hota hai,

                2. Rounding Bottom Pattern ki Tashkeel:

                Is Pattern ki tashkeel mein pehle price ka gradual decrease hota hai phir ek round bottom shape banta hai jise follow karte hue price increase hone lagta hai,

                Click image for larger version

Name:	images(8).jpg
Views:	45
Size:	54.6 کلوبائٹ
ID:	12844281

                3. Rounding Bottom Pattern ka Muddat:

                Rounding Bottom Pattern ka muddat kuch hafton se lekar kai mahinon tak ho sakta hai, is liye patience ke sath dekha jana chahiye,

                4. Reversal Indicator:

                Rounding Bottom Pattern market trend ke palat patakne ka indicator hota hai. Isko dekh kar traders future price movement ka andaza lagate hain,

                5. Price Targets:

                Rounding Bottom Pattern ke pesh-e-nazar hone par traders price targets set karte hain jo ke pattern ke hisab se mukhtalif levels par ho sakte hain,

                6. Time Frame Analysis:

                Is Pattern ko dekhne mein time frame ka analysis bhi zaroori hai. Chhote aur lambe time frames par pattern ki dekhai jane wali impact mein farq hota hai,

                7. Technical Analysis Tools:

                Traders Rounding Bottom Pattern ko identify karne aur tajziya karne ke liye mukhtalif technical analysis tools ka istemal karte hain jaise ke moving averages aur chart patterns,

                8. Conclusion:

                Rounding Bottom Pattern ek ahem technical indicator hai jo traders ko market ke trend reversal ke bare mein agah karta hai. Iski samajh aur sahi tajziya karne se traders apni trading strategies ko mazeed behtar bana sakte hain. Lekin, iske istemal mein caution aur proper risk management ka khayal rakhna bhi zaroori hai.
                • #9 Collapse

                  What is Rounding Bottom Pattern in forex trading?

                  Answer:

                  Rounding Bottom Pattern Kya Hai:

                  Bottom Pattern ek popular bullish reversal pattern hai jo forex trading mein dekha jata hai. Is pattern mein price action ka ek particular shape hota hai jo ek downtrend ke baad trend reversal ko indicate karta hai.

                  Kis Tarah Kaam Karta Hai:


                  1. Banawat:

                  Rounding Bottom Pattern mein price action ka shape ek rounded bottom ki tarah hota hai. Is pattern mein initially price slow and steady decline karta hai, lekin phir gradual recovery hoti hai jisse ek rounded bottom form hota hai.

                  2. Volume Analysis:

                  Is pattern ke confirmation ke liye, traders volume analysis ka istemal karte hain. Agar pattern ke formation ke samay volume increase hota hai, toh yeh pattern ka validity aur zyada hoti hai.

                  Tabeer aur Trading:

                  1. Trend Reversal Signal:

                  Rounding Bottom Pattern ko dekh kar traders ko signal milta hai ke current downtrend khatam hone wala hai aur ek bullish trend ka start hone ka indication hai.

                  2. Entry Aur Exit Points:

                  Traders is pattern ke completion ke baad entry aur exit points tay karte hain. Jab pattern complete hota hai aur price ek resistance level ko break karta hai, tab traders long positions enter kar sakte hain.

                  Click image for larger version

Name:	image_search_1709044085075.png
Views:	46
Size:	30.0 کلوبائٹ
ID:	12844348

                  Trading Strategy:

                  1. Confirmation Ki Zarurat:

                  Rounding Bottom Pattern ke signals ko confirm karne ke liye, traders doosre technical indicators aur price action ka istemal karte hain. Confirmatory signals ke bina trading avoid kiya jana chahiye.

                  2. Risk Management:

                  Har trading strategy mein risk management ka ek crucial hissa hota hai. Rounding Bottom Pattern ke signals ke saath, stop-loss aur take-profit levels tay karna zaroori hai.

                  Nateeja:

                  Rounding Bottom Pattern, forex traders ke liye ek important tool hai trend reversals ko anticipate karne mein. Lekin, hamesha market context aur doosre confirmatory indicators ko bhi tajziya karna zaroori hai trading decisions ke liye.
                  • #10 Collapse


                    Forex Trading Mein Rounding Bottom Pattern

                    1. Rounding Bottom Pattern Ki Tafseelat
                    • Rounding Bottom Pattern Ki Tareef: Rounding Bottom Pattern ek technical analysis pattern hai jo market mein trend reversal ko darust karta hai. Ye pattern ek U-shape ki shape ko banata hai jismein price initially downward trend ke baad gradually upar ki taraf move karta hai aur phir ek rounding bottom form karta hai.
                    • Ahmiyat: Rounding Bottom Pattern traders ke liye ek bullish signal hai jo indicate karta hai ke market ka trend downward se upward shift kar raha hai. Is pattern ko samajh kar traders entry aur exit points tay kar sakte hain.

                    2. Rounding Bottom Pattern Ka Formation
                    • Initial Downtrend: Rounding Bottom Pattern ka formation ek initial downtrend ke saath shuru hota hai. Ismein price gradually down jaata hai.
                    • Gradual Uptrend: Downtrend ke baad price gradual uptrend mein move karta hai aur ek U-shape pattern banata hai.

                    Rounding Bottom Pattern Ke Asar Aur Impacts
                    • Bullish Reversal Signal: Rounding Bottom Pattern ek bullish reversal signal hai jismein market ka trend downward se upward shift hota hai.
                    • Trading Opportunities: Rounding Bottom Pattern traders ko trading opportunities ke liye signals provide karta hai. Jab pattern complete hota hai, traders long positions le sakte hain expecting an upward movement.

                    Rounding Bottom Pattern Ke Identifying Techniques
                    • Price Action Analysis: Rounding Bottom Pattern ko identify karne ke liye traders price action analysis ka istemal karte hain. Ismein price ke movements aur patterns ko observe kiya jata hai.
                    • Volume Analysis: Volume analysis bhi ek important technique hai Rounding Bottom Pattern ko identify karne ke liye. Agar pattern ke sath volume bhi increase hota hai, toh ye pattern strong hota hai.

                    Rounding Bottom Pattern Ka Istemal Trading Mein
                    • Entry Points: Rounding Bottom Pattern ke formation ke baad traders entry points tay karte hain. Usually, entry point pattern ke breakout point par hota hai.
                    • Stop-loss Aur Target Levels: Traders stop-loss orders aur target levels set karte hain Rounding Bottom Pattern ke sath trading karte waqt. Stop-loss orders unhein nuksan se bachate hain jabke target levels unke profits ko maximize karte hain.

                    Conclusion


                    Rounding Bottom Pattern forex trading mein ek important aur useful technical analysis pattern hai jo traders ko bullish trend reversals ko identify karne mein madad karta hai. Is pattern ko samajh kar, traders market ke movements ko predict kar sakte hain aur sahi samay par trades le sakte hain. Lekin, traders ko market ke movements ko carefully monitor karna chahiye aur risk management ka bhi khaas khayal rakhna chahiye jab wo Rounding Bottom Pattern ke sath trading karte hain.


                    Last edited by ; 28-02-2024, 06:27 PM.
                    • #11 Collapse

                      Rounding Bottom Pattern :
                      Rounding bottom pattern ke kuch characteristics hote hain: 1. Price initially downtrend mein hota hai.
                      2. Gradual recovery ke baad price U-shape pattern banata hai.
                      3. Volume downtrend ke dauran decrease hota hai aur recovery ke dauran increase hota hai.
                      4. Pattern complete hone ke baad price upar ki taraf move kar sakta hai.
                      5. Is pattern ko bullish trend reversal ke liye use kiya jata hai.

                      Click image for larger version

Name:	rounding bottom patters.png
Views:	25
Size:	11.2 کلوبائٹ
ID:	12882106


                      Characteristics of Rounding bottom pattern :

                      Rounding bottom pattern ke sath trading karne ke liye aap kuch steps follow kar sakte hain:

                      1. Pattern confirm karen:

                      Rounding bottom pattern ko identify karen aur confirm karen ki price U-shape pattern banane ke baad upar ki taraf move kar rahi hai.

                      2. Entry point decide karen:

                      Jab pattern confirm ho jaye, tab entry point decide karen. Aap entry point ko price breakout ya fir price ka resistance level ko cross karne par set kar sakte hain.

                      3. Stop loss rakhen:

                      Apne trade ke liye stop loss level set karen, jisse aap apni risk ko manage kar saken. Stop loss aapko protect karega agar price opposite direction mein move kare.

                      4. Target price set karen:

                      Apne trade ka target price set karen, jisse aapko profit booking karne mein help mile. Aap previous swing high ya fir technical analysis tools ka use karke target price decide kar sakte hain.

                      5. Risk management ka dhyan rakhen:

                      Hamesha apne trade mein risk management ka dhyan rakhen. Apne trading capital ko properly allocate karen aur overtrading se bache.

                      6. Trading plan follow karen:

                      Ek well-defined trading plan banayen aur usse stick karen. Discipline aur patience maintain karen.

                      Yeh steps aapko rounding bottom pattern ke sath trading karne mein madad karenge. Lekin hamesha dhyan rakhen ki market unpredictable hai, isliye risk management aur proper analysis ka use karna bahut zaruri hai.
                       
                      • #12 Collapse


                        Rounding Bottom pattern, jo ki "saucer bottom" ya "rounding bottom" ke naam se bhi jaana jaata hai, ek bullish reversal pattern hai jo market mein trend change ka indication deta hai. Ye pattern typically downtrend ke baad dekha jaata hai aur ek potential trend reversal ke signal ke roop mein istemal hota hai. Chaliye is pattern ko mazeed samajhte hain:
                        Rounding Bottom Pattern ki Formation:
                        1. Downtrend: Rounding Bottom pattern ka formation typically ek extended downtrend ke baad hota hai. Is doran, price gradually neeche ki taraf move karta hai aur sellers dominate karte hain.
                        2. Base Formation: Price ka gradual downtrend hone ke baad, ek base formation create hota hai jo ek saucer ya bowl ki tarah dikhayi deta hai. Is base mein price mein gradual decline hoti hai, lekin phir ek samarpan shuru hota hai aur price stable hone lagta hai.
                        3. Uptrend Initiation: Base formation ke baad, price mein ek gradual uptrend shuru hota hai. Ye uptrend initial downtrend se higher highs aur higher lows ke saath shuru hota hai, indicating a potential reversal in market sentiment.
                        Rounding Bottom Pattern ki Interpretation:


                        Rounding Bottom pattern ko interpret karne ke liye, traders ko base formation aur uske baad ke uptrend ke patterns ko observe karna hota hai. Agar price mein gradual decline ke baad ek stable base formation ban raha hai, aur phir ek uptrend shuru ho raha hai with higher highs aur higher lows, to ye ek bullish reversal signal hai.
                        Rounding Bottom Pattern ka Istemal aur Limitations:
                        • Istemal: Rounding Bottom pattern ko confirm karne ke liye, traders doosre technical indicators aur price action signals ke saath combine karte hain. Is pattern ko validate karne ke liye volume analysis bhi kiya ja sakta hai.
                        • Limitations: Rounding Bottom pattern ke signals kabhi kabar false ho sakte hain, khaaskar choppy ya range-bound markets mein. Isliye, confirmation ke liye additional analysis aur signals ka istemal zaroori hota hai.

                        Rounding Bottom pattern ek potential bullish reversal signal hai jo traders ko market sentiment ka shift indicate karta hai. Is pattern ko identify karne ke liye sufficient practice aur experience ki zarurat hoti hai. Traders ko is pattern ke saath proper risk management bhi zaroori hai taake potential losses ko minimize kiya ja sake.

                        Click image for larger version

Name:	download (17).png
Views:	34
Size:	7.5 کلوبائٹ
ID:	12882138


                        • #13 Collapse


                          Rounding Bottom Pattern, ya "Upar Se Gol Dabay Ka Pattern", forex trading mein ek bullish reversal pattern hai jo market mein downtrend ke baad dikhai deta hai. Yeh pattern ek round shape mein hota hai aur market ke price levels ki gradual increase ko darust karta hai. Is pattern ka matlab hota hai ke market mein bearish momentum kamzor ho raha hai aur bullish reversal hone ka chance hai.
                          Click image for larger version

Name:	download (22).png
Views:	37
Size:	6.1 کلوبائٹ
ID:	12882180

                          Rounding Bottom Pattern Ki Pehchan:
                          1. Downtrend (نیچے کی رخ):
                            • Rounding Bottom pattern typically ek downtrend ke baad dikhai deta hai, jab prices steadily neeche ja rahi hain.
                            • Is downtrend mein prices neeche ki taraf ja rahe hote hain aur bearish momentum dominate karta hai.
                          2. Round Shape (گول شکل):
                            • Pattern ko identify karne ke liye, traders ko price chart par ek round shape ya curve dekhne ki zaroorat hoti hai.
                            • Is pattern mein prices gradual increase kar rahi hoti hain, jo ki round shape ko create karta hai.
                          3. Gradual Increase (تدریجی بڑھتا ہوا):
                            • Rounding Bottom pattern mein prices gradual taur par increase karti hain, indicating a shift in market sentiment from bearish to bullish.
                            • Is pattern mein har ek high level pehle se zyada hai jo ke bullish indication deta hai.
                          4. Volume Analysis (حجم کی تجزیہ):
                            • Pattern ke formation ke doran, traders ko volume analysis bhi karna zaroori hai.
                            • Agar volume decreasing hai jabke prices increase ho rahe hain, toh yeh ek positive sign hai ke bullish reversal hone ka chance hai.
                          5. Breakout (باہر نکلنا):
                            • Rounding Bottom pattern ki confirmation tab hoti hai jab prices ek specific resistance level ko break kar dete hain.
                            • Jab prices is resistance level ko cross karte hain, toh yeh ek bullish reversal signal ke roop mein consider kiya jata hai.

                          Rounding Bottom Pattern Ka Istemal:
                          1. Entry Points (داخلہ نقطے):
                            • Jab Rounding Bottom pattern confirm ho jata hai, traders long positions enter kar sakte hain.
                            • Entry point typically tab hota hai jab prices resistance level ko break karte hain.
                          2. Stop Loss (نقصان بند):
                            • Traders ko apni long positions ke liye stop loss levels set karna zaroori hai.
                            • Stop loss typically set kiya jata hai neeche ki taraf, neeche wale support level ke paas.
                          3. Target Levels (ہدف کی سطحیں):
                            • Traders apne target levels ko set kar sakte hain upper side par, previous highs ya trend ke continuation ke liye.

                          Rounding Bottom pattern ek powerful bullish reversal pattern hai jo traders ko market mein trend changes ka pata lagane mein madad karta hai. Zaroori hai ke traders is pattern ko sahi taur par identify karne aur confirm karne ke liye sahi tools aur analysis ka istemal karein.


                          • #14 Collapse

                            Rounding Bottom Pattern in forex trading....


                            Click image for larger version

Name:	download (18).png
Views:	18
Size:	8.9 کلوبائٹ
ID:	12882490

                            Rounding Bottom pattern forex trading mein ek ahem technical analysis tool hai jo market ke trend reversal ko darust karta hai. Is pattern ka formation market mein ek downtrend ke baad hota hai aur yeh bullish reversal ka indication deta hai. Neechay Rounding Bottom pattern ke bare mein detail mein roman Urdu mein bataya gaya hai:

                            Formation:

                            Rounding Bottom pattern ek trend reversal pattern hai jo market mein ek downtrend ke baad form hota hai.
                            Is pattern mein, price initially neeche ki taraf move karta hai lekin phir gradual taur par upar ki taraf move karta hai aur ek safaid rounded shape form karta hai.
                            Rounding Bottom pattern ka formation usually kuch hafton ya mahinon tak ka samay leta hai aur iske during volume kam hota hai.
                            Meaning aur Interpretation:

                            Rounding Bottom pattern ka formation market mein ek potential trend reversal ko indicate karta hai. Iska matlab hai ke jab market mein ek downtrend ke baad Rounding Bottom pattern form hota hai, to yeh bullish reversal ka signal ho sakta hai.
                            Is pattern ke formation ke doran, sellers ki strength dheere dheere kam hoti hai aur buyers ki strength dheere dheere barhti hai. Yeh dikhata hai ke market mein bearish pressure kam ho rahi hai aur bullish momentum barh raha hai.
                            Confirmation:

                            Rounding Bottom pattern ko confirm karne ke liye, traders doosre technical indicators aur price action signals ka istemal karte hain.
                            Agar Rounding Bottom pattern ke formation ke sath ek increase in volume dikhai deta hai aur doosre bullish reversal signals bhi milte hain jaise ki bullish candlestick patterns ya phir positive divergence in oscillators jaise ki RSI ya MACD, to yeh Rounding Bottom pattern ko confirm karta hai.
                            Trading Strategy:

                            Rounding Bottom pattern ko dekh kar traders bullish trading positions lete hain. Jab market Rounding Bottom pattern ke breakout ke qareeb approach karta hai, to traders long positions lete hain expecting ke price upar ki taraf move karega.
                            Stop loss level ko set karne ke liye, traders Rounding Bottom pattern ke low level ke neeche stop loss lagate hain.
                            Target levels ko set karne ke liye, traders Rounding Bottom pattern ke height ko measure karte hain aur usi ke mutabiq target levels set karte hain.
                            Rounding Bottom pattern ek powerful bullish reversal signal hai jo traders ko market ke trend reversal ke bare mein alert rakhta hai. Lekin, is pattern ko confirm karne ke liye doosre technical tools ka bhi istemal zaroori hota hai. Traders ko is pattern ko samajhna aur uska sahi istemal karna zaroori hai taake woh sahi trading decisions le sakein.
                            • <a href="https://www.instaforex.org/ru/?x=ruforum">InstaForex</a>
                            • #15 Collapse

                              Rounding Bottom Pattern forex trading

                              Rounding Bottom Pattern forex trading mein ek technical analysis pattern hai jo price chart par dikhai deta hai. Is pattern ka matlab hota hai ke market ka trend neeche ki taraf move karne ke baad ab upar ki taraf move karega.

                              Click image for larger version

Name:	images (24).png
Views:	17
Size:	15.2 کلوبائٹ
ID:	12882583

                              Is pattern ko pehchanne ke liye price chart par ek U-shaped curve ban jaati hai jisay rounding bottom kehte hain.is pattern k sath ap kam kr skty hen.

                              Mission analyse krna

                              Click image for larger version

Name:	images (30).jpeg
Views:	16
Size:	16.5 کلوبائٹ
ID:	12882584

                              Rounding Bottom Pattern pehchane ke liye price chart par ek U-shaped curve hona zaroori hai jisay rounding bottom kehte hain. Is curve ko pehchane ke liye price chart par neeche ki taraf move karte hue price ka ek bottom banega jo ek flat base banayega. Iske baad price chart par neeche se upar ki taraf move karne lagta hai aur ek U-shaped curve ban jaati hai. Is curve ke end mein price chart par ek resistance level ban jaata hai.

                              Click image for larger version

Name:	images (23).png
Views:	16
Size:	23.6 کلوبائٹ
ID:	12882585


                              Rounding Bottom Pattern profitable

                              Rounding Bottom Pattern forex trading mein profitable ho sakta hai agar sahi tarah se use kiya jaaye. Is pattern ko pehchane ke baad ek buy signal generate hota hai jisay traders apni trading strategy mein use kar sakte hain.

                              Conclusion

                              Click image for larger version

Name:	images (22).png
Views:	15
Size:	12.7 کلوبائٹ
ID:	12882586


                              Is pattern ko confirm karne ke liye traders ko ek breakout level pehchanna hota hai jisay break karne ke baad price chart par ek upar ki taraf move aata hai. Iske baad traders ek stop loss aur take profit level set kar sakte hain aur apni trading strategy ko follow kar sakte hain.

                              اب آن لائن

                              Working...
                              X