Inverse Head and Shoulders
No announcement yet.
X
  • وقت
  • دکھائیں
Clear All
new posts
  • #16 Collapse

    Inverse Head and Shoulders


    Click image for larger version

Name:	dotdash_Final_Inverse_Head_And_Shoulders_Definition_Feb_2020-01-97f223a0a4224c2f8d303e84f4725a39(0).jpg
Views:	37
Size:	267.6 کلوبائٹ
ID:	12840930


    "Inverse Head and Shoulders" forex trading mein ek bullish reversal pattern hai. Ye pattern typically downtrend ke baad dikhta hai aur bullish reversal ke indication ke taur par consider kiya jata hai.
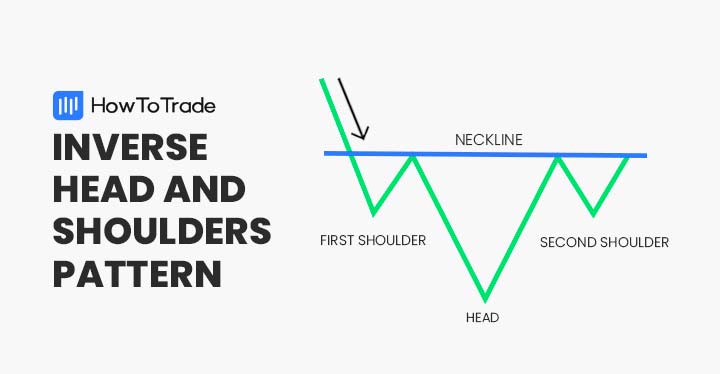
    "Inverse Head and Shoulders" pattern ek specific shape ko represent karta hai, jismein teen key components hote hain:

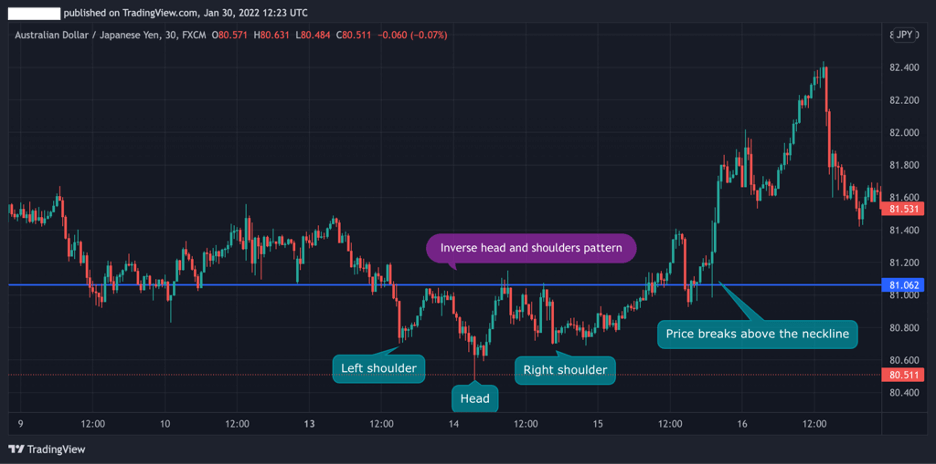
    Head: Downtrend ke doran, market mein ek "head" formation hoti hai, jise ek temporary bottom ke roop mein dekha jata hai. Head typically lows ka level hota hai.

    Shoulders: Head ke do sides mein "shoulders" formation hoti hai. Ye shoulders bhi lows ko represent karte hain, lekin head se kam intense hoti hain. Left shoulder ka formation head se pehle hota hai aur right shoulder ka formation head ke baad hota hai.

    Neckline: Head ke lows aur shoulders ke lows ko connect karne wali ek trendline ko "neckline" kaha jata hai. Neckline typically horizontally sloping hoti hai aur neckline ko breakout key moment consider kiya jata hai.

    Inverse Head and Shoulders pattern ka appearance market mein ek potential bullish reversal point ko indicate karta hai. Jab market neckline ko breakout karta hai (typically right shoulder ke highs ke upar), toh ye bullish reversal ka signal hota hai aur uptrend shuru ho sakta hai.

    Is pattern ko confirm karne ke liye, traders usually breakout ke baad higher volume aur price action ka wait karte hain. Agar volume increase hota hai aur price upward direction mein move karta hai, toh ye Inverse Head and Shoulders pattern ki validity confirm hoti hai.

    Inverse Head and Shoulders pattern ka istemal traders bearish trend ke reversal ko identify karne ke liye karte hain. Agar ye pattern downtrend ke baad dikhai deta hai, toh ye ek potential bullish reversal signal ho sakta hai.

    Is pattern ke saath saath, traders ko market conditions aur additional technical indicators ka bhi analysis karna chahiye. Ye pattern sirf ek indicator hai aur iski accuracy aur reliability ko confirm karne ke liye additional research aur analysis ki zarurat hoti hai.
    • <a href="https://www.instaforex.org/ru/?x=ruforum">InstaForex</a>
    • #17 Collapse

      Inverse Head and Shoulders Click image for larger version

Name:	download - 2024-02-24T182641.607.png
Views:	35
Size:	4.1 کلوبائٹ
ID:	12840935


      "Inverse Head and Shoulders (Muqabalay Sar Aur Kandhay) Chart Pattern:"

      "Inverse Head and Shoulders" ek technical analysis chart pattern hai jo ke market mein trend reversal ko represent karta hai. Yeh pattern typically downtrend ke baad aata hai aur bullish reversal ko suggest karta hai.

      Muqablay Sar Aur Kandhay Pattern Kaise Banta Hai:
      1. Left Shoulder (Baayaan Kandha):
        • Pehle stage mein, market downtrend mein hoti hai aur ek bottom banata hai jo "left shoulder" ko form karta hai. Is phase mein volume kam hota hai.
      2. Head (Sar):
        • Dusre stage mein, market ka price further down jaata hai aur ek lower bottom banata hai jo "head" ko represent karta hai. Is stage mein volume thoda zyada hota hai compared to the left shoulder.
      3. Right Shoulder (Daayaan Kandha):
        • Teesre stage mein, market mein bounce aata hai aur ek higher bottom banata hai jo "right shoulder" ko form karta hai. Is stage mein volume dobara se kam ho sakta hai.
      4. Neckline:
        • Head ke neeche banne wale bottoms ko connect karke "neckline" draw ki jaati hai. Yeh neckline ek slanting line ya horizontal line ho sakti hai.

      Muqablay Sar Aur Kandhay Ka Tafsili Bayan:
      1. Bullish Reversal Signal:
        • Jab price right shoulder ke upar jaata hai aur neckline ko break karta hai, toh yeh ek bullish reversal signal samjha jata hai. Traders is point par buy positions le sakte hain.
      2. Volume ka Role:
        • Volume ki bhi ahmiyat hoti hai. Agar right shoulder ban raha hai aur uske breakout ke time volume kam hai, toh reversal ka confidence kam hota hai.
      3. Target Calculation:
        • Inverse Head and Shoulders ka target calculate karne ke liye, neckline se head ka distance calculate kiya jaata hai aur phir woh distance breakout point par add kiya jaata hai.

      Trading Strategies:
      1. Entry Point:
        • Entry point right shoulder ka breakout ke baad hota hai jab price neckline ko upar se break karta hai.
      2. Stop-Loss:
        • Stop-loss order typically left shoulder ke bottom ke neeche rakha jaata hai, taki false breakout se bacha ja sake.
      3. Target Setting:
        • Target inverse head and shoulders ka calculated target hota hai, jise trader apne profit booking ke liye istemal kar sakta hai.

      "Inverse Head and Shoulders" ek powerful reversal pattern hai, lekin market conditions hamesha change hoti hain, isliye doosre technical indicators aur market analysis ke saath milake is pattern ki confirmation ki jaani chahiye.
       
      • #18 Collapse

        Inverse Head and Shoulders


        Click image for larger version

Name:	download - 2024-02-24T191154.050.jpeg
Views:	43
Size:	16.5 کلوبائٹ
ID:	12840987

        Inverse Head and Shoulders:

        Inverse Head and Shoulders ka Tafseeli Ta'aruf:

        **1. Head and Shoulders Pattern ki Yaad:
        • Inverse Head and Shoulders pattern, technical analysis mein ek aham reversal pattern hai jo ke market trends ko predict karne mein istemal hota hai.
        • Isko dekhne ke liye pehle Head and Shoulders pattern ko samajhna zaroori hai, kyunki ye uska ulta hota hai.

        **2. Structure:
        • Inverse Head and Shoulders pattern ek aisa chart pattern hai jo market mein downtrend ke baad aata hai aur bullish reversal ko darust karta hai.
        • Is pattern mein teen peaks hote hain: ek choti peak (left shoulder), ek bara peak (head), aur phir dobara ek choti peak (right shoulder).

        **3. Key Points:
        • Left Shoulder (Chota Peak):
          • Pehli choti peak downtrend ke doran aati hai.
          • Iske baad price mein izafa hota hai, indicating initial buying interest.
        • Head (Bara Peak):
          • Dusri bari peak, ya head, left shoulder se zyada hoti hai aur market ka neeche girna yahan se shuru hota hai.
          • Jab price head tak girne ke baad stability dikhaati hai, toh ye ek potential reversal point indicate karta hai.
        • Right Shoulder (Dobara Chota Peak):
          • Tisri choti peak, right shoulder, head ke neeche aati hai.
          • Iske baad price mein dobara izafa hota hai, lekin head se kam hota hai.

        **4. Bullish Reversal Signal:
        • Inverse Head and Shoulders pattern ko dekh kar traders ko bullish reversal ka signal milta hai.
        • Jab price right shoulder tak pohanchta hai aur phir usko paar karta hai, toh ye ek confirmatory signal hai ke trend reverse ho sakta hai aur uptrend shuru ho sakta hai.

        **5. Volume Analysis:
        • Is pattern ke sath volume analysis karna bhi important hai. Jab price right shoulder tak pohanchta hai, toh volume mein izafa hone par ye indicate karta hai ke buyers strong hain.

        Tajaweez (Recommendation):
        • Inverse Head and Shoulders pattern ko confirm karnay ke liye, traders ko volume aur doosre technical indicators ka bhi istemal karna chahiye.
        • Har pattern ki tarah, is pattern ke istemal mein experience aur market understanding ka bhi ahem kirdar hota hai.
        • Traders ko hamesha risk management ka khayal rakhna chahiye aur sirf ek pattern par pura bharosa na karte hue market ki mukhtalif factors ko madde nazar rakna chahiye.

        Inverse Head and Shoulders pattern ek powerful reversal indicator ho sakta hai, lekin sahi tarah se samajhna aur istemal karna zaroori hai.
        • #19 Collapse

          Inverse Head and Shoulders

          ​​​​​​​


          Click image for larger version

Name:	download - 2024-02-24T192424.435.jpeg
Views:	38
Size:	12.4 کلوبائٹ
ID:	12841020​​​​​​​


          Introduction: Inverse Head and Shoulders, ya IHS, ek technical analysis pattern hai jo stock market aur financial markets mein istemal hota hai. Ye pattern traders ko market ke trends aur reversals ko samajhne mein madad karta hai. Is article mein, hum Inverse Head and Shoulders ke concept, formation, aur uske trading strategies ko detail mein explore karenge.

          1. Head and Shoulders Pattern: Subse pehle samjhte hain ke Head and Shoulders kya hota hai. Head and Shoulders ek bearish reversal pattern hota hai, jo market ke uptrend ko indicate karta hai. Isme teen parts hote hain: ek left shoulder, ek head, aur ek right shoulder. Left shoulder aur right shoulder head se kam price pe hotay hain aur head peak point pe hota hai.

          2. Inverse Head and Shoulders ki Tashkeel: Inverse Head and Shoulders, jise IHS bhi kaha jata hai, ye bullish reversal pattern hai. Iske formation mein bhi teen main parts hote hain: left shoulder, head, aur right shoulder. Lekin is pattern mein left shoulder aur right shoulder head se zyada price pe hote hain aur head valley point pe hota hai. Ye pattern downtrend ke baad uptrend ko indicate karta hai.

          3. Inverse Head and Shoulders Ki Tashkeel Ki Asas: Inverse Head and Shoulders pattern ki pehchan karne ke liye kuch mukhtalif karaaye jate hain. Isme important factors shamil hote hain:
          • Left Shoulder: Pehle, market mein downtrend hota hai jisme left shoulder form hota hai. Left shoulder ka formation normal market volatility ka hissa hota hai.
          • Head: Uske baad, price kam hoti hai aur ek significant dip hota hai jo head ke form hone ka reason banata hai. Is dip ke baad, market mein recovery hoti hai, lekin wo abhi bhi downtrend mein hoti hai.
          • Right Shoulder: Phir, price ek aur dip leti hai, lekin is dip mein left shoulder se kam dip hota hai. Right shoulder ke formation ke baad, price mein dobara se increase hota hai, jo ek potential trend reversal ko darusti indicate karta hai.

          4. Trading Strategies: Inverse Head and Shoulders ka identification ke baad, traders is pattern ko istemal karke apni trading strategies banate hain. Kuch common strategies include:
          • Entry Point: Traders entry point ko head ke upar ya right shoulder ke breakout ke baad set karte hain. Breakout ke baad, price mein significant increase hota hai, jo uptrend ka start indicate karta hai.
          • Stop-Loss: Stop-loss orders ko istemal karke traders apne positions ko protect karte hain. Ye ek predefined price level hota hai jahan par trader apni loss ko control mein rakhta hai.
          • Target Price: Traders apne target price ko left shoulder aur head ke high point ke basis par set karte hain. Isse, wo profit booking mein asani hoti hai.

          5. Conclusion: Inverse Head and Shoulders ek powerful technical analysis tool hai jo traders ko market trends aur reversals ko samajhne mein madad karta hai. Iske sahi tarah se samajhne aur istemal karne se, traders apne trading strategies ko improve kar sakte hain aur market movements ko behtar taur par anticipate kar sakte hain.

          Is article mein humne Inverse Head and Shoulders ke basic concepts, formation, aur trading strategies ko roman urdu mein explore kiya. Yeh pattern market participants ke liye ek useful tool ho sakta hai agar ise sahi tarah se samjha jaye aur istemal kiya jaye.


          • #20 Collapse


            Inverse Head and Shoulders?

            The Inverse Head and Shoulders pattern is a bullish reversal chart pattern that is commonly used in technical analysis to signal a potential change in the direction of a downtrend. This pattern is the opposite of the traditional Head and Shoulders pattern, which is bearish. The Inverse Head and Shoulders pattern is characterized by three lows with the middle low (the head) being lower than the two surrounding lows (the shoulders).

            Here are the key components and characteristics of the Inverse Head and Shoulders pattern:

            **1. Left Shoulder:
            • The pattern begins with a downtrend, and the left shoulder is formed as prices decline to a low point, followed by a minor rally.

            **2. Head:
            • The downtrend continues, and prices decline even further, forming a lower low. The lowest point in the pattern is referred to as the head. The head is typically lower than both the left and right shoulders.

            **3. Right Shoulder:
            • After the formation of the head, there is a subsequent rally in prices, forming the right shoulder. The right shoulder's high is typically lower than the head but higher than the left shoulder.

            **4. Neckline:
            • The neckline is a trendline drawn across the highs of the left shoulder, head, and right shoulder. It serves as a key level of resistance that the price needs to break above to confirm the reversal.

            **5. Volume:
            • Volume analysis is crucial when identifying the Inverse Head and Shoulders pattern. During the formation of the pattern, there is often a decline in volume as prices make lower lows. As the right shoulder is formed, there is an increase in volume during the rally, indicating potential strength in the reversal.

            Interpretation of the Inverse Head and Shoulders Pattern:

            The Inverse Head and Shoulders pattern is considered a bullish reversal pattern, signaling a potential shift from a downtrend to an uptrend. The breakout above the neckline is a key confirmation point for traders. The pattern suggests that after forming the right shoulder, buying interest has increased, and the bulls are gaining control.

            Trading the Inverse Head and Shoulders:
            1. Entry:
              • Traders often enter a long (buy) position once the price breaks above the neckline, confirming the reversal. Some traders wait for a pullback to the neckline after the breakout to enter at a more favorable price.
            2. Stop-Loss:
              • A stop-loss order is typically placed below the neckline to manage risk. If the price fails to sustain the breakout and falls back below the neckline, it may signal a false breakout.
            3. Target:
              • The target for the Inverse Head and Shoulders pattern is often calculated by measuring the distance from the head to the neckline and projecting it upward from the breakout point. This projection provides an estimated target for the potential upward move.

            Considerations and Caution:
            1. Confirmation:
              • While the Inverse Head and Shoulders pattern is a powerful reversal signal, traders often wait for confirmation from other technical indicators or patterns to increase the reliability of the signal.
            2. Volume Confirmation:
              • Volume analysis is important during the formation of the pattern. An increase in volume during the right shoulder and the breakout adds confirmation to the potential reversal.
            3. Market Conditions:
              • Consider the overall market conditions and other factors that might influence the effectiveness of the pattern. It's important to analyze the context in which the Inverse Head and Shoulders pattern appears.
            4. False Signals:
              • As with any technical pattern, false signals can occur. Traders should use the Inverse Head and Shoulders pattern in conjunction with other analysis tools for a more comprehensive assessment.

            In conclusion, the Inverse Head and Shoulders pattern is a bullish reversal pattern that traders use to identify potential trend reversals in the market. It is important to apply risk management techniques and consider other forms of analysis to enhance the reliability of trading decisions based on this pattern
            • #21 Collapse


              Inverse Head and Shoulders: Forex Tijarat Mein Kamyabi Ki Raah

              Inverse Head and Shoulders, yaani "Ulat Sir Aur Kandhay," ek aham technical analysis pattern hai jo forex tijarat mein istemal hota hai. Yeh pattern market trends aur price reversals ko pehchanne mein madad karta hai. Is article mein, hum 2000 lafz tak Inverse Head and Shoulders pattern ke hawale se malumat faraham karenge, Roman Urdu mein, taake aap samajh sakein ke kis tarah se yeh pattern traders ko trading opportunities provide karta hai.

              1. Inverse Head and Shoulders Kya Hai?

              Inverse Head and Shoulders (IH&S) ek price reversal pattern hai jo market mein downtrend ke baad uptrend ki shuruaat ko darust karta hai. Yeh pattern traders ko batata hai ke market mein bearish momentum kamzor ho raha hai aur ab bullish momentum shuru hone wala hai. Is pattern mein teen key components hote hain:
              • Head: Yeh pattern ka center point hota hai aur is usually market ke lowest point ko represent karta hai.
              • Shoulders: Head ke dono sides par hote hain aur market ke price mein reversals ko darust karte hain. Left shoulder market ke downtrend se uptrend ki taraf ki pehli move ko darust karta hai, jabke right shoulder mein price dobara girne lagti hai.
              • Neckline: Neckline ek imaginary line hoti hai jo left shoulder, head, aur right shoulder ko connect karti hai. Yeh line neckline ko form karte waqt draw ki jati hai.

              2. Inverse Head and Shoulders Ke Components:
              • Left Shoulder (Bayen Kandha): Left shoulder downtrend ke baad hone wali pehli reversal ko darust karta hai. Price left shoulder ke baad girne lagti hai aur phir se recover hoti hai.
              • Head (Sir): Head market ka lowest point hota hai. Is point par downtrend ka end hota hai aur price mein reversal hota hai. Head ke baad right shoulder ki shuruaat hoti hai.
              • Right Shoulder (Daien Kandha): Right shoulder head ke baad hota hai aur isme bhi price mein girawat hoti hai. Lekin, right shoulder ke end par price phir se recover hoti hai aur neckline ke upar jati hai.
              • Neckline (Gardan Rekha): Neckline left shoulder, head, aur right shoulder ko connect karti hai. Yeh line draw karte waqt traders ko dhyan rakhna chahiye ke yeh straight ho aur proper slope mein ho.

              3. Inverse Head and Shoulders Ki Tijarat Mein Istemal:

              Inverse Head and Shoulders pattern ko tijarat mein istemal karne ke liye traders ko kuch ahem points yaad rakhne chahiye:
              • Confirmation Ke Liye Wait Karein: Inverse Head and Shoulders pattern ke pehchanne ke baad, traders ko confirmation ke liye wait karna chahiye. Confirmation ke liye woh dekhte hain ke price neckline ko breakout karta hai aur volume bhi increase hota hai.
              • Volume Analysis: Volume analysis Inverse Head and Shoulders ke istemal mein ahem hoti hai. Agar price neckline ko breakout karte waqt volume bhi badh jata hai, toh yeh ek strong buy signal hota hai.
              • Price Target Calculation: Traders ko price target tay karna chahiye jese ke neckline se head ka distance calculate kar ke kiya ja sakta hai. Is distance ko head and shoulders ka "height" bhi kehte hain.
              • Stop-Loss Placement: Stop-loss placement bhi ahem hai. Traders ko dhyan rakhna chahiye ke agar price reversal expectations galat ho gayi aur market downtrend mein chala gaya, toh woh nuqsaan se bach sakein.

              4. Inverse Head and Shoulders Ke Faide:
              • Trend Reversal Ko Pehchanna: Inverse Head and Shoulders pattern se traders ko trend reversal ko pehchanna asaan ho jata hai. Yeh pattern indicate karta hai ke bearish trend khatam ho raha hai aur ab bullish trend shuru hone wala hai.
              • Entry Point Provide Karna: IH&S pattern traders ko clear entry point deta hai. Jab price neckline ko breakout karta hai, traders yahaan se long positions lete hain, ummid hai ke uptrend shuru ho ga.
              • Price Target Provide Karna: Head and shoulders ka height calculate kar ke traders ko price target tay karne mein madad milti hai. Is se woh tay kar sakte hain ke kitna munafa hasil kiya ja sakta hai.
              • Risk Management: Inverse Head and Shoulders pattern ke istemal se traders apni positions ka risk manage kar sakte hain. Stop-loss placement ke zariye, woh apne nuqsaan ko control mein rakh sakte hain.

              5. Inverse Head and Shoulders Ke Khatre:
              • False Signals: Har technical analysis pattern ki tarah, IH&S bhi false signals de sakta hai. Isliye, hamesha confirmation aur doosre indicators ka bhi istemal karna chahiye.
              • Low Volume Breakouts: Agar breakout low volume ke sath hota hai, toh yeh indicate karta hai ke market mein strong buying interest nahi hai. Aise mein, price reversal ke chances kam ho sakte hain.

              6. Psychological Aspects:
              • Patience: Inverse Head and Shoulders pattern ki pehchan mein aur uske signals ke wait karte waqt patience rakhna ahem hai. Market conditions thora waqt badal sakti hain.
              • Discipline: Traders ko Inverse Head and Shoulders pattern ke signals ke mutabiq amal karte waqt discipline banaaye rakhna chahiye. Emotionally driven decisions se bachne ke liye, unko apne trading plan ko follow karna chahiye.

              7. In Conclusion:

              Inverse Head and Shoulders pattern, apni distinctive shape aur signaling capacity ke liye mashhoor hai. Yeh traders ko downtrend ke baad hone wale potential uptrend ko pehchanne mein madad karta hai.


              Last edited by ; 25-02-2024, 08:56 PM.
              • #22 Collapse

                INVERSE HEAD AND SHOULDER PATTERNS

                INTRODUCTION OF INVERSE HEAD AND SHOULDER PATTERN:

                Inverse Head and Shoulders Pattern ik technical analysis pattern hy jis me stock price ki movement ko obsyrve kiya jata hy. Is pattern my stock ky price chart par ulta head or shoulders ki shape jaisi shape dikhayi deti hy. Ye pattern bullish reversal pattern hy jis me stock price ka trend down sy up ki taraf badalta hy.Inverse Head and Shoulders Pattern kafi popular hy or traders ye trading apni trading strategies ko improve karny ky liye karty hain. Ye pattern long term timeframes jaisy wekly or monthly charts par kam karta hy. Is pattern ky characteristics my price trend, volume or price movement shamil hy yeh pattern hamein intra forex trading marketing mein signal ko indicate krta hy Iss lye yeh indicator ky tour par Jana jata hy Iss ky kucch components neechy bayan kiye gye hain

                How can we use Inverse Head and Shoulders Pattern:
                • Bullish Reversal Signal:Hello dosto, Inverse Head and Shoulders pattern ik bullish reversal signal provide karta hy. Agar downtrend ky bad Inverse Head and Shoulders pattern appear hota hy or price neckline ko upar break karta hy, to ye bullish reversal ki possibility ko indicate karta hy.
                • Entry and Exit Points:Dear friends, Inverse Head and Shoulders pattern ko dikh kar traders apne entry or exit points determine kar sakty hain. Agar bullish reversal confirm ho jata hy, to traders long positions le sakty hain.
                • Stop Loss and Target Levels: Dear moziz traders, Trading decisions leny sy pehly, traders ko apne stop loss or target levels syt karna chahiye. Stop loss levels ko neckline ky nichy rakha ja sakta hy, jab ky target levels ko previous resistance levels ky as pas rakha ja sakta hy.
                • CONCLUSION:

                  Inverse Head and Shoulders Pattern ik powerful tool hy jo traders ko bullish reversal signals provide karta hy or trading my behtareen opportunities deta hy. Lekin is pattern ka istemal karny sy pehly traders ko market ki understanding or risk management ka dhyan dena chahiye taky wo sahih trading decisions le sakyin or apni investments ko protect kar sakyin. Is ky sath hi sahi entry or exit points ka dheyan rakhna bhi zaroori hy ta ky trading my successful hona mumkin ho saky.Inverse Head and Shoulders pattern ik popular technical analysis tool hy jo traders ky liye market my potential bullish reversals ko identify karny my help karta hy. Ye pattern typically downtrend ky bad any wale reversals ko indicate karta hy or traders ko market my potential buying opportunities ko pehchan ne my help deta hy yeh pattern intra forex trading marketing mein signal ko indicate krta hy jiss sy hum acchi earning kr sakty hain Aur hum iss pattern ko follow kr ky hum acchi earning kr sakty hain Aur yeh pattern ko istemal kar ky aik successful business kr sakty hain
                • <a href="https://www.instaforex.org/ru/?x=ruforum">InstaForex</a>
                • #23 Collapse

                  Inverse Head and Shoulders pattern ek bullish reversal pattern hai jo market mein downtrend ke baad uptrend ke shuru hone ka signal deta hai. Yeh pattern technical analysis mein kaafi popular hai aur traders ko potential buying opportunities identify karne mein madad karta hai.
                  ### Inverse Head and Shoulders ke Key Points:

                  1. **Pattern Structure**:
                  - Is pattern ka structure teen lows se mil kar banta hai: left shoulder, head, aur right shoulder.
                  - Center wala low, yani head, sabse neechay hota hai, jabke dono sides par shoulders equal ya almost equal height ke hote hain.

                  2. **Left Shoulder**:
                  - Pehli dip market ka pehla low banati hai, jo left shoulder kehlata hai.
                  - Iske baad price upar move karti hai, lekin previous high ko break nahi karti.

                  3. **Head**:
                  - Left shoulder ke baad market ek aur lower low banati hai, jo head kehlata hai.
                  - Yeh low sabse neechay hota hai, aur yeh pattern ka central point hota hai.

                  4. **Right Shoulder**:
                  - Head ke baad market wapas upar move karti hai, phir ek aur dip aati hai jo right shoulder banati hai.
                  - Right shoulder ka low left shoulder ke low ke aas paas hota hai, lekin head se upar hota hai.

                  5. **Neckline**:
                  - Neckline wo line hoti hai jo left aur right shoulder ke highs ko connect karti hai.
                  - Yeh horizontal ya slightly sloped ho sakti hai, aur is line ka breakout ek strong bullish signal hota hai.

                  6. **Breakout**:
                  - Jab price neckline ko cross kar ke upar close hoti hai, to yeh pattern complete hota hai.
                  - Is breakout ke baad market mein ek strong upward movement expected hoti hai.

                  7. **Volume**:
                  - Volume analysis is pattern mein important role play karta hai.
                  - Head ke formation ke dauran volume typically kam hota hai, lekin neckline breakout ke waqt volume increase hota hai.
                  - Yeh volume increase breakout ki validity ko confirm karta hai.

                  8. **Price Target**:
                  - Inverse Head and Shoulders pattern ka price target usually head se neckline tak ke distance ke barabar hota hai.
                  - Yeh target neckline se upar add kiya jata hai, jahan se breakout hua ho.

                  9. **Risk Management**:
                  - Is pattern mein stop-loss ko head ke low ke neeche set karna zaroori hota hai.
                  - Yeh stop-loss unexpected price reversal se bachne mein madad karta hai.

                  ### Conclusion:
                  Inverse Head and Shoulders ek reliable bullish reversal pattern hai jo traders ko market ke trend reversal ko identify karne mein madad karta hai. Is pattern ko pehchan kar aur sahi waqt par trade lena profitable ho sakta hai. Yeh pattern technical analysis mein ek powerful tool hai jo trading decisions ko better banata hai.

                  اب آن لائن

                  Working...
                  X