What's the Rounding Bottom Candlestick pattern

No announcement yet.
`
X
  • وقت
  • دکھائیں
Clear All
new posts
  • #1 Collapse

    What's the Rounding Bottom Candlestick pattern
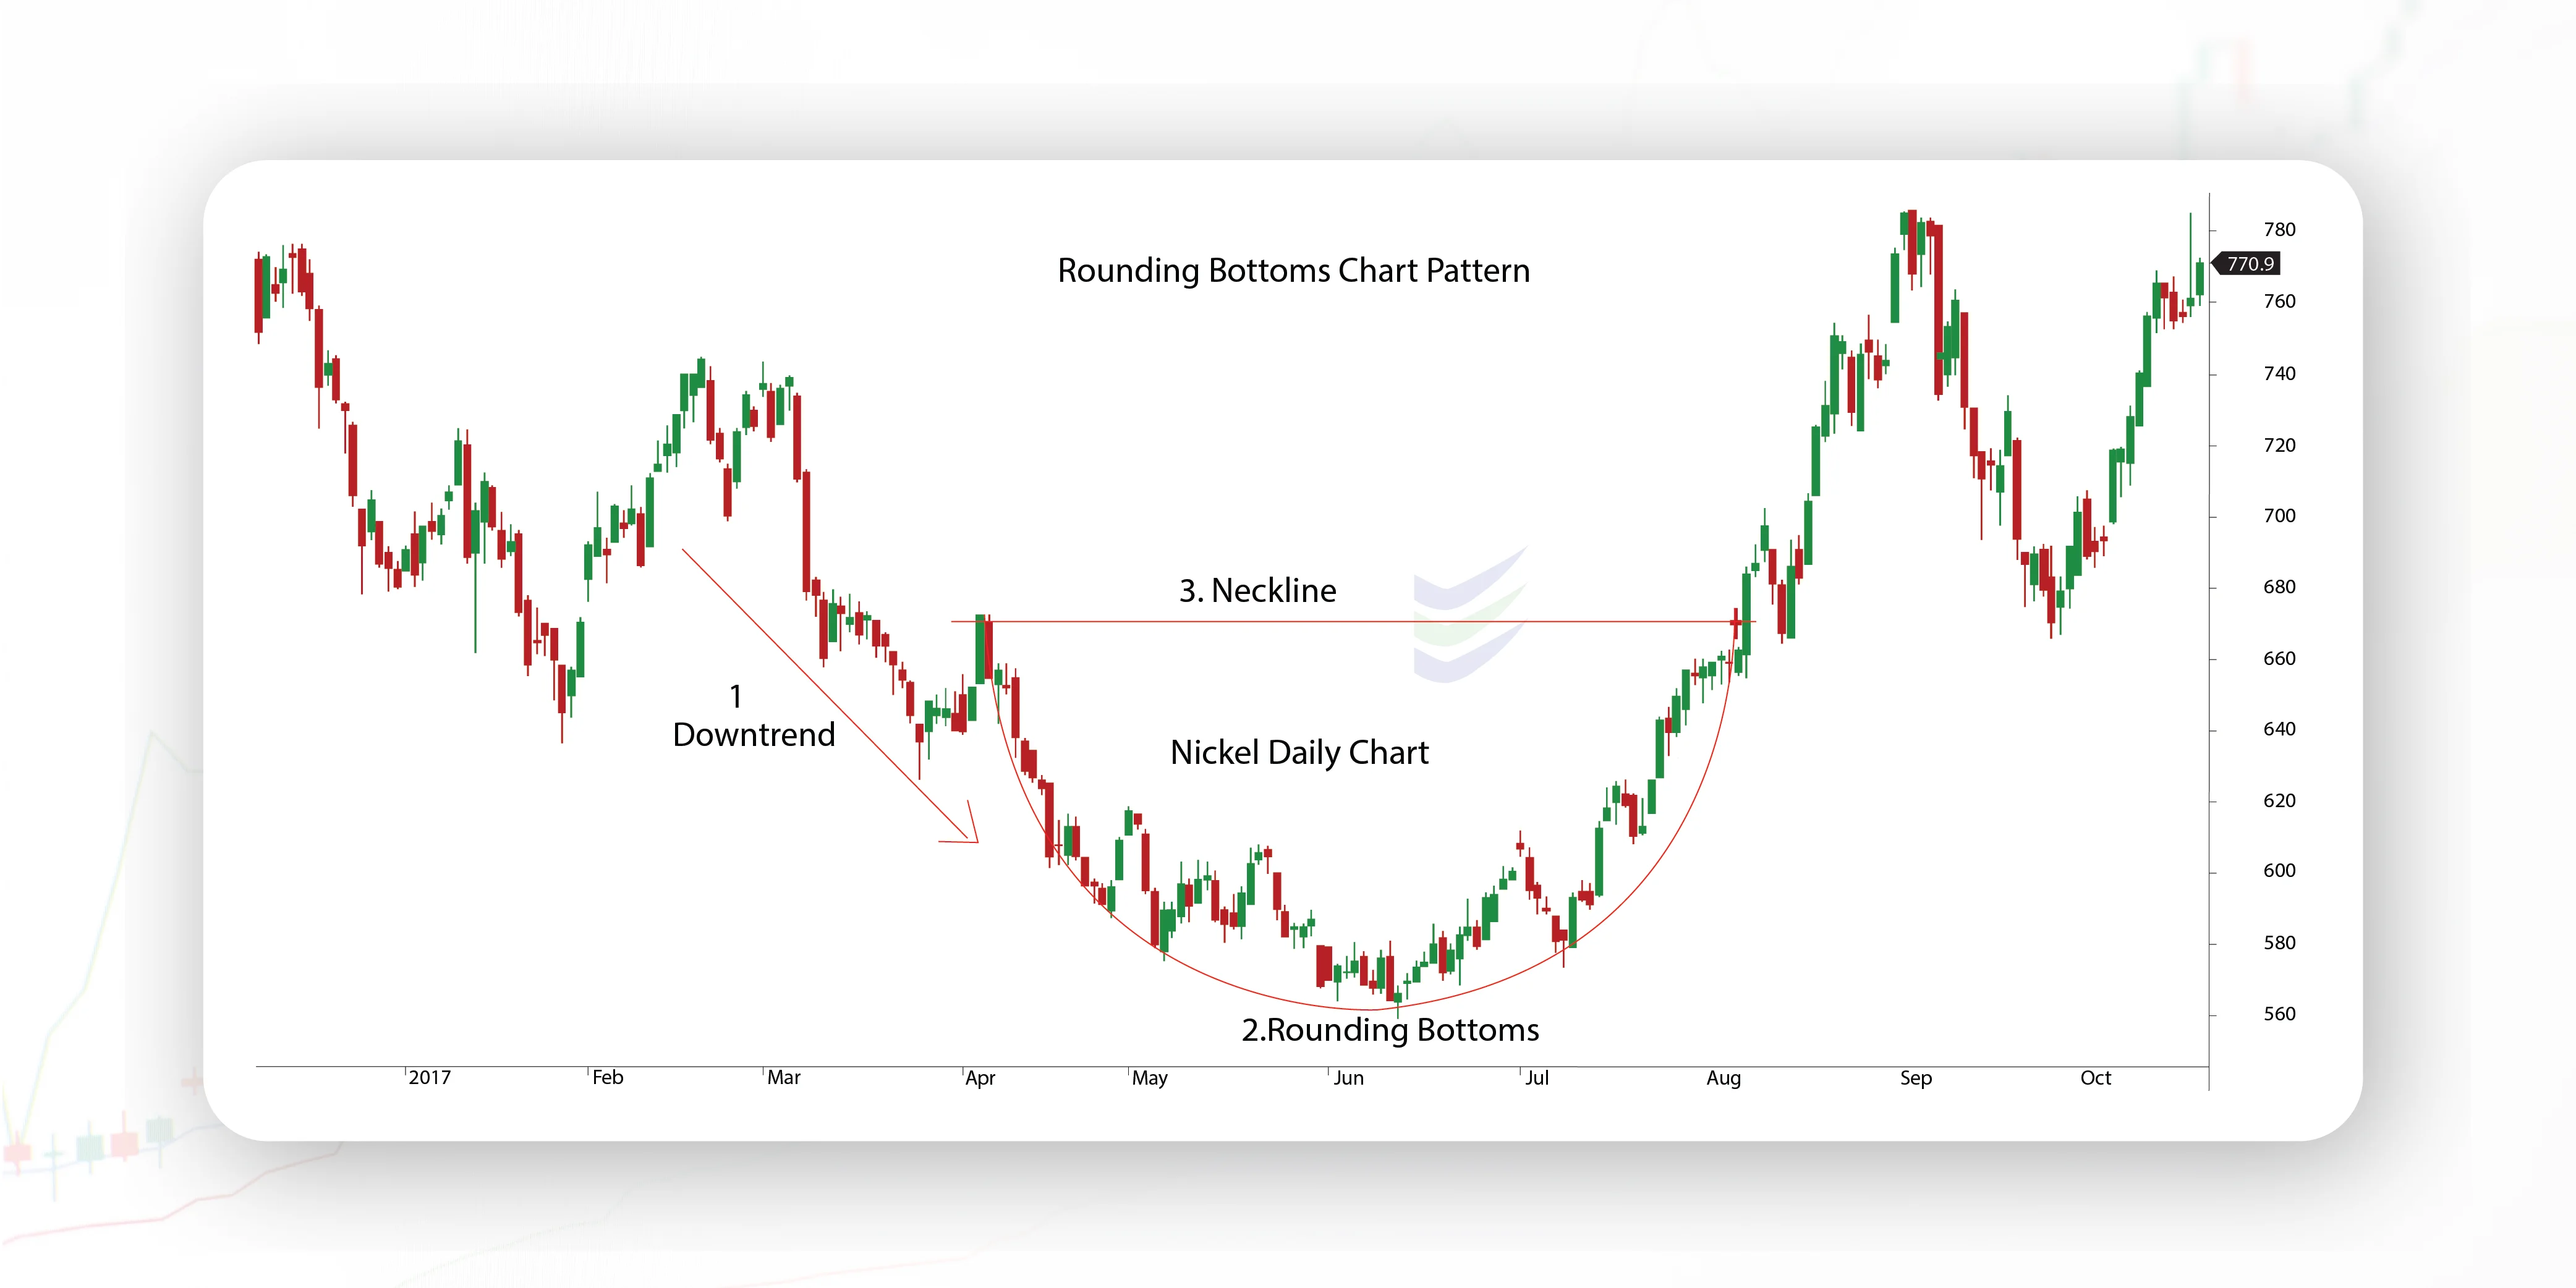
    Rounding Bottom Rounding Bottom Candlestick Pattern ek technical analysis ka hissa hai jo stock market mein istemal hota hai. Ye pattern market mein trend reversal ko darust karnay mein madadgar hota hai. Is pattern ka pehchan karna asaan hota hai jab chart par ek U-shaped curve ban jati hai, jo market ke downtrend ko indicate karti hai.

    Click image for larger version

Name:	image_127417.jpg
Views:	38
Size:	15.4 کلوبائٹ
ID:	12835236
    Jab market mein bearish trend hota hai aur prices neeche ja rahi hain, to Rounding Bottom pattern ka ubhar hota hai. Is pattern mein, prices mein gradual recovery hoti hai aur ek curve ban jati hai jiska neeche ka hissa bearish trend ko represent karta hai. Jab ye curve complete ho jati hai, aur prices ise breakout karte hain, to yeh ek bullish reversal signal provide karta hai.

    Is pattern ko samajhne ke liye, traders ko candlestick charts par focus rakhna hota hai. Har candlestick ek specific time period ko represent karta hai, jisme opening price, closing price, high aur low prices darust hoti hain. Jab Rounding Bottom pattern form hota hai, to candles gradual recovery ko darust karte hain.

    Jab ye pattern ban raha hota hai, traders ko dhyan rakhna chahiye ke volume bhi badhna shuru ho jata hai, jo ki bullish reversal ko confirm karta hai. Agar volume ke saath saath prices bhi badh rahi hain, to ye ek strong indication hai ke market mein trend reversal hone wala hai.

    Rounding Bottom pattern ke breakout ke baad, traders ko entry point ka dhyan rakhna chahiye. Entry point ka chayan candlestick patterns aur technical indicators ke madhyam se kiya ja sakta hai. Stop-loss orders ka sahi taur par placement bhi crucial hai taaki unforeseen market movements se bacha ja sake.

    Is pattern ki mukamal samajh ke liye, traders ko market ke fundamental factors ko bhi analyze karna chahiye jaise economic indicators, company performance, aur global events. Rounding Bottom pattern ek tool hai, lekin ise standalone indicator nahi samajhna chahiye. Sahi analysis ke liye, multiple indicators ka istemal kiya jana chahiye.

    In conclusion, Rounding Bottom Candlestick Pattern ek powerful tool hai jo market trends ko predict karne mein madad karta hai. Lekin, iska istemal karne se pehle thorough research aur analysis ki zarurat hoti hai taaki traders accurate decisions le sakein
    Click image for larger version

Name:	download (2).jpeg
Views:	46
Size:	16.0 کلوبائٹ
ID:	12835235
  • <a href="https://www.instaforex.org/ru/?x=ruforum">InstaForex</a>
  • #2 Collapse

    What is The Rounding Bottom Candlestick Pattern


    Rounding Bottom Candlestick pattern ek technical analysis ka concept hai jo kisi stock ya anya financial instrument ke price movement ko analyze karne ke liye istemal hota hai. Ye pattern traders aur investors ke liye ek indication provide karta hai ke ek asset ke price ka trend change hone wala hai.

    Rounding Bottom Candlestick pattern ko dekhne ke liye, traders candlestick charts ka istemal karte hain. Is pattern mein, price movement ek rounded shape create karta hai, jaise ek U ya J shape, jo ek potential trend reversal ki indication deta hai. Is pattern mein, initial phase mein price downward movement show karta hai, phir gradual recovery hoti hai aur phir ek neya uptrend shuru hota hai.

    Ye pattern usually ek prolonged downtrend ke baad dekha jata hai, jab market sentiment change hone ki possibility hoti hai. Jab price downward trend se recover karta hai aur ek rounded shape create karta hai, tab traders is pattern ko recognize karte hain. Ye pattern bullish reversal ko suggest karta hai, yaani ke price ka trend upward direction mein change hone wala hai.

    Rounding Bottom Candlestick pattern ko identify karne ke liye, traders ko price charts carefully observe karna padta hai. Is pattern mein, multiple candles ek rounded shape form karte hain, jo downtrend ke baad show hota hai. Is pattern ke pehle stage mein, price mein gradual decline hoti hai, phir ek base form hoti hai jisme price stabilize hoti hai. Phir gradual recovery dikhayi deti hai, jisse rounded shape create hota hai. Jab price ne rounded bottom create kar liya hota hai aur ek consistent uptrend dikhata hai, tab traders ko bullish reversal ki ummed hoti hai.

    Rounding Bottom Candlestick pattern ka istemal karne se pehle, traders ko confirmatory signals ka bhi dhyan dena chahiye. Ye include kar sakte hain volume increase, other technical indicators ke signals, ya fundamental analysis ki kuch factors. Confirmatory signals ki madad se traders ye verify kar sakte hain ke pattern ka reliability kya hai.

    Ye pattern ko successfully identify karne ke baad, traders ko entry aur exit points decide karne chahiye. Entry point usually tab decide kiya jata hai jab price ne rounding bottom complete kar liya hai aur uptrend shuru hota hai. Exit point ke liye, traders ko stop-loss aur target price levels set karna chahiye, jisse unhe profits secure karne aur losses minimize karne mein madad milti hai.

    Overall, Rounding Bottom Candlestick pattern ek powerful tool hai jo traders ko potential trend reversals ka pata lagane mein madad karta hai. Ye pattern ke istemal se, traders apne trading strategies ko improve kar sakte hain aur better decision-making kar sakte hain market mein. Lekin, jaise har technical analysis tool, is pattern ka bhi istemal careful analysis aur risk management ke saath kiya jana chahiye.
    • #3 Collapse

      What's the Rounding Bottom Candlestick pattern

      Title: "Rounding Bottom Candlestick Pattern: Ek Chakri Daar Mumkinat"

      Introduction: Rounding Bottom Candlestick pattern, ya ek chakri daar mumkinat, technical analysis mein ek aham candlestick pattern hai jo ke market trends aur price movements ko samajhne mein madadgar sabit ho sakta hai. Yeh pattern traders aur investors ko market ke future movements ke baray mein sochne mein madad karta hai. Is article mein, hum Rounding Bottom Candlestick pattern ke bare mein roman Urdu mein baat karenge aur iske key features aur implications par gaur karenge.

      Rounding Bottom Candlestick Pattern Ki Tafseelat:
      Rounding Bottom Candlestick pattern ek reversal pattern hai, jiska matlab hai ke jab yeh pattern market par dikhai deta hai, to yeh indicate karta hai ke asset ka price trend badalne wala hai. Is pattern ko identify karne ke liye, traders ko market ke charts par dhyan dena hota hai. Yeh pattern typically ek rounded shape banata hai, jise chakri ya bowl bhi kehte hain.

      Key Features:
      1. Saat Candlesticks: Rounding Bottom pattern ko confirm karne ke liye, traders ko typically market charts par saath consecutive candlesticks ko observe karna hota hai. Yeh candlesticks ek rounded shape banate hue dikhte hain, jise asset ke price mein gradual recovery ko represent karte hain.
      2. Volume Barhna: Jab Rounding Bottom pattern market charts par dikhai deta hai, to iske sath hone wale volume mein bhi izafah ki taraf ishara hota hai. Volume ka barhna indicate karta hai ke market mein interest aur activity badh gayi hai, jo ke price reversal ki sambhavna ko aur bhi majbooti deta hai.
      3. Breakout Point: Jab Rounding Bottom pattern complete ho jata hai, traders ko ek breakout point ka wait karna chahiye. Breakout point par asset ka price ek specific level ko paar karta hai, aur isse trend reversal ko confirm kiya jata hai. Breakout ke baad, traders ko potential buying opportunities mil sakti hain.

      Implications:
      Rounding Bottom Candlestick pattern ka sahi tarah se interpret karna aur samajhna market mein successful trading ke liye zaroori hai. Agar traders is pattern ko sahi taur par recognize karte hain, toh unhe market mein hone wale potential uptrend ko early stage mein identify karne mein madad milti hai. Is pattern ki sahi tafseelat aur uske saath hone wale factors ko samajh kar, traders apne investment decisions ko better banane mein kamyab ho sakte hain.

      Conclusion:
      Rounding Bottom Candlestick pattern market analysis ka ek important hissa hai jo traders ko future price movements ke baray mein behtar insight deta hai. Is pattern ko sahi taur par samajh kar, traders apne trading strategies ko improve kar sakte hain aur market trends ko successful taur par anticipate kar sakte hain.
      • #4 Collapse


        Rounding Bottom Candlestick pattern, ya "Daira Ban Bottom" candlestick pattern, ek ahem technical analysis pattern hai jo forex aur stock trading mein use hota hai. Is pattern ko dekh kar traders ko bullish reversal ka potential signal milta hai. Chaliye is pattern ko detail mein samajhte hain:

        Rounding Bottom Candlestick Pattern Ki Tafseel:

        Rounding Bottom pattern ek extended period ke baad dekha jata hai jab market mein ek downtrend hota hai aur phir price gradually bottom out karke stable ho jata hai. Is pattern ko dekhne par, chart par ek rounded shape ya "U" shape dikhayi deti hai.Click image for larger version

Name:	Untitled.png
Views:	40
Size:	6.4 کلوبائٹ
ID:	12835496
        • Shape: Is pattern ki shape ek bowl ya basin ki tarah hoti hai, jahan price pehle gradually down hoti hai phir stable ho jati hai aur phir phir se upar ki taraf move karti hai.
        • Volume: Is pattern ke formation ke doran volume normally decrease hota hai jab price bottom out kar rahi hoti hai. Jab price phir se upar ki taraf move karti hai, to volume bhi increase hota hai, indicating bullish momentum.
        • Timeframe: Rounding Bottom pattern ko dekhne ke liye usually kuch weeks ya mahine ka timeframe dekha jata hai. Is pattern ka formation thora sa time le sakta hai.

        Ahmiyat aur Tajziya:

        Rounding Bottom pattern ek bullish reversal signal provide karta hai traders ko. Jab yeh pattern form hota hai, to iska matlab hota hai ke downtrend khatam ho sakta hai aur bullish trend shuru hone wala hai.

        Is pattern ko dekh kar traders apne trading strategies ko adjust kar sakte hain aur long positions enter kar sakte hain expecting ki price mein upward movement hoga.


        Rounding Bottom pattern ka istemal karke traders ko market mein potential trend reversal ka pata lag sakta hai, jo unhe profit opportunities provide karta hai. Lekin, is pattern ki confirmation ke liye additional analysis aur confirmatory signals ki zaroorat hoti hai.

        Jaise ke har ek pattern ki tarah, Rounding Bottom pattern ko bhi sahi tareeke se identify aur confirm karna zaroori hai. Iske ilawa, proper risk management bhi hona chahiye trading decisions lene ke liye.
        Rounding Bottom Candlestick pattern forex aur stock trading mein ek ahem bullish reversal pattern hai jo traders ko potential profit opportunities provide karta hai. Is pattern ko samajh kar traders apne trading strategies ko improve kar sakte hain aur market trends ko sahi tareeke se samajh sakte hain. Lekin, har trading decision lene se pehle thorough analysis aur risk management ka hona zaroori hai.

        • #5 Collapse


          Rounding Bottom Candlestick Pattern in Forex Trading

          Forex trading mein, candlestick patterns traders ko market trends aur potential price reversals ka andaza lagane mein madad karte hain. Ek aham aur aksar dekha jane wala pattern hai "Rounding Bottom", jo market mein trend ka badalne ka sign ho sakta hai.

          1. Asal Tassavur Rounding Bottom Pattern ki

          Rounding Bottom pattern ek bullish reversal pattern hai jo market mein downtrend ke baad dikhai deta hai. Is pattern ko dekh kar traders expect karte hain ke market ka trend ab upar ki taraf change hone wala hai. Is pattern ko pehchanne ke liye, traders ko price action ko closely monitor karna hota hai, jismein prices gradual decline ke baad stabilize hone lagte hain aur phir dheere dheere upar ki taraf move karte hain.

          Click image for larger version

Name:	main-qimg-c5177bd947c26a172eba3a70f2a2e08c-lq.jpg
Views:	37
Size:	31.7 کلوبائٹ
ID:	12835969

          2. Pattern ki Pehchan

          Rounding Bottom pattern ki pehchan karne ke liye, traders ko candlestick charts par dhyan dena hota hai. Is pattern mein, ek series of low price points hote hain jo gradual decline ko represent karte hain. Phir ek point par prices stabilize hote hain aur phir dheere dheere upar ki taraf move karte hain, jo ki pattern ka bottom banata hai aur ek rounded shape deta hai.

          3. Entry aur Exit Points

          Is pattern ko samajhne ke baad, traders ko entry aur exit points determine karne hote hain. Jab pattern confirm hota hai, traders entry point par enter karte hain, usually jab price breakout karke pattern ke upper trend line ko cross karta hai. Exit point tab decide kiya jata hai jab price pattern ke opposite side move karta hai ya phir predefined target achieve hota hai.

          Click image for larger version

Name:	Rounding-Bottom-01.png
Views:	31
Size:	25.2 کلوبائٹ
ID:	12835970

          4. Risk Management

          Har trading strategy mein risk management ka bohot ahem kirdar hota hai. Rounding Bottom pattern ko trade karte waqt bhi traders ko apne risk ko manage karna zaroori hai. Stop loss orders lagana aur position size control karna is mein shamil hai taake nuqsanat kam kiye ja sakein agar trade galat ho.

          5. Misaal aur Practical Usool

          Rounding Bottom pattern ko samajhne ka behtareen tareeqa practical examples aur real-time market analysis se seekhna hai. Historical data aur real-time charts ki madad se traders ko pattern ko samajhna aur uska istemal karna seekhna chahiye taake wo apne trading decisions ko sahi taur par le sakein.

          Click image for larger version

Name:	Rounding-Bottom-Trading-Example-compressed.jpg
Views:	29
Size:	194.2 کلوبائٹ
ID:	12835971

          Rounding Bottom candlestick pattern ek powerful tool hai forex trading mein, jo traders ko market trends ka acha andaza lagane mein madad deta hai. Lekin, jaise har trading strategy mein hota hai, isko samajhna aur istemal karna practice aur patience ki zaroorat hoti hai.
          • #6 Collapse

            ### Rounding Bottom Candlestick Pattern Kya Hai?
            Rounding bottom candlestick pattern ek bullish reversal pattern hai jo market ke bearish trend ke baad banta hai. Yeh pattern market ki gradual reversal ko darust karta hai aur traders ko potential buying opportunities dikhata hai. Is post mein, hum rounding bottom pattern ki pehchaan, characteristics, aur trading strategies ke bare mein jaanenge.

            #### Rounding Bottom Pattern Ki Pehchaan

            Rounding bottom pattern ek U-shape ke tarah hota hai, jo price movements ke gradual transition ko darust karta hai. Is pattern ki do main phases hoti hain:

            1. **Declining Phase**: Is phase mein market gradually neeche ki taraf move karta hai. Yeh bearish trend ka hissa hota hai jahan price lower lows bana raha hota hai.

            2. **Bottom Formation**: Is phase mein price ek point par stabilize hota hai, jo rounding bottom ka core hota hai. Yeh point market ke bottom ko darust karta hai.

            3. **Rising Phase**: Iske baad price gradually upar ki taraf move karna shuru karta hai, jo bullish trend ka nishani hota hai. Is phase mein price higher highs banana shuru karta hai.

            #### Characteristics

            Rounding bottom pattern ki kuch khas characteristics hain:

            1. **Duration**: Yeh pattern typically long-term time frames par banta hai, jaise daily ya weekly charts. Iski duration kuch hafton se lekar maheenon tak ho sakti hai.

            2. **Volume**: Volume ka role is pattern mein bhi aham hai. Jab price bottom formation ki taraf move karta hai, toh volume kam hota hai. Lekin jab price rising phase mein aata hai, toh volume ka badhna bullish sentiment ko darust karta hai.

            3. **Support Level**: Is pattern ke formation ke dauran ek clear support level hota hai jahan price stabilize hoti hai.

            #### Trading Strategies

            Rounding bottom pattern ko trading strategy mein shamil karte waqt kuch aham baatein yaad rakhni chahiye:

            1. **Entry Point**: Traders apne buy orders ko price ke rising phase ke dauran set kar sakte hain, jab price previous resistance level ko cross kare.

            2. **Stop-Loss**: Risk management ke liye, stop-loss ko bottom formation ke neeche rakhein. Yeh aapko unexpected downward movements se bachata hai.

            3. **Target Setting**: Profit target ko previous highs ya Fibonacci retracement levels ke hisab se set karein. Is se aapko potential profit booking ka logical level milta hai.

            4. **Confirmation**: Rounding bottom pattern ka confirmation next few candlesticks se hota hai. Agar price momentum ke sath upward move karti hai, toh yeh bullish confirmation hota hai.

            #### Conclusion

            Rounding bottom candlestick pattern forex trading mein ek valuable tool hai jo traders ko market ke bullish reversal signals dene mein madadgar hota hai. Is pattern ko samajhkar aur sahi tarikon se istemal karke, aap apni trading strategies ko behtar bana sakte hain aur profitable decisions le sakte hain. Agar aap is pattern ko effectively pehchan lein, toh aap market ki bullish opportunities ka fayda utha sakte hain.
            • <a href="https://www.instaforex.org/ru/?x=ruforum">InstaForex</a>
            • #7 Collapse

              Rounding Bottom candlestick pattern, jise saucer bottom bhi kaha jata hai, ek bullish reversal pattern hai jo price action mein gradual change ko dikhata hai. Ye pattern aksar long-term downtrends ke baad banta hai aur ye market ki reversal ki strong indication deta hai. Rounding Bottom pattern, jaise naam se zahir hai, ek rounded shape mein develop hota hai. Ye pattern aksar do ya zyada months ya years ke duration mein banta hai, aur ye gradually price movement ko samjhaata hai. Jab ye pattern banta hai, to ye dikhata hai ke market mein selling pressure dheere dheere kam ho raha hai aur buyers ki demand barh rahi hai, jo is baat ka indication hai ke price eventually upar ki taraf move kar sakti hai.


              Rounding Bottom ki Formation
              Rounding Bottom pattern ka formation chaar main phases mein hota hai:
              1. Initial Decline: Ye phase tab shuru hota hai jab price market mein girawat ka shikar hoti hai. Is phase mein price lower highs aur lower lows banata hai, jo bearish sentiment ko indicate karta hai.
              2. Bottom Phase: Is phase mein price dheere dheere apne lowest point tak pahunchti hai. Ye gradual price decline typically chaar ya chhe weeks ya zyada samay tak chal sakta hai. Is phase ke dauran, price kabhi kabhi ek flat region mein move karti hai, jo buyers ki entry ka signal hota hai.
              3. Rounding Phase: Jab price apne lowest point par pahunchti hai, to ye dheere dheere upar ki taraf move karna shuru karti hai. Is phase ko rounding phase kaha jata hai, jahan price ek smooth curve mein upar aati hai. Ye dikhata hai ke sellers ka pressure dheere dheere kam ho raha hai aur buyers ki demand barh rahi hai.
              4. Breakout Phase: Ye last phase tab hota hai jab price apne previous highs ko break karti hai. Ye phase strong bullish sentiment ko indicate karta hai aur ye traders ke liye entry point ban sakta hai.
              Rounding Bottom ki Significance
              Rounding Bottom pattern ka technical analysis mein bohot zyada importance hai. Is pattern ke kuch key aspects yeh hain:
              1. Market Reversal Indicator: Rounding Bottom pattern bullish reversal ka strong indication hai. Jab ye pattern banta hai, to ye signify karta hai ke bearish trend ab apne end par hai aur market bullish hone ki taraf move kar raha hai.
              2. Gradual Change: Is pattern ki khasiyat ye hai ke ye gradual change ko dikhata hai. Ye abrupt price movements ya volatile markets ka hissa nahi hota, isliye ye zyada reliable hota hai.
              3. Volume Confirmation: Is pattern ki effectiveness ko confirm karne ke liye volume ka analysis bhi zaroori hai. Jab price upar ki taraf move karti hai, to agar volume bhi saath barhta hai, to ye bullish sentiment ko mazid confirm karta hai.
              Rounding Bottom Trading Strategies
              Rounding Bottom pattern ko trading mein istemal karne ke liye kuch effective strategies hain. In strategies ka maqsad is pattern ke formation ke baad entry aur exit points ko identify karna hai.

              1. Entry Point Identify Karna
              • Confirmation Ka Intezaar Karein: Is pattern ke formation ke baad, traders ko confirmation ka intezaar karna chahiye. Confirmation ka matlab hai ke doosre indicators, jaise ke moving averages, Relative Strength Index (RSI), ya volume analysis ke zariye market ki bullish trend ko samajhna.
              • Breakout Level: Agar price rounding bottom pattern ke upper resistance level ko break karti hai, to ye strong bullish signal hota hai. Is point par traders long position lena shuru kar sakte hain.
              2. Stop Loss Set Karna
              • Stop Loss ka Importance: Jab aap Rounding Bottom pattern ke zariye trade karte hain, to stop loss ka set karna bohot zaroori hota hai. Aam tor par stop loss ko rounding bottom ke lowest point ke neeche set karna chahiye. Ye aapko unexpected market movement se bachata hai.
              3. Profit Taking
              • Profit Targets: Jab aapne long position le li hai, to profit targets set karna bhi zaroori hai. Aksar traders apne targets ko previous resistance levels ya Fibonacci retracement levels ke mutabiq set karte hain. Ye targets aapko clear roadmap dete hain jab aapko apne profits book karne hain.
              • Trailing Stop: Jab market aapke favor mein move karta hai, to trailing stop loss ka use karke aap apne profits ko maximize kar sakte hain. Iska matlab hai ke jab market aapke target ko achieve karta hai, to aap apne stop loss ko bhi upar le ja sakte hain, isse aap zyada se zyada profit grab kar sakte hain.
              Rounding Bottom ki Analysis
              Rounding Bottom pattern ko analyze karne ke liye kuch factors par dhyan dena chahiye:
              1. Market Context: Is pattern ko samajhne ke liye market context ka hona bohot zaroori hai. Agar ye pattern kisi strong support level ke kareeb ban raha hai, to ye reversal ka strong signal ho sakta hai.
              2. Volume Analysis: Volume ka analysis bhi is pattern ki confirmation mein madadgar hota hai. Jab price rounding phase mein upar ki taraf move hoti hai, to agar volume bhi saath barhta hai, to ye bullish sentiment ko mazid confirm karta hai.
              3. Other Indicators: Is pattern ke saath doosre technical indicators ka istemal bhi important hota hai. Jaise ke RSI agar oversold zone se nikal raha hai, to ye is pattern ki confirmation mein madadgar hota hai.
              Risks Associated with Rounding Bottom Pattern
              Har trading strategy ke sath risks hote hain. Rounding Bottom pattern ke kuch common risks hain:
              1. False Signals: Ye pattern kabhi kabhi false signals de sakta hai. Market ki volatility ya unexpected news ki wajah se ye pattern fail ho sakta hai, isliye traders ko hamesha cautious rehna chahiye.
              2. Market Conditions: Aksar market conditions ke anusar ye pattern ki effectiveness badal sakti hai. Agar market bearish trend mein hai, to ye pattern kaam nahi kar sakta.
              3. Over-Reliance on Patterns: Sirf candlestick patterns par rely karna bhi risky ho sakta hai. Isliye hamesha multiple tools aur indicators ka istemal karna chahiye.
              Practical Example of Rounding Bottom Pattern

              Scenario: Stock XYZ
              • Stock XYZ ek long-term downtrend mein hai. Pehle do mahine mein, stock ne lower highs aur lower lows banaye hain, jo bearish sentiment ko indicate karte hain.
              • Phir stock ka price dheere dheere niche ki taraf move karta hai aur ek flat region mein pahunchta hai. Ye phase buyers ki demand ka signal hota hai.
              • Phir stock ka price dheere dheere upar ki taraf move karna shuru karta hai. Is dauran, stock ne ek smooth curve bana liya, jo rounding phase ka indication hai.
              • Jab stock apne previous resistance level ko break karta hai, to ye traders ke liye ek strong bullish signal ban jata hai.
              Is case mein traders ko confirmation ke liye volume aur doosre indicators ka istemal karna chahiye. Agar volume bhi saath barh raha hai, to ye is pattern ki effectiveness ko mazid confirm karta hai. Rounding Bottom candlestick pattern ek powerful bullish reversal pattern hai jo traders ko market ke potential reversals ko samajhne mein madad karta hai. Is pattern ki gradual formation aur bullish sentiment ki indication isko market mein zyada reliable banati hai.


              Traders ko is pattern ke saath entry points, stop loss, aur profit targets set karne par focus karna chahiye. Is pattern ke saath volume analysis aur doosre indicators ka istemal bhi zaroori hai taake aap better trading decisions le sakain.

              Trading mein kamiyabi ka raaz ye hai ke aap apne strategies ko continuously evaluate karein aur market ki changing conditions ke mutabiq adjust karein. Rounding Bottom pattern ek valuable addition hai aapke trading toolkit mein, lekin iski effectiveness ko samajhne ke liye patience aur discipline ki zaroorat hoti hai. Is pattern ko samajh kar aap apni trading strategies ko enhance kar sakte hain aur market mein successful ho sakte hain. Is tarah, Rounding Bottom candlestick pattern ek ahem tool hai jo long-term trends ko samajhne aur market reversal ko pehchanne mein madadgar hota hai. Iski correct identification aur analysis se aap market mein successful trading decisions le sakte hain.
              Believe in yourself and your abilities. When you fight for your dreams, you can achieve anything.

              اب آن لائن

              Working...
              X