What is Price Action Indicator:
X
  • وقت
  • دکھائیں
Clear All
new posts
  • #1 Collapse

    What is Price Action Indicator:
    What is Price Action Indicator:


    Price action Indicator aik takneeki tshkhisi tool hai jo mukammal tor par Price ki harkat par markooz hai aur dosray awamil ko nazar andaaz karta hai jis mein had ya waqt shaamil hai. yeh is khayaal par mabni hai ke tamam maloomat ko kharidari aur farokht ke intikhab karne ki zaroorat hoti hai jo fees mein hi mil sakti hai. Price action ke isharay is tasawwur par inhisaar karte hain ke qadeem charge ke iqdamaat mustaqbil ki fees ki simt ki paish goi mein madad kar satke hain. tajir jo Price action ke isharay istemaal karte hain woh tareekhi Price ke andaaz ka mushahida karte hain aur un ke andaaz ki bunyaad par salahiyat ke mustaqbil ke charge ke iqdamaat se aagah honay ki koshish karte hain.


    Types of Price Action indicators:


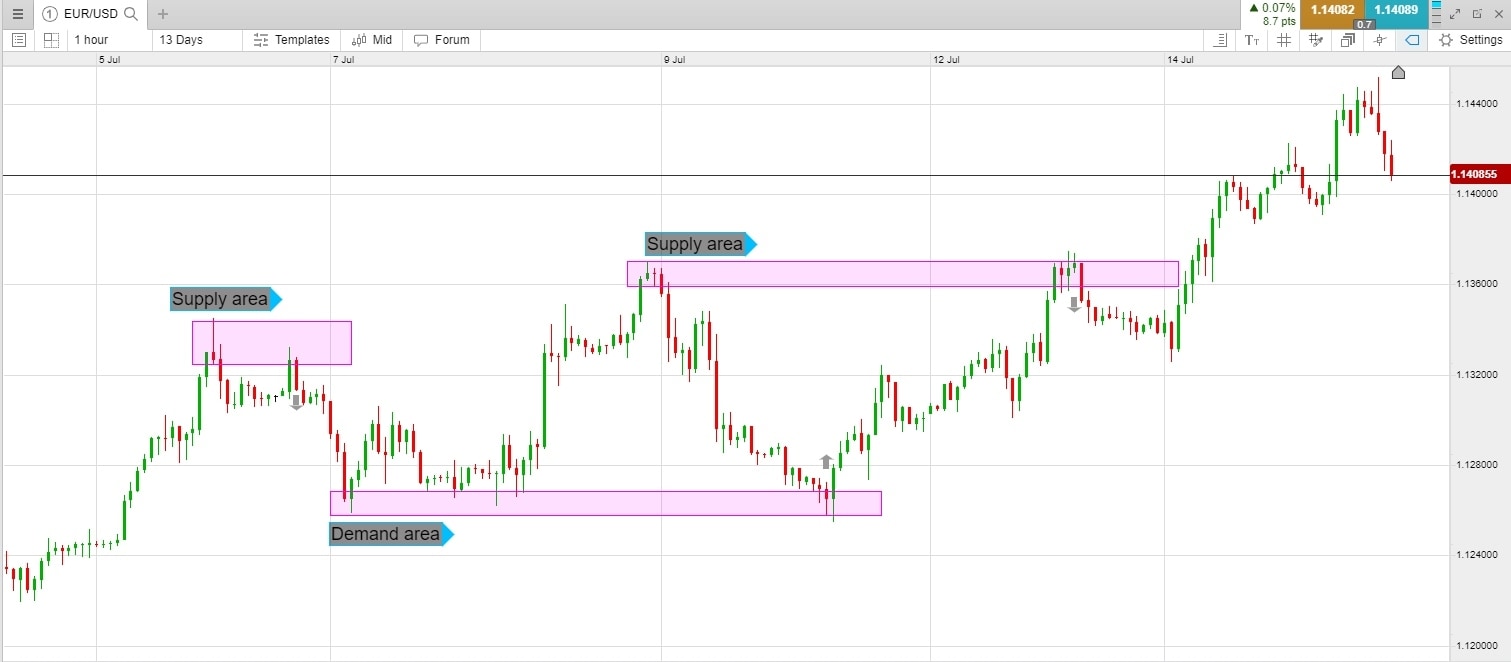
    Price action ke nishanaat ki kayi kasmain hain jo sarmaya car zar e mubadla ki tijarat mein istemaal karte hain. kuch aam Price action alamaat mein support aur muzahmat ki hudood, candle stick style, chart patteren aur trained lines shaamil hain. support aur muzahmat ke darjay sharah ke kaleedi darjay hain jin mein aik ghair mulki currency ke jore ne pehlay ulta rasta ikhtiyar kya hai, aur taajiron ka khayaal hai ke yeh hudood mustaqbil mein bhi barqarar reh sakti hain. mom batii ki chhari ke andaaz, doji, hathora, aur ghairay hue andaaz ke sath, bazaar ke jazbaat aur mumkina ulat palat ke baray mein basri isharay paish karte hain. chart ke namoonay jaisay sir aur kandhay, masalas, aur jhanday woh taskeel hain jin ka istemaal sarmaya car fees ke aamaal ki paish goi ke liye karte hain. rujhanaat, jo chart par soyng highs ya lovs ko jor kar tayyar kiye jatay hain, taajiron ko fashion ke course se aagah karne mein madad karte hain.


    Click image for larger version

Name:	PriceActionIndicators1.png
Views:	32
Size:	89.1 کلوبائٹ
ID:	12833450

    How to use Price Action indicator:


    Price action ke nishanaat ko ghair mulki currency ke taajiron ke zariye tijarti faislay karne ke liye istemaal kya jata hai jo ke peechay reh jane walay isharay ya bunyadi tajzia par inhisaar karne ke bajaye charge chalon ki bunyaad par hotay hain. tajir jo Price action Indicator istemaal karte hain woh charge chart par makhsoos namonon ya formation ki talaash karte hain jo salahiyat ki kharidari ya farokht ke mawaqay par dastakhat karte hain. misaal ke tor par, agar koi currency jori byorokrisi aik kaleedi imdadi marhalay par double bottom namona hai, to sarmaya car is ki tashreeh kharidari ki alamat ke tor par bhi kar satke hain. isi terhan, agar koi ghair mulki currency ka jora trained line ke tehat toot jata hai aur kam had tak barh jata hai, to tajir usay farogh dainay ke liye aik mandi ki alamat ke tor par bhi dekh satke hain. tijarti intabahat ki tasdeeq ke liye mukhtalif takneeki tajzia alaat ke sath mil kar Price action andikitrz ka istemaal kya ja sakta hai.


    Advantages of Price Action indicators:


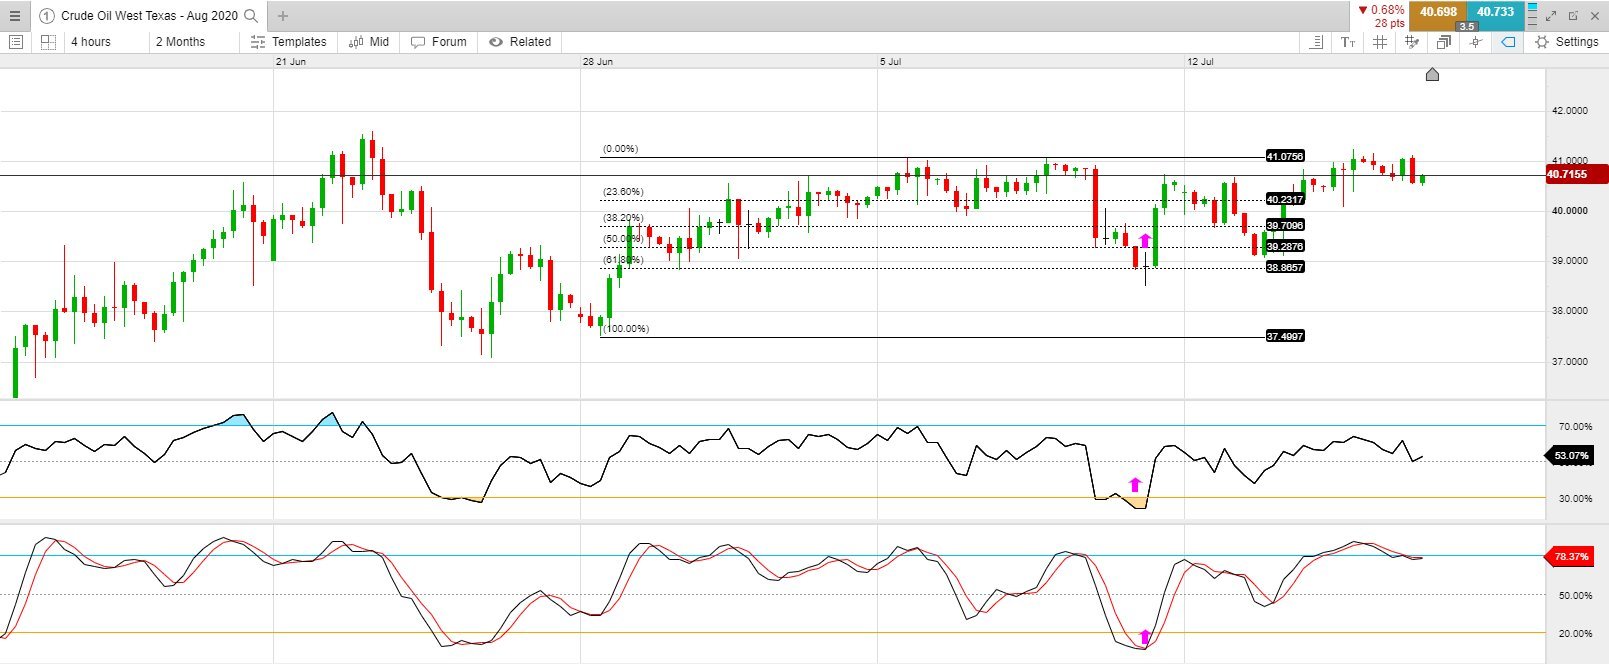
    Price action andikitrz ke ahem fawaid mein se aik yeh hai ke woh paicheeda mathematics tashkeel ya isharay par inhisaar kiye baghair sharah ki harkato ki tehqeeq ka aik aasaan aur aasaan tareeqa paish karte hain. Price action ke isharay bazaar ke jazbaat ki wazeh numaindagi faraham karte hain aur sarmaya karon ko bazaar ke bdalty hue halaat par fori radd amal zahir karne ki ijazat dete hain. Price action ke isharay sarmaya karon ko market ki harkiyaat aur Price ke ravayye ke baray mein gehri maloomat ko wasee karne mein bhi madad karte hain, jo faisla saazi ki salahiyaton aur khareed o farokht ki mustaqil mizaji ko barha satke hain. mazeed bar-aan, Price action ke isharay lachak dar hotay hain aur un ka itlaq kisi bhi time frame ya market place par kya ja sakta hai, jis se woh tamam sthon ke sarmaya karon ke liye mozoon ho jatay hain.


    Click image for larger version

Name:	price-action-indicator_body_tradingPA.png.full.png
Views:	28
Size:	40.1 کلوبائٹ
ID:	12833451

    Limitations of Price Action indicators:


    Agarchay Price action ke isharay bohat se fawaid faraham karte hain, lekin un ki hudood bhi hoti hain jin se sarmaya karon ko waaqif hona chahiye. Price action ke isharay qadeem Price ke record par munhasir hotay hain, aur is baat ki koi zamanat nahi ho sakti hai ke mustaqbil mein charge se bahar ke andaaz duhraey jayen ge. bazaar ke halaat jald baazi mein tabdeel ho satke hain, bunyadi tor par jaali intabahat ya achanak sharah ki naqal o harkat. Price action ke isharay bhi section ho satke hain, kyunkay ghair mamooli sarmaya car masawi Price ke namoonay ki tashreeh bhi kar satke hain. taajiron ko Price action ke ishaaron par ziyada ginti karne se mohtaat rehna chahiye aur inhen tajzia ki deegar shaklon ke sath mil kar qabil feham tijarti faislay karne ke liye istemaal karna chahiye. mazeed bar-aan, Price action ke isharay ko samajhney ke liye mashq aur tafreeh ki zaroorat hoti hai, lehaza nowarid sarmaya car sahih taleem ke baghair un ka sahih istemaal karne ke liye bhi jung kar satke hain.
  • <a href="https://www.instaforex.org/ru/?x=ruforum">InstaForex</a>
  • #2 Collapse

    Price Action Indicator:
    Price Action" ek trading technique hai jo ke forex, stocks, commodities aur anya financial markets mein istemal hoti hai. Is technique mein traders sirf price movements ko analyze karte hain, bina kisi indicators ya oscillators ke istemal ke. Price action traders market ki past price movements ko dekhte hain aur uske patterns, trends aur reversals ko samajhte hain taake wo future price movements ka anuman laga sakein. market mein sab kuch jhalakta hai - price charts par. Is technique mein traders candlestick patterns, price bars, aur chart formations ko dekhte hain jaise ke support aur resistance levels, trend lines, aur price ranges. Yeh sabhi factors unko market ke dynamics aur price behavior ke bare mein insights dete hain.

    ​​​​
    Working principal
    Ek popular price action indicator hai "Japanese candlesticks," jo ke price movements ko graphical aur visual taur par darust dhang se dikhata hai. Candlesticks ko dekh kar traders price ke open, high, low, aur close ke bare mein maloomat hasil karte hain, jo unko market sentiment aur direction ka pata lagane mein madad karta hai.Price action traders commonly use various candlestick patterns such as engulfing patterns, doji, hammer, shooting star, aur anya patterns ko identify karke trading decisions lete hain. In patterns ke through, traders price reversals, trend continuations, aur market entry aur exit points ko determine karte hain.


    Support and Resistance level of Price action
    Ek aur ahem price action indicator hai "support aur resistance" levels. Yeh levels market mein important points hote hain jahan price movement slow ho sakti hai ya phir reversals hone ke chances hote hain. Traders in levels ko identify karke price ke behavior ko samajhte hain aur unke trading strategies ko adjust karte hain.Overall, price action trading technique traders ke liye ek powerful tool hai jisse wo market ka behavior aur price movements ko samajh sakte hain. Is technique ko istemal karke traders apne trading strategies ko refine karte hain aur consistent profits earn karne ki koshish karte hain. Lekin yaad rahe ke price action trading mein patience, discipline, aur proper risk management ka istemal karna zaroori hai taake traders successful ho sakein.
    above the signal line. The stochastic
    • #3 Collapse

      Assalamu Alaikum Dosto!

      Price Action


      Agar aap charts par indicators ke seekhne se pareshan hain, to price action ki knowledge aapko asaan aur zyada asar-dar tareeqe se market ko dekhne me madadgar sabit ho sakti hai. Haalaanki, forex trading mein traders aksar alag alag tools ka istemal karte hain, main aapko sabse classic tareeqa batane ja raha hoon. Yeh ek price action trading system hai. Forex mein price action trading ek aisi trading method hai jo sirf peechle price ke behaviour ko analyze karne par mabni hai. Iska matlab hai ki ek trader market ke halat ko ek khula chart dekh kar bina kisi aur indicator ya oscillators ka istemal kiye analyze karta hai. Yeh market ko evaluate karne ka sabse asli tareeqa hai, aur maine paya hai ki yeh trading karne ka sabse asar-dar tareeqa hai. Price Action trading hamein darja zel cheezein karne me madad karti hai:
      1. Trend Pehchan

        Price action trading strategy mein sabse ahem amal trendon ko pehchanne ka hota hai. Aapne shayad suna hoga ki "Trend aapka saathi hai." Aur yeh bilkul sahi hai. Trend sach mein aapka saathi hai. Aap hamesha koshish karenge ki jab mauka mile to prevailing trend ke mutabiq trading karen.
      2. Consolidations Se Bachna

        Price consolidation tab hoti hai jab price ek clear direction ke bina range me chala ja raha hai. Iska matlab hai ki forex pair ki price badh rahi ya ghat rahi nahi hai. Yeh zyadatar trading opportunities nahi deti hai. Aksar traders ke liye ek acha trading qaidah yeh ho sakta hai ki jab price consolidate ho rahi hai, to market se dur rahein, taki false signals se bacha ja sake.
      3. Trend Reversals Dhoondhna

        Kuch traders tab currency pairs par attack karte hain jab trend lines exhaust hone lage hain. Iska karan yeh hai ki trend reversals aapko trend ke shuruaat par market me hone ka mauka dete hain. Reversals dhoondhte waqt traders koshish karte hain ki crowd se pehle market me dakhil ho jayein, taki aise trades par potential reward to risk ratio ko badhaya ja sake.
      4. Corrections Ki Tafseelat

        Trend correction tab hoti hai jab price prevailing trend ke mukhalif direction me move kar rahi hai. Aam taur par correction ya retracement sloping trendline se bounce kar leti hai, jo trend ki dobara shuruaat ko confirm kar sakta hai. Corrections aksar regular trend movement se kam price movement ke saath move karti hain. Isi dauran, corrections aksar regular trend movement ke samaan samay me banti hain. Dusri baat, agar aap correction trading kar rahe hain, to aapki position ek regular trend movement ke samaan samay me complete hogi. Yeh market ke andar harmonic relationships par mabni hai. Kuch traders ka khayal hai ki correction trend movements se bachna chahiye kyun ki actual trend movement significantly behtar mauke deti hai. Lekin dusri taraf, aise traders hain jo counter trend trading pasand karte hain. Agar aap market timing ko control kar sakte hain, to aap payenge ki corrections trading bhi kaafi munafa de sakti hai. Lekin am taur par, main manta hoon ki aapko agar abhi tak anubhavi trader nahi hain, to corrections trading karne ki koshish nahi karni chahiye.


      Important Tools for Price Action

      Price action trading strategy ke framework mein aam taur par indicators ka istemal nahi hota, price action traders alag alag chart patterns par bharosa karte hain. Main aapko market me payi jane wali kuch sabse mashhoor chart patterns se parichay kar raha hoon. Lekin various chart patterns par pahunne se pehle, chaliye thoda sa Support aur Resistance levels ka concept parichay kar lein.
      1. Support aur Resistance

        Support aur resistance on-chart levels hote hain, jahan se price ka reaction ummid ki jati hai. Yeh aksar psychological levels hote hain jahan investors ki rai milne ke zyada chances hote hain. Yeh levels chart par aasani se dekhe ja sakte hain. Jab aap dekhte hain ki price kai bar ek certain level se guzarne ki koshish kar rahi hai lekin wahan khareedne ya bechne ki dabav se milti hai, to aapke paas ek psychological level hota hai. Agar price is level ki taraf bullish direction me badh rahi hai, to yeh ek resistance hota hai. Aur dusri taraf, agar price bearish direction me is level ki taraf badh rahi hai, to yeh ek support hota hai. Yaad rakhein ki har support ko tod kar phir se resistance bana diya ja sakta hai. Waise hi resistance ke liye bhi yeh baat lagu hoti hai. Ise traders support aur resistance levels ko price action trading me dakhil hone aur bahar nikalne ke liye entry aur exit points set karne ke liye istemal karte hain.
      2. Trendlines

        Trend lines ek horizontal support ya resistance lines ke tarah kaam karte hain. Farq yeh hai ki ek trend line inclined hoti hai. Ek trend ko confirm karne ke liye hamein kam se kam do tops ya bottoms ko ek line se jodna hoga. Is line ki jariye trend ka potential hota hai. Har agli price movement is established trendline se bounce karne ka zyada chance rakhti hai. Traders trendlines ko istemal kar sakte hain jab price usse bounce karta hai ya jab price trendline ke nazdik pahunchta hai, to existing position se bahar nikalne ke liye istemal kar sakte hain.
      3. Channels

        Price channels bhi trend line ki tarah kaam karte hain. Farq yeh hai ki channels ek aur level ke saath hoti hain, jo trend ke saath ek corridor banata hai. Jab hum chart par ek channel confirm karte hain, to hume ummid hoti hai ki price upper aur lower level of the channel se bounce karegi jaise ping pong ball. Yeh price action trader ko saaf dikha deta hai ki price kab direction badlegi aur kitne der tak us direction me jayegi. Iske alawa, adhik anubhavi traders actual trend movement ke alawa trend corrections bhi trade karne ke liye channels ka istemal kar sakte hain.


      Candlestick Patterns


      Candle patterns ka istemal price action traders ke liye ek bahut aam technique hai. Candlestick patterns charts par mukhtalif candle formations hote hain, jo alag-alag price potential ke isharon ko bata sakte hain. Chaliye kuch aam candle patterns par ek nazar dalte hain.
      1. Doji

        Doji candle chart par pehchanne me kaafi asan hai. Doji tab hoti hai jab price ek certain level par candle open karta hai aur phir usi level par candle close karta hai. Is tarah, Doji ek wick ke saath ek dash ki tarah dikhta hai. Doji candle market me uncertainty ko darust karata hai, aur kayi baar yeh trend ke baad exhaust hone ke baad exhaustion point ka ishara deta hai.
      2. Hammer aur Hanging Man

        Yeh do candles bilkul same dikhte hain. Inme ek lambi bearish wick aur ek head hota hai. Lekin in dono candles mein farq yeh hai ki Hammer ek bearish trend ke ant me hota hai aur potential reversal ka ishara karta hai, jabki Hanging Man aksar bullish trend ke ant me paya jata hai, jise ane wale reversal ka ishara hota hai.
      3. Inverted Hammer aur Shooting Star

        Inverted Hammer aur Shooting Star bhi bilkul same dikhte hain. Aur yeh dono Hammer aur Hanging Man ke bilkul ulte-mirrored image hote hain. Inme ek lower body aur ek lambi bullish candle wick hoti hai. Inverted Hammer ka istemal Hammer ki tarah hota hai. Jab aap ise bearish trend ke ant me paate hain, to aap ummid karte hain ki price badhegi. Ussi tarah, agar aap ek bullish trend ke ant me Shooting Star dekhte hain, to aapko price mein ghatne ki ummid hai.


      Chart Patterns


      Chart patterns mukhtalif formations aur figures hote hain jo chart par dikhne wale hote hain aur potential trend continuations aur reversals ke isharon ko dete hain. Chart patterns ki ek visheshta yeh hai ki pattern ko analyze karke hum trade ke liye potential targets set kar sakte hain. Kayi bar, chart patterns forex pair ko formation ke size ke barabar ek amount se move karne ki potential rakhte hain. Ise aksar ek measured move ke roop me refer kiya jata hai. Chart patterns ke success rates 60% - 65% ke upar bhi ho sakti hain, depending on the chart pattern and how it is traded. Ab main kuch sabse reliable chart patterns par baat karne wala hoon:
      1. Double Top aur Double Bottom

        Double top aur double bottom reversal chart patterns hote hain, jahan trend ke ant me price do tops (ya bottoms) lagbhag ek hi level par banata hai. In dono tops ke beech ka bottom signal level hota hai. Jab price signal level ko todta hai, hum formation ko confirm samajhte hain aur uske mutabiq ek position kholte hain. Phir hum market ko follow karte hain jab tak hum formation ke size ke barabar ek target tak pahunchte hain. Double bottom formation bhi waisa hi dikhta hai, lekin ulta. Yeh bearish trend ke ant me dikh sakta hai aur price movement ko double top ki tarah reverse kar sakta hai. Isi tarah, yeh double top formation ki tarah hi trade kiya jana chahiye, lekin opposite direction me.
      2. Head and Shoulders aur Inverted Head and Shoulders

        Head and shoulders ek reversal chart pattern hai, aur trade karne ke liye sabse bharosemand chart patterns me se ek hai. Head and shoulders formation tab hoti hai jab price teen spikes create karta hai, is order me - ek lower, ek higher aur ek aur lower, lagbhag pehle wale ke level par. Traders is formation ko head and shoulders kehte hain kyunki, aapne sahi samjha, yeh sach mein ek head aur shoulders ki tarah dikhta hai. Head and shoulders aksar bullish trend ke ant me dikhate hain. Ussi tarah, inverted head and shoulders aksar bearish trend ke ant me paye jate hain. Dono formations bilkul same dikhte hain, lekin ulte-mirrored image ki tarah. Jab aapko ek head and shoulders formation milta hai, to aapko ek signal line, jo ki neck line kehte hain, set karni chahiye. Neck line straight line hoti hai, jo dono bottoms ko jodti hai aur head ke beech create hoti hai. Jab price neck line ko todta hai, aap ek position kholte hain aur formation ke size ke barabar ek price movement ko target karte hain. Inverted head and shoulder formation bhi waisa hi kaam karta hai, lekin bearish trend ke ant me dikh sakta hai, jise bullish direction me reverse karta hai.
      3. Rising Wedge aur Falling Wedge

        Rising wedge tab hoti hai jab price higher tops aur even higher bottoms ke saath close hoti hai. Aur falling wedge tab hoti hai jab price lower bottoms aur even lower tops ke saath close hoti hai. Rising wedge falling wedge ki tarah hi potential rakhti hai, lekin opposite direction me. In dono formations ek dusre ke mirror image hote hain. Rising aur falling wedge overall trend ke sambandh me dikhne ke baad trend reversals ya trend confirmations ho sakte hain. Agar aapko bullish trend ke baad rising wedge milta hai, to yeh aksar price ko reverse hone ki ummid deta hai. Ussi tarah, agar aapko bearish trend ke dauran falling wedge dikhta hai, to yeh trend ko reverse hone ki ummid hoti hai. Agar yeh aapko confusing lag raha hai, to bas yaad rakhein ki rising wedge aksar ane wale bearish movement ki taraf ishara karta hai, jabki falling wedge mein aksar price badhne ki ummid hoti hai. Yehi strategy rising wedges ke liye lagu hoti hai. Agar rising wedge ek price increase ke baad ban jati hai, to yeh reversal pattern hoti hai aur humein price drop ki ummid hoti hai. Ussi waqat, agar falling wedge bullish trend ke baad dikh rahi hai, to yeh formation trend confirmation character rakhti hai.


      • #4 Collapse

        What is Price Action Indicator:


        Click image for larger version

Name:	download - 2024-02-17T195310.218.png
Views:	29
Size:	7.1 کلوبائٹ
ID:	12833615

        Price Action Indicator (Keemat Karwai Indicator)

        Price action indicator forex trading mein ek aham tool hai jo traders ko market ke price movements aur patterns ko analyze karne mein madad deta hai. Yeh indicator chart patterns, candlestick formations, aur price levels ko istemal karta hai taake traders ko market ki direction aur potential entry/exit points ka pata chal sake.

        Price Action Indicator Ki Tafseel:

        Price action indicator ka istemal market ke actual price movements par mabni hota hai, bina kisi aur indicator ya mathematical formula ke. Iska maqsad price action patterns ko samajhna aur unse trading decisions banana hota hai.

        Price Action Indicator Ke Fayde:
        1. Clear Market Analysis: Price action indicator ke istemal se traders ko clear market analysis milta hai. Price action patterns aur candlestick formations ke through, market trends aur reversals ko samajhna asaan ho jata hai.
        2. Simplicity: Yeh indicator simple hai aur traders ko complex calculations ya indicators ki zarurat nahi padti. Iske istemal se trading process simplification hoti hai.
        3. Real-Time Insights: Price action indicator traders ko real-time insights provide karta hai, kyunki yeh market ke current price movements par based hota hai. Isse traders ko immediate trading opportunities ka pata chalta hai.
        4. Versatility: Yeh indicator versatile hai aur alag-alag timeframes aur market conditions mein bhi effectively istemal kiya ja sakta hai.

        Price Action Indicator Ka Istemal:
        1. Chart Patterns: Price action indicator ke through traders chart patterns jaise ke head and shoulders, triangles, aur flags ko identify kar sakte hain, jo market trends aur reversals ko darust karte hain.
        2. Candlestick Formations: Candlestick formations ko samajh kar traders ko price action indicator se entry aur exit points ka pata lagta hai. Bullish aur bearish candlestick patterns ke analysis se market direction ka andaza lagaya ja sakta hai.
        3. Support aur Resistance Levels: Price action indicator ke istemal se traders support aur resistance levels ko bhi identify kar sakte hain, jo market mein key price levels ko represent karte hain.

        Price action indicator ek powerful tool hai jo traders ko market ke price movements ko analyze karne mein madad deta hai. Iske simple aur effective nature ki wajah se, yeh beginner se le kar experienced traders tak ke liye useful hai.
        • #5 Collapse


          What is Price Action Indicator:

          In the world of financial markets and trading, the Price Action indicator stands out as a unique approach that relies on the purest form of market analysis – the movement of prices themselves. Unlike traditional technical indicators, Price Action focuses on interpreting price charts directly, providing traders with valuable insights into market sentiment, trends, and potential entry or exit points. In this article, we'll explore the essence of Price Action, its principles, and how traders can harness its power for effective decision-making.


          Understanding Price Action:
          1. Price Action Defined:
            • Price Action refers to the study of price movements on a chart, including patterns, trends, and key support and resistance levels.
            • Instead of relying on lagging indicators, Price Action traders analyze historical price data and make decisions based on how the market has behaved in the past.
          2. Candlestick Analysis:
            • Candlestick patterns are a cornerstone of Price Action analysis. Traders interpret the shapes and patterns formed by candlesticks to identify potential trend reversals, continuations, or indecision in the market.
          3. Support and Resistance:
            • Identifying support and resistance levels is crucial in Price Action analysis. These levels, derived from historical price movements, act as key reference points for traders in determining potential entry and exit points.
          4. Trend Analysis:
            • Price Action traders focus on identifying trends through higher highs and higher lows in an uptrend, or lower highs and lower lows in a downtrend.
            • Trendlines drawn on the chart assist in visualizing the direction and strength of market trends.

          Principles of Price Action Trading:
          1. Naked Trading:
            • Price Action traders often engage in "naked trading," meaning they analyze charts without the use of traditional indicators or oscillators.
            • This approach emphasizes a clean chart, allowing traders to develop a keen understanding of price dynamics.
          2. Reading Market Sentiment:
            • By interpreting candlestick patterns and the positioning of price bars, traders can gauge market sentiment. For example, a series of bullish candles may indicate strong buying interest.
          3. Context Matters:
            • Price Action traders consider the broader context of the market, taking into account the overall trend, recent price history, and potential upcoming events.
            • Contextual analysis helps traders make more informed decisions and avoid relying on isolated price movements.

          Benefits of Price Action Trading:
          1. Adaptability:
            • Price Action principles are applicable across various financial instruments and timeframes, making it a versatile approach for traders.
          2. Reduced Lag:
            • Unlike traditional indicators that lag behind price movements, Price Action provides real-time insights into market dynamics.
          • #6 Collapse

            **Price Action Indicator Kya Hai?**
            Forex trading mein, price action indicator ek ahem tool hai jo traders ko market ke price movements ko samajhne aur trading decisions lene mein madad karta hai. Yeh indicator market ki past price movements ko analyze kar ke future trends aur potential reversals ko predict karne mein madadgar hota hai. Price action trading ek popular aur effective approach hai jo complex indicators se door rehte hue, price ke direct movements par focus karti hai.

            **Price Action Indicator Ka Concept**:

            Price action indicator ka mool principle yeh hai ke market ke price movements aur patterns ko observe karke trading decisions liye jayein. Isme technical indicators, charts aur candlestick patterns ki madad se price ke historical data ko analyze kiya jata hai. Yeh indicator traders ko market ki real-time conditions ko samajhne aur unse profit kamane mein madad karta hai.

            **Key Features**:

            1. **Historical Price Data**: Price action indicator price ki past data aur movements ko analyze karta hai. Yeh traders ko market ke patterns aur trends ko identify karne mein madad karta hai, jo future price movements ko predict karne ke liye use kiya jata hai.

            2. **Candlestick Patterns**: Price action trading mein, candlestick patterns jaise Doji, Engulfing, aur Pin Bar ko analyze kiya jata hai. Yeh patterns market ke potential reversals aur continuation signals ko dikhate hain, jo trading decisions ko support karte hain.

            3. **Support Aur Resistance Levels**: Price action indicator market ke support aur resistance levels ko identify karta hai. Yeh levels price ke reversal points aur potential breakout zones ko indicate karte hain. Traders in levels ko apni trading strategy mein incorporate karte hain.

            4. **Trendlines Aur Chart Patterns**: Trendlines aur chart patterns jaise Head and Shoulders, Triangles, aur Flags bhi price action trading ka hissa hote hain. Yeh patterns market ke trends aur price movements ko visualize karne mein madadgar hote hain.

            **Benefits**:

            1. **Simplicity Aur Clarity**: Price action trading simple aur clear hoti hai. Isme complex technical indicators aur lagging signals ki zaroorat nahi hoti. Traders direct price movements aur patterns par focus karte hain.

            2. **Real-Time Analysis**: Price action indicator real-time price data ko analyze karta hai, jo traders ko immediate trading decisions lene mein madad karta hai. Yeh market ki current conditions ko reflect karta hai.

            3. **Flexibility**: Price action trading different market conditions aur timeframes par apply ki ja sakti hai. Yeh short-term aur long-term trading strategies ke liye bhi effective hoti hai.

            **Implementation Aur Risk Management**:

            Price action trading ko effective banane ke liye, traders ko practice aur experience ki zaroorat hoti hai. Trading strategies ko risk management techniques ke sath combine karna zaroori hai. Stop-loss orders aur position sizing ko use karke risk ko control kiya ja sakta hai.

            **In Summary**:

            Price action indicator forex trading mein ek valuable tool hai jo market ke price movements aur patterns ko analyze karke trading decisions ko support karta hai. Yeh simplicity, real-time analysis, aur flexibility offer karta hai. Effective price action trading ke liye practice aur risk management strategies ka use zaroori hai. Yeh approach traders ko market ke trends aur potential reversals ko accurately identify karne mein madad karti hai.
             
            • <a href="https://www.instaforex.org/ru/?x=ruforum">InstaForex</a>
            • #7 Collapse

              ### Price Action Indicator Kya Hai?
              Price Action Indicator ek trading tool hai jo market ki price movements ko analyze karne ke liye istemal hota hai. Yeh indicator traders ko market ki current situation aur future trends ka andaza lagane mein madad karta hai, bina kisi additional indicators ya lagging data ke. Is indicator ka maqsad price ki movement par focus karna hai, jo ke ek trader ke liye sab se ahem information hoti hai.

              **Price Action Ki Bunyadi Taqreeb:**

              Price action trading ka asal maqsad price ki movements aur unki history ko samajhna hai. Traders price charts par candlestick patterns aur support-resistance levels ko dekhtay hain taake yeh samajh saken ke market kis direction mein ja raha hai. Is trading strategy ka sabse bara faida yeh hai ke yeh market ki real-time conditions par focus karti hai.

              **Price Action Indicator Ki Shakal:**

              Price action indicators aksar candlestick patterns, trend lines, aur chart patterns par mabni hote hain. Kuch common patterns jo price action trading mein dekhe jate hain:

              1. **Pin Bars:** Yeh reversal candles hoti hain jo price action ka strong indication deti hain. Agar pin bar upper shadow ke sath banti hai, to yeh bearish reversal ka signal hota hai.

              2. **Inside Bars:** Yeh do candles par mabni hoti hain jahan doosri candle pehli candle ke andar hoti hai. Iska matlab market mein indecision hai, aur is se breakouts ka andaza lagaya ja sakta hai.

              3. **Support and Resistance Levels:** Yeh levels market ki key areas ko darust karte hain jahan price aksar reverse hoti hai. Traders in levels par entry aur exit points identify karte hain.

              **Trading Strategy:**

              Price action trading strategy ko istemal karte waqt traders ko price ke patterns aur movements par focus karna chahiye. Jab price kisi support ya resistance level tak pahunchti hai, to traders ko watch karna chahiye ke price kaise react karti hai. Agar price support level par bounce karti hai, to yeh buy signal ho sakta hai, jabke resistance level par reversal bearish signal ho sakta hai.

              **Confirmation Aur Risk Management:**

              Price action trading ko confirmatory signals ke sath istemal karna chahiye. Traders ko dusre technical indicators ka bhi istemal karna chahiye taake unke decisions aur mazboot ho sakein. Risk management bhi bohot zaroori hai; Stop-loss orders ka istemal karna na bhooliye taake aapke nuksan ko limit kiya ja sake.

              **Conclusion:**

              Aakhir mein, Price Action Indicator trading ka ek powerful tool hai jo traders ko market ki asli halat ko samajhne mein madad karta hai. Yeh strategy price movements par focus karti hai, jo trading decisions ko behtar banati hai. Sahi tarike se istemal karne par, price action trading aapki profitability ko barhane ka sabab ban sakti hai.
               

              اب آن لائن

              Working...
              X