Bullish Pin Bar Candlestick Pattern,rationalization.
X
  • وقت
  • دکھائیں
Clear All
new posts
  • #1 Collapse

    Bullish Pin Bar Candlestick Pattern,rationalization.
    The Bullish Pin Bar candlestick pattern is a significant indicator in technical analysis, often signaling potential reversals or shifts in market sentiment. Let's rationalize the pattern

    Definition
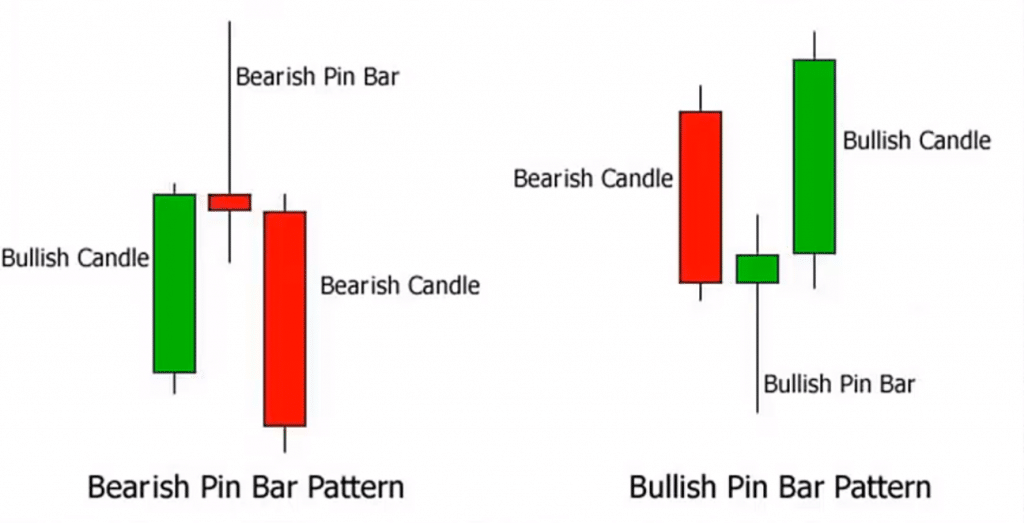
    The Bullish Pin Bar, also known as the hammer, is characterized by a single candle with a small body, a long lower shadow, and little to no upper shadow. The small body is usually at the top of the candle, and the long lower shadow extends below the body, resembling a pin. This formation typically appears after a downtrend

    Market Sentiment
    The Bullish Pin Bar suggests a rejection of lower prices. The long lower shadow signifies that sellers attempted to push the price lower but faced strong resistance, leading to a reversal and a potential shift in control from bears to bulls. This pattern indicates that buyers have gained momentum, stepping in to drive prices higher

    Psychological Aspect
    The rationalization lies in understanding market psychology. During a downtrend, sellers dominate, pushing the prices lower. However, when a Bullish Pin Bar forms, it reflects a struggle between sellers and buyers, with buyers ultimately gaining control. Traders who missed the initial downtrend may see this pattern as an opportunity to enter the market, anticipating a reversal and potential upward movement. The Bullish Pin Bar is a visual representation of the tug-of-war between bulls and bears, providing valuable insights into potential trend changes


    Market Sentiment
    The Bullish Pin Bar suggests a rejection of lower prices. The long lower shadow signifies that sellers attempted to push the price lower but faced strong resistance, leading to a reversal and a potential shift in control from bears to bulls. This pattern indicates that buyers have gained momentum, stepping in to drive prices higher


    Click image for larger version  Name:	images (6) (13).png Views:	0 Size:	7.7 کلوبائٹ ID:	12820230
  • <a href="https://www.instaforex.org/ru/?x=ruforum">InstaForex</a>
  • #2 Collapse

    The Bullish Pin Bar is a notable candlestick pattern in technical analysis, often signaling potential reversals or shifts in market sentiment. Here's an overview

    Definition
    The Bullish Pin Bar, also known as a hammer, is characterized by a single candle with a small body, a long lower shadow, and little to no upper shadow. The small body is usually positioned at the top of the candle, and the long lower shadow extends below the body, forming a pin-like appearance. This pattern typically emerges after a downtrend

    Market Sentiment
    The Bullish Pin Bar signifies a rejection of lower prices. The extended lower shadow indicates that sellers attempted to drive the price lower but encountered significant resistance, leading to a reversal and a potential change in control from bears to bulls. This pattern suggests that buyers have gained momentum, stepping in to push prices higher

    Psychological Aspect
    The rationalization lies in understanding market psychology. In the context of a downtrend, sellers are dominating and pushing prices lower. However, the formation of a Bullish Pin Bar reflects a struggle between sellers and buyers, with buyers ultimately gaining control. Traders who may have missed the initial downtrend could interpret this pattern as an opportunity to enter the market, anticipating a reversal and potential upward movement. The Bullish Pin Bar visually represents the dynamic between bulls and bears, providing valuable insights into potential changes in the trend


    In summary, the rationalization of the Pin Bar pattern is rooted in identifying key moments of rejection in the market, understanding the battle between bulls and bears, and using this information to anticipate potential trend reversals


    Click image for larger version

Name:	images (6) (14).png
Views:	47
Size:	12.6 کلوبائٹ
ID:	12820234
    The heart has reasons that reason does not understand."
    • #3 Collapse

      Assalamu Alaikum Dosto!

      Pinbar Candlestick


      Pinbar candlestick, price charts mein ek specific price pattern hai jo traders ke liye important hota hai. Ye pattern price action analysis mein istemal hota hai aur price reversals aur market direction ke signals provide karta hai. Pinbar Candlestick ki shape ek "pin" ya "hammer" jaisi hoti hai, jisme ek lamba tail (ya shadow) hota hai, aur uski body tail se opposite direction mein hoti hai. Ye tail upper ya lower side par ho sakta hai, isliye Pinbar ko Bullish Pinbar aur Bearish Pinbar mein classify kiya jata hai. Pinbar ka location market context mein important hai. Agar pinbar kisi strong support ya resistance level ke paas form ho, toh uska significance badh jata hai.

      Click image for larger version

Name:	images - 2024-02-02T102628.780.png
Views:	43
Size:	11.1 کلوبائٹ
ID:	12820238

      Bullish & Bearish Pinbar Candlestick


      Bullish Pinbar Candlestick, price reversal ka signal deta hai aur downward trend se upward trend ke direction mein indicate karta hai. Iski shape aisi hoti hai ki uska tail neeche ki taraf extend hota hai aur body upar ki taraf hoti hai. Bullish Pinbar usually support level ya trendline ke pass form hota hai aur price ko reversal point par represent karta hai. Jab market mein Bullish Pinbar form hota hai, traders isko ek buy signal consider karte hain, aur uptrend ki starting point ka expectation rakhte hain. Yeh bullish momentum ka indication hai aur traders ko ye dikhata hai ki market ka trend change ho sakta hai aur uptrend shuru hone wala hai.
      Bearish Pinbar Candlestick, price reversal ka signal deta hai aur upward trend se downward trend ke direction mein indicate karta hai. Iski shape aisi hoti hai ki uska tail upar ki taraf extend hota hai aur body neeche ki taraf hoti hai. Bearish Pinbar usually resistance level ya trendline ke pass form hota hai aur price ko reversal point par represent karta hai. Jab market mein Bearish Pinbar form hota hai, traders isko ek sell signal consider karte hain, aur downtrend ki starting point ka expectation rakhte hain. Yeh bearish momentum ka indication hai aur traders ko ye dikhata hai ki market ka trend change ho sakta hai aur downtrend shuru hone wala hai.

      Pinbar Candlestick Explaination

      Pin Bar candlestick pattern aik Japanese candlestick hai jo ek taraf lambi wick aur chhota sa body rakhta hai. Ye aik taqatwar price action setup hai jo potential trend reversals ya continuations ko pehchanne mein istemal kiya ja sakta hai. Pin bar ki key khasoosiyat hain:
      • Long Wick: Pin bar ki ek taraf lambi wick hoti hai, jo market mein taqatwar buying ya selling pressure ko darust karta hai.
      • Small Real Body: Pin bar ki body overall pattern ke muqablay mein relatively chhoti hoti hai.
      • Reversal ya Continuation: Pin bars ko context ke mutabiq istemal karke dono, trend reversals aur continuations ko pehchana ja sakta hai.


      Pin bar ko trading mein istemal karne ke liye, traders ko ye chezein dekhni chahiye:
      • Formation at Key Support ya Resistance Levels: Pin bars sab se zyada effective hote hain jab woh key support ya resistance levels par bante hain.
      • Confirmation with Other Technical Indicators: Pin bars ko dusre technical indicators ke saath istemal karke signal ki taqat ko tasdeeq karna chahiye.
      • Trading Strategy: Traders ko pin bar signal par trade karnay se pehle clear trading strategy rakhni chahiye.


      Ye bhi zaroori hai ke yaad kiya jaye ke sabhi pin bars barabar nahi hote, aur kuch zyada bharosa mand ho sakte hain. Traders ko ye bhi maloom hona chahiye ke pin bars hamesha durust nahi hote aur inko informed trading decisions banane ke liye doosre forms of analysis ke saath istemal karna chahiye.


      Trading


      Pinbar Candlestick par trading karne ke liye, traders ko kuch important points ko dhyan mein rakhna chahiye. Pehle, Pinbar ka confirmation wait karna zaroori hai. Agar Pinbar ke baad confirming price action signals bhi dikhte hain, jaise ki support ya resistance level breaks, ya phir price mein strong momentum dikhta hai, tabhi trade entry karna chahiye. Dusre, stop-loss order lagana zaroori hai. Stop-loss order trade entry ke neeche lagaya jata hai, taaki agar trade against direction move karta hai, toh nuksaan kam ho sake. Stop-loss level ko Pinbar ki high ya low ke just opposite side par place kiya jata hai. Teesre, take-profit order ka use karna zaroori hai. Take-profit level trade entry ke upar lagaya jata hai, taaki jab price expected direction mein move karta hai, toh profit maximized ho sake. Pinbar Candlestick trading mein risk management bhi mahatvapurna hota hai. Position size ko determine karte samay, risk ko manage karne ke liye account balance aur stop-loss level ko consider karna chahiye.


      • #4 Collapse

        What is bullish pin bar candlestick pattern
        Bullish Pin Bar" ek technical analysis term hai jo keemati papers ki tajwezat mein istemal hoti hai, khaas kar candlestick charts ke hawale se. Is term ko samajhne ke liye, iske do hisson mein tajziya karna hoga:
        1. Bullish: Ye lafz ek musbat ya umeedi rujhan ko dikhata hai. Keemati papers ki soorat mein, bullish pattern wuzoo karte hain ke keemat barhne ki tawakul hai.
        2. Pin Bar: Pin bar ek khaas qisam ka candlestick pattern hai jo teen ahem features se mutanaffir hota hai:
          • Ek lambi shadow (wick) jo ek taraf candlestick mein hoti hai.
          • Aas paas ki taraf chhota sa body, jo lambi shadow ke mukhalif taraf hoti hai.
          • Body amuman candlestick ke open ya close ke qareeb hoti hai.

        Bullish pin bar ke mamle mein:
        • Lambi shadow aksar candlestick ke neeche hoti hai.
        • Chhota sa body candlestick ke ooper hoti hai.

        Bullish pin bar ki ahmiyat is mein hai ke isse current downtrend ki mukhalfat ya mojooda uptrend ki jarrarat ka izhar hota hai. Traders ise aisa samajhte hain ke yeh ek ishara hai ke bearish logon ki hukumat ke baad ab bullish logon ka dabdaba ho raha hai.

        Yahan ek bullish pin bar ki mukhtasar tabeer hai:
        • Lambi lower shadow yeh ishara karta hai ke bechne wale ne keemat ko session ke doran kafi nicha daba diya.
        • Chhota sa body jo ke candlestick ki unchai par hoti hai, yeh dikhata hai ke khareedne walon ne dobara qabu hasil kiya aur keemat ko upar le gaye.
        • Yeh pattern kaule mein tabdeeli ka ishara karta hai, bearish se bullish sentiment ki taraf jane ka.

        Yeh yaad rakhna zaroori hai ke candlestick patterns ko technical analysis mein madadgar samjha jaa sakta hai, lekin inko tanha mein istemal nahi karna chahiye. Traders aksar inhe doosre indicators aur tajziya techniques ke saath milakar istemal karte hain taake unki faislay mein ziada malumat hasil ho sake. Iske alawa, market ki halaat aur maahol bhi kisi bhi candlestick pattern ki tabeer mein ahem kirdar ada karte hain.


        • #5 Collapse

          Bullish Pin Bar Candlestick Pattern,rationalization.
          Click image for larger version

Name:	download - 2024-02-01T231419.892.png
Views:	30
Size:	4.8 کلوبائٹ
ID:	12820278
          Bullish Pin Bar Candlestick Pattern: Tehqiqati Tajaweez aur Tafseeli Tanazur

          Candlestick charts, jo ke technical analysis ka aik ahem hissa hain, market trends aur price movements ko samajhne mein madadgar hoti hain. In charts mein mukhtalif candlestick patterns paye jate hain jo traders ko market ki future movements ke baray mein malumat farahem karte hain. Aik aham aur common candlestick pattern jo traders ki tawajju ko apni taraf khenchta hai, woh hai "Bullish Pin Bar."

          Bullish Pin Bar, ya phir bas "Pin Bar," ek candlestick pattern hai jo market mein bullish reversal ko indicate karta hai. Is pattern ki pehchan karne ke liye, humein candlestick ki structure aur uske elements ko samajhna zaroori hai.

          Har Bullish Pin Bar candlestick ek chhota sa body ke saath aata hai, jo ke upper ya lower shadow (ya dono) ke sath hoti hai. Upper aur lower shadows, ya wicks, price ke high aur low levels ko darust karti hain. Bullish Pin Bar ka matlab hota hai ke market mein sellers initially control mein hote hain lekin phir se buyers ne control hasil kiya hai.

          Bullish Pin Bar ki pehchan ke liye kuch key features hain:
          1. Chhota Body: Bullish Pin Bar ka body chhota hota hai, jo ke indicate karta hai ke opening aur closing prices kafi qareeb hote hain.
          2. Long Lower Wick: Bullish Pin Bar ke neeche lambi wick hoti hai jo ke darust price ke low level ko darust karti hai. Yeh lower wick market mein initial selling pressure ko darust karta hai.
          3. Short Upper Wick: Upper wick chhota hota hai aur ideally body se ziada extend nahi hota, jo ke dikhata hai ke buyers ne control hasil kiya hai aur price ko upper side pe le gaye hain.

          Bullish Pin Bar ka ye pattern market mein buyers ki comeback ko darust karta hai aur traders ko ye signal milta hai ke ab market mein bullish trend start hone wala hai.

          Rationalization (Tajaweez):

          Bullish Pin Bar candlestick pattern ka istemal karke traders ko market mein hone wale changes ka andaza lagane mein madad milti hai. Is pattern ki tajaweez (rationalization) ke liye kuch important points hain:
          1. Reversal Signal: Bullish Pin Bar, market mein bearish trend se bullish trend ki taraf hone wale reversals ko indicate karta hai. Iska matlub hai ke agar market pehle downward ja raha tha to ab woh upward ja sakta hai.
          2. Market Sentiment Change: Bullish Pin Bar ki appearance se market sentiment ka change pata chalta hai. Jab yeh pattern market mein dikhayi deta hai, to ye signal hota hai ke ab buyers control mein hain aur price mein izafa hone wala hai.
          3. Support and Resistance Confirmation: Bullish Pin Bar ek sath hi support aur resistance levels ko confirm karne mein bhi madad karta hai. Agar yeh pattern kisi specific support level ke qareeb dikhayi deta hai to ye confirm karta hai ke woh level strong hai aur prices uss direction mein badh sakti hain.
          4. Risk Management: Bullish Pin Bar ka istemal karke traders apne trades ko manage kar sakte hain. Agar kisi ne is pattern ko identify kiya to woh apni entry aur exit points ko better taur par plan kar sakta hai.
          5. Confirmation with Other Indicators: Bullish Pin Bar ko dusre technical indicators ke sath combine karke aur confirm karke traders apne decisions ko aur bhi strong bana sakte hain. Is tarah se, ye pattern ek comprehensive trading strategy ka hissa ban sakta hai.

          Conclusion (Ikhtitam):

          Bullish Pin Bar candlestick pattern, jab sahi taur par samjha jata hai aur saath mein dusre technical tools ke sath istemal hota hai, to ye traders ko market movements ke baray mein behtareen malumat farahem karta hai. Is pattern ki tajaweez se traders market ke future trends ko predict kar sakte hain aur apne trades ko improve karne mein madad le sakte hain.

          Yaad rahe ke har ek trading strategy ki tarah, Bullish Pin Bar pattern ka bhi istemal soch samajh kar aur sahi waqt par karna zaroori hai. Market mein hone wale changes ko theek se samajhne ke liye, traders ko constant learning aur market analysis par tawajju deni chahiye. Bullish Pin Bar ke sath milake, ye ek powerful tool ban sakta hai jo traders ko market ke complexities se niptne mein madad karta hai.


          • #6 Collapse

            **Bullish Pin Bar Candlestick Pattern: Rationalization**
            Forex aur stock trading mein candlestick patterns ka analysis ek important technique hai jo market ke future movements ko predict karne mein madad karta hai. Unmein se ek popular pattern "Bullish Pin Bar" hai. Is pattern ko samajhne aur effectively use karne ke liye, zaroori hai ke hum iski rationalization ko samjhein.

            Bullish Pin Bar candlestick pattern ek strong reversal signal provide karta hai. Yeh pattern market ke bearish trend ke end par emerge hota hai aur bullish trend ke shuru hone ki ummeed ko darshata hai. Is pattern ka form ek single candlestick ke zariye hota hai, jo ke ek distinct shape aur characteristics ke sath identify kiya jata hai.

            **Pattern Ki Characteristics:**

            1. **Long Lower Shadow**: Bullish Pin Bar ka sabse prominent feature iska long lower shadow hai. Yeh shadow market ke bearish pressure ko reflect karta hai jo ke low price se bounce back karta hai aur closing price ko higher level par le aata hai.

            2. **Small Body**: Is pattern mein candlestick ka body chhota hota hai. Yeh indicate karta hai ke opening aur closing prices ke darmiyan zyada difference nahi hai. Chhoti body market ke indecision aur consolidation ko reflect karti hai.

            3. **Little or No Upper Shadow**: Bullish Pin Bar ke upper shadow ya to bilkul nahi hota ya bahut chhota hota hai. Iska matlab hai ke price ne upward movement achieve kiya hai aur sellers ki side se resistance minimal tha.

            **Rationalization:**

            Bullish Pin Bar pattern tab form hota hai jab market ke bearish trend ke dauran sellers market ko niche push karte hain, lekin ek significant bullish momentum ke zariye price wapas higher level par aa jati hai. Yeh pattern market ke reversal ki indication hoti hai. Jab price bullish pin bar pattern ko form karti hai, to yeh sellers ki failure ko indicate karti hai aur buyers ke dominance ko reflect karti hai.

            Traders is pattern ko identify karke apne trading strategies ko adjust kar sakte hain. Jab Bullish Pin Bar ka confirmation milta hai, traders aksar apne buy positions ko open karte hain aur apni exit points ko previous resistance levels par set karte hain. Is pattern ka analysis market ki potential reversal aur trend changes ko samajhne mein madad karta hai aur trading decisions ko zyada informed aur strategic banata hai.

            In conclusion, Bullish Pin Bar candlestick pattern ek powerful tool hai jo market ke reversal signals ko identify karne mein madad karta hai aur effective trading strategies ko implement karne mein assist karta hai.
            • #7 Collapse

              Bullish Pin Bar Candlestick Pattern in Forex Trading

              1. Ta'aruf (Introduction)

              Bullish Pin Bar ek ahem candlestick pattern hai jo forex trading mein trend reversal ka signal deta hai. Forex market mein, jahan price movement aur trends bahut tezi se badalte hain, traders ko accurate signals ki zaroorat hoti hai. Bullish Pin Bar pattern ek aisa tool hai jo traders ko market ke future direction ka andaza lagane mein madad karta hai. Is pattern ko samajhkar aur iske signals ko sahi tarike se interpret karke, traders market mein profitable trades execute kar sakte hain.


              2. Pin Bar Ka Matlab (Meaning of Pin Bar)

              Pin Bar ek aise candlestick pattern ko refer karta hai jismein lambi tail aur chhoti body hoti hai. Ye pattern market ki rejection ko darshata hai. Bullish Pin Bar ek specific type hai jahan body lower end par hoti hai aur lambi tail lower side se nikalti hai. Iska matlab hai ke market ne lower levels par trade kiya, lekin akhirat mein price upar aa gayi. Ye pattern traders ko batata hai ke market ke low points par buying pressure strong hai aur price ke badhne ke chances hain.


              3. Pattern Ki Pehchaan (Identifying the Pattern)

              Bullish Pin Bar ko pehchaan ne ke liye kuch key characteristics par dhyan dena padta hai. Ye characteristics hain:
              • Chhoti Body: Bullish Pin Bar ki body chhoti hoti hai aur ye price range ke lower end par hoti hai.
              • Lambi Tail: Tail (shadow) body se lambi hoti hai aur ye tail market ke low points se nikalti hai.
              • Closing Price: Bullish Pin Bar mein closing price body ke upper end ke qareeb hoti hai, jo ke buying pressure ko darshata hai.

              Agar ye characteristics dekhe jayein to pattern ko identify karna asaan hota hai, lekin market context ko bhi samajhna zaroori hai.


              4. Pattern Ka Banaawt (Structure of the Pattern)

              Bullish Pin Bar pattern ka structure clear aur defined hota hai. Pattern ke basic structure ko samajhne ke liye ye points dekhe jate hain:
              • Body: Body chhoti hoti hai aur usually red ya green color mein hoti hai. Body ka rang price movement ke direction ko darshata hai.
              • Upper Shadow: Upper shadow (agar ho) chhoti hoti hai aur usually pattern ke signal ko affect nahi karti.
              • Lower Shadow: Lower shadow lambi hoti hai aur ye market ke low ko test karne ke baad price ke upar aane ko darshati hai.

              Pattern ke structure ko samajhna traders ko is pattern ke signals ko interpret karne mein madad karta hai.


              5. Rationalization (Wajeh Karna)

              Pin Bar pattern ka rationalization samajhna important hai, jisse traders ko market ke behavior ko better samajhne mein madad milti hai. Jab ek Pin Bar banata hai, to ye darshata hai ke market ne lower levels ko test kiya, lekin buyers ne price ko wapas upar le aaya. Iska matlab hai ke market mein strong buying pressure hai jo ke trend reversal ke signals ko darshata hai. Ye pattern market ke sentiment ko bhi darshata hai, jo traders ko trade decision mein madad karta hai.


              6. Market Ka Context (Market Context)

              Pin Bar pattern ka signal tabhi zyada powerful hota hai jab ye specific market context mein bane. Kuch important contexts hain:
              • Support Levels: Agar Pin Bar pattern support level ke qareeb bane, to ye ek strong signal hota hai ke market wahan se bounce kar sakta hai.
              • Trend Lines: Trend lines ke qareeb bane hue Pin Bar bhi significant hota hai, kyunki ye trend reversal ke signal ko darshata hai.
              • Previous Lows: Agar Pin Bar previous lows ke qareeb bane, to ye market ke low points ko test karne ka signal hota hai.

              Market context ko samajhna traders ko pattern ke reliability ko evaluate karne mein madad karta hai.


              7. Signal Ka Andaza (Interpreting the Signal)

              Bullish Pin Bar ka signal interpret karne ke liye traders ko kuch key factors par dhyan dena chahiye:
              • Support Level: Pattern agar support level ke qareeb bane, to ye signal zyada strong hota hai.
              • Volume: Higher volume ke sath Pin Bar ka signal zyada credible hota hai, kyunki ye market mein strong buying pressure ko darshata hai.
              • Previous Trend: Agar Pin Bar ek downtrend ke baad bane, to ye reversal ke signal ko darshata hai.

              Signal ko interpret karne ke liye in factors ko consider karna zaroori hai.


              8. Confirmatory Signals (Tasdeeqi Nishaan)

              Pin Bar pattern ke signal ko tasdeeq karne ke liye, traders ko dusre technical indicators ka bhi istemal karna chahiye:
              • Moving Averages: Moving averages ka cross over bhi trend reversal ke signal ko confirm kar sakta hai.
              • RSI (Relative Strength Index): RSI oversold conditions ko darshata hai jo ke Pin Bar ke signal ko confirm kar sakta hai.
              • MACD (Moving Average Convergence Divergence): MACD histogram ke changes bhi Pin Bar pattern ke signal ko confirm karte hain.

              Confirmatory signals ka istemal traders ko false signals se bachne mein madad karta hai.


              9. Stop Loss Ka Istemal (Using Stop Loss)

              Trade karte waqt stop loss ka istemal zaroori hai taake potential losses ko limit kiya ja sake. Bullish Pin Bar ke case mein, stop loss ko pattern ke low ke neeche set kiya jata hai:
              • Stop Loss Placement: Bullish Pin Bar ke low ke neeche stop loss set karke, traders apni position ko protect kar sakte hain.
              • Risk Management: Stop loss placement se risk management ko control kiya jata hai, jo ke profitable trading ke liye essential hai.

              Stop loss ka istemal risk ko manage karne mein madad karta hai aur unnecessary losses se bachne mein help karta hai.


              10. Profit Target Ka Tayeun (Setting Profit Targets)

              Profit targets set karne ke liye traders ko kuch key strategies ka istemal karna chahiye:
              • Previous Resistance Levels: Previous resistance levels ko target karke profit targets set kiye jate hain.
              • Fibonacci Retracement Levels: Fibonacci retracement levels bhi potential profit targets ko determine karne mein madad karte hain.
              • Risk-Reward Ratio: Risk-reward ratio ko consider karte hue profit targets set karna chahiye taake trade ka risk aur reward balance ho.

              Profit targets ko set karne ke liye market conditions aur pattern ki characteristics ko dhyan mein rakhna zaroori hai.


              11. Timeframe Ka Chayan (Choosing the Timeframe)

              Pin Bar pattern har timeframe par ban sakta hai, lekin alag-alag timeframes ki reliability alag hoti hai:
              • Longer Timeframes: Daily aur weekly timeframes par Pin Bar pattern ki reliability zyada hoti hai aur ye accurate signals provide karta hai.
              • Shorter Timeframes: Intraday charts par Pin Bar pattern zyada noise aur false signals produce kar sakta hai.

              Appropriate timeframe ko choose karke, traders accurate aur reliable trading signals ko identify kar sakte hain.


              12. Risk Management (Risk Management)

              Effective risk management trading ke success ke liye zaroori hai:
              • Position Sizing: Position size ko manage karna zaroori hai taake risk ko control kiya ja sake.
              • Stop Loss Placement: Stop loss placement risk management ka important part hai aur trade ki safety ko ensure karta hai.
              • Risk-Reward Ratio: Risk-reward ratio ko balance karna zaroori hai taake potential profits aur losses ka optimal balance ho.

              Risk management strategies ko implement karke, traders apne trading capital ko protect kar sakte hain.


              13. Backtesting (Backtesting)

              Pin Bar pattern ke signals ko backtest karna zaroori hai:
              • Historical Data: Historical data ke zariye Pin Bar pattern ki effectiveness ko test kiya jata hai.
              • Strategy Validation: Backtesting se trading strategy ki validity ko validate kiya jata hai aur past performance ka analysis kiya jata hai.
              • Pattern Effectiveness: Pin Bar pattern ki effectiveness ko different market conditions ke under test kiya jata hai.

              Backtesting se traders ko pattern ke results aur accuracy ka pata chalta hai, jo trading decisions ko improve karta hai.


              14. Common Mistakes (Aam Ghaltiyan)

              Pin Bar pattern ke interpretation mein kuch aam ghaltiyan hoti hain:
              • Ignoring Market Context: Market context ko ignore karke pattern ko galat interpret kiya ja sakta hai.
              • Over-reliance on Pin Bar: Sirf Pin Bar pattern par over-rely karna aur dusre indicators ko ignore karna bhi ek aam mistake hai.
              • False Breakouts: False breakouts ke signal ko ignore karke wrong trades execute kiye ja sakte hain.

              In common mistakes ko avoid karke, traders pattern ki accuracy ko improve kar sakte hain.


              15. Combining With Other Patterns (Dusre Patterns Ke Sath Milana)

              Pin Bar pattern ko dusre candlestick patterns ke sath combine karke trading strategy ko enhance kiya ja sakta hai:
              • Engulfing Patterns: Engulfing patterns ke sath Pin Bar ko combine karke stronger signals generate kiye ja sakte hain.
              • Doji Patterns: Doji patterns bhi Pin Bar ke sath combine karke trend reversal ke signals ko confirm kar sakte hain.
              • Hammer Patterns: Hammer patterns ke sath Pin Bar ko combine karke accurate trading signals ko identify kiya ja sakta hai.

              Dusre patterns ke sath combination se trading strategy ko strengthen kiya ja sakta hai.


              16. Psychological Aspects (Nafsiyati Pehlu)

              Trading ke dauran psychological aspects ko bhi consider karna zaroori hai:
              • Emotional Control: Pin Bar pattern ko dekhte waqt emotional control maintain karna zaroori hai.
              • Overreacting: Market ke movement par overreact karna aur impulsive decisions lena ghalat trading behavior ko darshata hai.
              • Discipline: Trading strategy ko follow karna aur discipline maintain karna trading success ke liye essential hai.

              Psychological aspects ko samajhkar, traders apne trading performance ko improve kar sakte hain.


              17. Practical Application (Amal Mein Lana)

              Pin Bar pattern ko trading strategy mein effectively implement karne ke liye:
              • Market Analysis: Market analysis aur pattern ke characteristics ko samajhna zaroori hai.
              • Trade Execution: Pattern ke signals ko trade execution mein implement karna chahiye.
              • Ongoing Monitoring: Trade execute karne ke baad ongoing monitoring aur adjustments zaroori hain.

              Practical application se traders ko market mein successful trades execute karne mein madad milti hai.


              18. Case Studies (Misaal)

              Bullish Pin Bar pattern ke case studies se traders ko real market scenarios ka analysis milta hai:
              • Historical Examples: Historical examples aur case studies se pattern ke outcomes aur effectiveness ko samjha ja sakta hai.
              • Real-world Scenarios: Real-world scenarios ke analysis se traders ko pattern ke practical implications ka pata chalta hai.
              • Success Stories: Successful trades aur trading strategies ke examples bhi case studies ka hissa hote hain.

              Case studies se traders ko pattern ki practical understanding aur implementation ke insights milte hain.


              19. Nishkarsh (Conclusion)

              Bullish Pin Bar candlestick pattern forex trading mein ek valuable tool hai. Is pattern ko samajhkar aur sahi tarike se implement karke, traders market reversal ke signals ko effectively interpret kar sakte hain. Pattern ke signals ko confirmatory indicators ke sath combine karke aur risk management strategies ko apply karke, traders profitable trades execute kar sakte hain. Overall, Bullish Pin Bar pattern ek useful tool hai jo forex trading mein accurate trading decisions ko facilitate karta hai.
              • #8 Collapse

                Bullish Pin Bar Candlestick Pattern ke baare mein bata sakta hoon.

                Bullish Pin Bar ek candlestick pattern hai jo technical analysis mein use hota hai aur market reversal ya trend change ki indication deta hai. Is pattern ke features hain:

                Click image for larger version

Name:	images (87).png
Views:	10
Size:	15.0 کلوبائٹ
ID:	13075803

                Long Lower Wick: Pin bar ka sabse prominent feature ek lamba lower wick hai, jo signal deta hai ki market ne niche girne ki koshish ki lekin buyers ne price ko wapas upar le aaya.

                Small Body: Body chhoti hoti hai aur iske close aur open price ke beech ka gap bhi chhota hota hai.

                Upper Wick: Upper wick bahut chhoti hoti hai ya phir nahi hoti.


                Rationalization:

                Reversal Signal: Bullish Pin Bar ke formation se signal milta hai ki bearish trend shayad khatam hone wala hai aur bullish trend start ho sakta hai.

                Support Level: Yeh pattern aam taur par support level ya strong buying zone ke paas banta hai.

                Market Sentiment: Yeh pattern market sentiment ko dikhata hai jahan sellers ne price ko neeche le jaane ki koshish ki, lekin buyers ne market ko wapas upar ki taraf push kiya.

                Agar aap technical analysis mein naye hain, toh yeh pattern samajhna aur pehchanna thoda practice se aayega.


                Formation Process:

                Bullish Pin Bar tab banta hai jab ek strong bearish move ke baad market ki price neeche jaati hai aur sellers ka dominance dikhayi deti hai. Lekin, buying pressure itna strong hota hai ki price ko upar ki taraf le aata hai aur pin bar ke upper portion mein chhoti body ke saath ek lamba lower wick banata hai.


                Characteristics:

                Long Lower Wick: Yeh wick market ke bearish pressure ko dikhata hai, jiska size bada hota hai, jo market ke strong support level ke paas hone ka indication hota hai.

                Small Body: Body chhoti hoti hai, jo yeh batata hai ki market ke open aur close prices ke beech mein zyada difference nahi hai, aur trend reversal ke liye ek sign hota hai.

                Little or No Upper Wick: Upper wick ka chhota hona ya naa hona, yeh signal deta hai ki buyers ne price ko upper level tak push kiya aur bearish movement ko counter kiya.


                Trading Context:

                Support Levels: Bullish Pin Bar jyadatar support levels par banta hai, jahan price ne lower wick ke through support ko test kiya aur phir recovery dikhaayi.

                Confirmation: Is pattern ki validity ko confirm karne ke liye traders aise pin bar ke baad ek positive confirmation candle dekhna pasand karte hain, jaise ki bullish engulfing candle ya higher close price candle.

                Risk Management:

                Entry Point: Entry typically pin bar ke high ke thoda upar hota hai, taaki trend reversal confirm ho sake.

                Stop Loss: Stop loss ko lower wick ke neeche rakha jata hai, taki agar market pattern ke against move kare, to loss control mein rahe.


                Limitations:

                False Signals: Kabhi-kabhi yeh pattern false signals bhi de sakta hai, especially jab market choppy ya unpredictable ho. Isliye, pattern ke confirmation ke baad hi trade mein enter karna behtar hota hai.

                Yeh pattern trading decisions mein madadgar ho sakta hai, lekin hamesha risk management aur additional technical analysis tools ka use karna zaroori hai.

                • #9 Collapse

                  Bullish Pin Bar Candlestick Pattern: Rationalization

                  Bullish Pin Bar Pattern Ka Taaruf


                  Bullish Pin Bar ek candlestick pattern hai jo trading charts par bullish reversal ko darshata hai. Ye pattern aksar downtrend ke baad form hota hai aur is ka main indicator ek single candlestick hoti hai jo market ke turnaround ki nishani hoti hai. Is pattern ka asar tab hota hai jab ek candlestick ke body ka size chhota hota hai, lekin iska wick ya shadow lamba hota hai. Is se pata chalta hai ke sellers ne price ko neeche dhakelne ki koshish ki, lekin buyers ne unki koshish ko fail kar diya aur price ko wapas upar le aaye.
                  Pattern Ki Pehchan


                  Bullish Pin Bar ko pehchanne ke liye aapko kuch specific features dekhne hote hain:
                  1. Chhoti Body: Candlestick ki body chhoti hoti hai, jo ke price movement ka kam hissa darshati hai.
                  2. Lamba Lower Wick: Lower wick ya shadow zyada lamba hota hai, jo ke yeh darshata hai ke sellers ne price ko neeche dhakelne ki koshish ki thi.
                  3. Chhota Upper Wick: Upper wick ya shadow chhota hota hai ya kuch cases mein na ke barabar hota hai.

                  Ye combination bullish reversal ki indication deta hai kyunke market ne lower prices ko reject kar diya aur price ko wapas upar le aaye.
                  Pattern Ka Rationalization


                  Bullish Pin Bar ka rationalization market ke psychology aur price action ko samajhne mein hai. Jab ek market downtrend mein hoti hai aur ek bullish pin bar form hoti hai, to iska matlab hai ke sellers ne market ko aur neeche girane ki koshish ki thi, lekin buyers ne market ko wapas upar le aaye. Yeh pattern market mein ek reversal ki nishani hoti hai jahan market ke participants ne sellers ke control ko challenge kiya hai.
                  Trading Strategy


                  Bullish Pin Bar ka trading strategy mein use karna ek aam practice hai:
                  1. Confirmation: Bullish Pin Bar ke confirmation ke liye aapko iske baad ki candlestick ki movement dekhni chahiye. Agar uske baad market upar ki taraf move kar rahi hai to aap is pattern ko bullish signal samajh sakte hain.
                  2. Support Levels: Aksar Bullish Pin Bar support levels par form hoti hai. Isliye, agar aapko support levels par yeh pattern nazar aaye to iski credibility zyada hoti hai.
                  3. Risk Management: Har trading strategy ki tarah, risk management bhi zaroori hai. Bullish Pin Bar ke signal par trade karte waqt aapko apne stop-loss aur target levels ko define karna chahiye taake kisi bhi unexpected market movement ka asar kam se kam ho.
                  Conclusion


                  Bullish Pin Bar candlestick pattern trading mein ek important tool hai jo market ke reversal points ko identify karne mein madad karta hai. Is pattern ka sahi se analysis aur confirmation ke sath trading karne se aap market ke trends ko better samajh sakte hain aur apne trading decisions ko improve kar sakte hain. Har pattern ki tarah, Bullish Pin Bar ko bhi context aur additional technical indicators ke sath evaluate karna chahiye taake zyada accurate trading decisions liye ja sakein.
                  • #10 Collapse

                    **Bullish Pin Bar Candlestick Pattern: Tafseeli Jaiza**

                    Forex aur stock trading mein, candlestick patterns ki bohot ahmiyat hoti hai. Un patterns mein se aik mashhoor pattern "Bullish Pin Bar" hai. Yeh pattern traders ko market ki possible direction aur reversal points ko pehchan-ne mein madad deta hai. Is article mein hum Bullish Pin Bar Candlestick Pattern ki tafseel aur uski rationalization ka jaiza lenge.

                    ### Bullish Pin Bar Kya Hai?

                    Bullish Pin Bar aik aisa candlestick pattern hai jo market mein price reversal ki nishandahi karta hai. Iska structure kuch aise hota hai ke iski body choti hoti hai aur ek taraf lambi shadow ya wick hoti hai. Yeh pattern tab banta hai jab sellers market ko neechay le jaane ki koshish karte hain lekin buyers market mein dubara control haasil kar lete hain aur price ko upar ki taraf push karte hain.

                    ### Pattern Ki Pehchan

                    - **Body:** Bullish Pin Bar ki body choti hoti hai, jo is baat ki taraf ishara karti hai ke price opening aur closing ke beech bohot zyada farq nahi hai.
                    - **Wick:** Is pattern ki sabse ahm khubi iski lambi lower wick hai. Yeh wick is baat ki taraf ishara karti hai ke price ne temporary tor pe niche jaane ki koshish ki thi lekin phir buyers ke control mein aa gayi.
                    - **Location:** Yeh pattern aksar support level ke qareeb ya phir downtrend ke end par banta hai, jo market mein possible reversal ki nishandahi karta hai.

                    ### Rationalization of Bullish Pin Bar

                    1. **Market Sentiment:** Bullish Pin Bar traders ko yeh batata hai ke market mein sellers ke baawajood buyers ne price ko upar push kar diya hai. Iska matlab yeh hai ke market ka sentiment bullish ho raha hai aur price increase ki taraf ja sakta hai.

                    2. **Support Level:** Agar yeh pattern support level ke paas banta hai, toh is baat ka strong indication hota hai ke support level mazboot hai aur buyers is level par enter ho rahe hain.

                    3. **Trend Reversal:** Downtrend mein Bullish Pin Bar pattern ka ban'na is baat ka nishan hai ke trend reversal ho sakta hai. Yeh pattern traders ko yeh signal deta hai ke woh short position ko cover karein aur long position ke liye tayyar ho jaayein.

                    4. **Confirmation:** Yeh pattern tab zyada effective hota hai jab iske baad ek strong bullish candle banti hai jo confirmation provide karti hai ke price trend change hone ke liye tayyar hai.

                    ### Istemaal aur Trading Strategy

                    Bullish Pin Bar ko identify karne ke baad, traders aksar support levels, Fibonacci retracement aur moving averages ko dekh kar further confirmation lete hain. Is pattern ko trade karte waqt stop loss ko pattern ki low shadow ke neeche set karna chahiye, aur target price ko resistance levels ke paas rakhna chahiye.

                    ### Conclusion

                    Bullish Pin Bar aik valuable candlestick pattern hai jo traders ko market mein entry aur exit points identify karne mein madad deta hai. Agar sahi tareeke se is pattern ko analyze aur utilize kiya jaye, toh yeh trading success ke liye ek powerful tool sabit ho sakta hai. Har trader ko chahiye ke woh is pattern ko apne trading plan mein shamil karein aur market dynamics ko samajhne ki koshish karein.
                    • #11 Collapse

                      **Bullish Pin Bar Candlestick Pattern: Rationalization**
                      1. **Definition:**
                      - **Bullish Pin Bar:** Candlestick pattern hai jo trend reversal ya price direction change ka signal deta hai. Yeh pattern typically ek long lower shadow aur choti body ke sath banata hai, jiska upper shadow chhota ya absent hota hai.

                      2. **Components:**
                      - **Long Lower Shadow:** Yeh shadow indicate karta hai ke market ne niche ke direction mein momentum kiya, lekin close hone tak price ne recover kiya.
                      - **Small Body:** Body pattern ka center hota hai aur price open aur close ke beech ka difference dikhata hai. Body chhoti hoti hai, jo indecision ya market uncertainty ko reflect karti hai.
                      - **Minimal Upper Shadow:** Upper shadow ka minimal hona yeh batata hai ke market ne upar ki taraf zyada movement nahi dikhayi.

                      3. **Pattern Formation:**
                      - **Formation Phase:** Bullish Pin Bar typically downtrend ke baad form hota hai. Yeh pattern ek bearish candlestick ke baad appear hota hai, jo trend reversal ke potential ko signal karta hai.
                      - **Confirmation:** Pattern ki confirmation ke liye subsequent bullish candlestick dekhna zaroori hai. Yeh confirmation pattern ke validity ko strengthen karti hai aur potential trend reversal ko indicate karti hai.

                      4. **Rationalization:**
                      - **Reversal Signal:** Bullish Pin Bar market ke sentiment aur psychology ko reflect karta hai. Jab price ne long lower shadow banayi aur phir recover kiya, to yeh indicate karta hai ke sellers ke efforts fail hue aur buyers ka control badh gaya.
                      - **Price Action Analysis:** Pattern ko analyze karte waqt, price action aur market context ko consider karna zaroori hai. Pin Bar ka placement support level ya trendline ke near hona, pattern ki strength aur reliability ko enhance karta hai.

                      5. **Trading Strategy:**
                      - **Entry Points:** Bullish Pin Bar ke complete hone ke baad trade enter karein. Entry point pattern ke high ke upar set kiya jata hai, jisse confirmation ke baad position open ki jati hai.
                      - **Stop-Loss Orders:** Stop-loss ko Pin Bar ke low ke niche set karein. Yeh risk management tool hai jo adverse price movements se protection provide karta hai.
                      - **Take-Profit Levels:** Take-profit levels ko pattern ke target levels aur market conditions ke basis par set karein. Typically, target levels previous swing highs ya resistance levels par set kiye jate hain.

                      6. **Confirmation Indicators:**
                      - **Volume Analysis:** Volume analysis se pattern ki confirmation milti hai. High volume during pattern formation aur subsequent bullish movement pattern ke validity ko support karti hai.
                      - **Additional Indicators:** RSI ya MACD ko use karke pattern ki confirmation aur accuracy ko enhance karein. Yeh indicators trend strength aur momentum ko analyze karne mein madad karte hain.

                      7. **Limitations:**
                      - **False Signals:** Bullish Pin Bar kabhi-kabhi false signals generate kar sakta hai, especially during high volatility ya choppy markets. Pattern ke signals ko additional confirmation se validate karna zaroori hai.
                      - **Contextual Analysis:** Pattern ki effectiveness market context aur other technical factors par depend karti hai. Isliye, isolated Pin Bar pattern ko blindly follow karna risky ho sakta hai.

                      8. **Market Conditions:**
                      - **Trend Context:** Bullish Pin Bar trend reversal ya trend continuation ke context mein better perform karta hai. Market ke existing trend aur price action ko consider karna zaroori hai.
                      - **Economic Events:** Economic events aur news releases ko monitor karein, jo market sentiment aur price action ko impact kar sakte hain. Yeh events pattern ki validity aur effectiveness ko influence kar sakte hain.

                      9. **Backtesting:**
                      - **Historical Data:** Bullish Pin Bar pattern ko historical data par backtest karein. Yeh aapko pattern ki effectiveness aur performance ko assess karne mein madad karta hai.
                      - **Strategy Testing:** Real trading conditions aur market scenarios ke sath pattern ko test karna zaroori hai. Yeh practical insights aur strategy adjustments provide karta hai.

                      10. **Education and Learning:**
                      - **Educational Resources:** Candlestick patterns aur unke rationalization ke baare mein educational resources ko regularly study karein. Yeh knowledge ko enhance karne aur trading skills ko improve karne mein madad karti hai.
                      - **Continuous Improvement:** Trading techniques aur pattern recognition ke sath continuous learning zaroori hai. Market conditions aur trading strategies ke changes ke sath updated rahna chahiye.

                      Bullish Pin Bar Candlestick Pattern trend reversal aur price action analysis ke liye ek valuable tool hai. Accurate identification aur effective trading strategies ke sath is pattern ka optimal use kiya ja sakta hai.
                      • <a href="https://www.instaforex.org/ru/?x=ruforum">InstaForex</a>
                      • #12 Collapse

                        Bullish Pin Bar Candlestick Pattern: A Comprehensive Guide

                        1. Taaruf


                        Bullish Pin Bar Candlestick Pattern ek ahem trading signal hai jo ke market ke reversal ya bullish trend ki nishandihi karta hai. Ye pattern khas tor par short-term trading mein istemal hota hai aur iski pehchan karna traders ke liye faida mand ho sakta hai.
                        2. Pin Bar Ka Matlab


                        Pin Bar ka matlab hai aisi candlestick jo ek lambi tail ya wick rakhti hai aur choti body. Iski wajah se ye pattern market ki sentiment ko dikhata hai. Bullish Pin Bar mein, body ka rang aam tor par green ya white hota hai, jo bullish sentiment ko darshata hai.
                        3. Pattern Ki Pehchan


                        Bullish Pin Bar ko pehchanne ke liye, humein dekha chahiye ke candlestick ki body choti ho aur tail lambi ho. Agar tail body se do guna ya us se zyada lambi ho, to ye bullish signal hai. Is pattern ki wajah se market mein buying pressure ka izafa hota hai.
                        4. Market Context


                        Is pattern ka istemal tabhi kijiye jab aap market context ko samjhen. Ye zaroori hai ke aap ye dekhen ke kya market pehle se hi bearish hai ya kisi support level par hai. Ye pattern tab zyada effective hota hai jab market kisi major support level ke qareeb ho.
                        5. Volume Ki Ahmiyat


                        Bullish Pin Bar ki effectiveness ko samajhne ke liye volume ko bhi mad-e-nazar rakhna zaroori hai. Agar ye pattern high volume ke sath bana hai, to iska matlab hai ke ye signal zyada mazboot hai. High volume ka matlab hota hai ke traders is signal ko seriously le rahe hain.
                        6. Entry Point Ka Taayun


                        Jab aap Bullish Pin Bar dekhte hain, to aapka entry point uski high ke thoda upar hona chahiye. Iska matlab hai ke jab market us level ko cross kare, aap trade mein enter karein. Ye approach aapko potential reversal ke waqt trade mein shamil hone ki ijaazat deti hai.
                        7. Stop Loss Ka Istemal


                        Stop loss set karna zaroori hai taake aap apne capital ko protect kar saken. Aam tor par stop loss ko bullish pin bar ke low ke thoda neeche set karna chahiye. Iska matlab hai ke agar market aapki expectations ke mutabiq nahi chalta, to aap zyada nuqsan nahi uthayenge.
                        8. Profit Taking Strategies


                        Profit taking strategies bhi zaroori hain jab aap bullish pin bar ka istemal karte hain. Aapko apne profit targets ko tay karna hoga, jo ke resistance levels ya previous highs ke qareeb ho sakte hain. Ye approach aapko disciplined trading mein madad karegi.
                        9. Multiple Time Frames


                        Multiple time frames ka analysis karna aapki trading strategy ko mazid behtar banata hai. Jab aap higher time frame par bullish pin bar dekhte hain aur lower time frame par confirmation milta hai, to ye aapke trade ki reliability ko badhata hai.
                        10. Market Sentiment


                        Market sentiment ko samajhna bhi zaroori hai. Agar bullish pin bar ek negative news ya event ke baad ban raha hai, to iski reliability kam ho sakti hai. Isliye, economic indicators aur news events ka jaiza lena bhi zaroori hai.
                        11. Psychological Aspects


                        Traders ki psychology bhi is pattern ki trading mein ahmiyat rakhti hai. Bullish pin bar ka nazar aana ye darshata hai ke market mein buyers ka pressure hai. Ye traders ko market ki taraf khinchta hai, jo ke is pattern ko aur bhi mazboot banata hai.
                        12. Risk Management


                        Risk management har trader ke liye essential hai. Bullish pin bar ka istemal karte waqt aapko apne risk-to-reward ratio ka bhi khayal rakhna chahiye. Aam tor par, risk-to-reward ratio 1:2 ya 1:3 hona chahiye taake aapke trades mein long-term profitability ka imkaan ho.
                        13. Common Mistakes


                        Bullish pin bar ka istemal karte waqt kuch aam ghaltiyan hoti hain, jaise ke entry point ka ghalat tay karna ya stop loss ko neglect karna. Isliye, in ghaltiyon se bachna aur disciplined rahna zaroori hai.
                        14. Nateeja


                        Bullish Pin Bar Candlestick Pattern ek powerful tool hai jo traders ko market ke reversal points identify karne mein madad karta hai. Is pattern ka istemal karte waqt context, volume, aur risk management ko mad-e-nazar rakhna zaroori hai. Agar aap in principles ko samajh kar trade karte hain, to aapki trading strategy behtar ban sakti hai.

                        اب آن لائن

                        Working...
                        X