Money Flow Index (MFI) Indicator: A Comprehensive Analysis
The Money Flow Index (MFI) is a powerful tool in the world of technical analysis, offering valuable insights into the strength and direction of money flow in a particular asset. Developed by Gene Quong and Avrum Soudack, the MFI is widely used by traders and investors to make informed decisions in the dynamic financial markets.
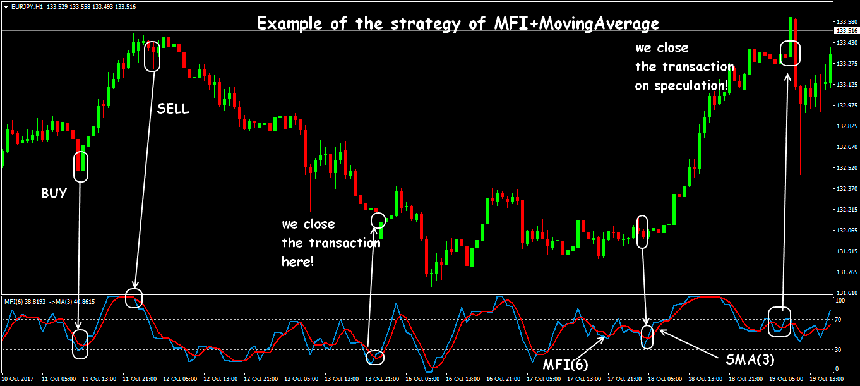
One of the primary benefits of the Money Flow Index is its ability to identify overbought and oversold conditions. The MFI operates on a scale of 0 to 100, with readings above 70 indicating overbought conditions and readings below 30 suggesting oversold conditions. Traders often use these thresholds to anticipate potential reversals in the market.
The calculation of the Money Flow Index involves a multi-step process. First, the typical price for each period is calculated, considering the average of high, low, and closing prices. Then, the raw money flow is determined by multiplying the typical price by the volume. Positive and negative money flow values are segregated based on whether the closing price is higher or lower than the previous period. The Money Flow Ratio is then calculated by dividing the positive money flow by the negative money flow.
The final step involves the computation of the Money Flow Index using the formula: MFI = 100 - (100 / (1 + Money Flow Ratio)). This index provides a clear indication of the strength of money flow, with values closer to 100 reflecting strong buying pressure and values near 0 suggesting robust selling pressure.
Traders often use the Money Flow Index in conjunction with other technical indicators to validate signals and enhance the overall accuracy of their analysis. It is particularly effective when combined with trendlines, support and resistance levels, and chart patterns.
Divergence analysis is another powerful application of the Money Flow Index. Traders look for instances where the price and the MFI are moving in opposite directions, indicating a potential weakening of the prevailing trend. This divergence can serve as an early warning sign for traders to adjust their strategies accordingly.
Moreover, the Money Flow Index is advantageous for spotting potential trend reversals. As the MFI approaches extreme levels, traders become cautious about a possible shift in market sentiment. A divergence between the MFI and price can confirm the likelihood of a reversal, providing traders with valuable insights for decision-making.
In conclusion, the Money Flow Index is a versatile and valuable tool for traders and investors. Its ability to identify overbought and oversold conditions, divergence signals, and potential trend reversals makes it a crucial component of technical analysis strategies. Traders who master the interpretation of the MFI can gain a competitive edge in navigating the complexities of financial markets.


تبصرہ
Расширенный режим Обычный режим