Different benefits of using money flow index indicator.
X
  • وقت
  • دکھائیں
Clear All
new posts
  • #1 Collapse

    Different benefits of using money flow index indicator.
    Money Flow Index (MFI) Indicator: A Comprehensive Analysis

    The Money Flow Index (MFI) is a powerful tool in the world of technical analysis, offering valuable insights into the strength and direction of money flow in a particular asset. Developed by Gene Quong and Avrum Soudack, the MFI is widely used by traders and investors to make informed decisions in the dynamic financial markets.

    One of the primary benefits of the Money Flow Index is its ability to identify overbought and oversold conditions. The MFI operates on a scale of 0 to 100, with readings above 70 indicating overbought conditions and readings below 30 suggesting oversold conditions. Traders often use these thresholds to anticipate potential reversals in the market.

    The calculation of the Money Flow Index involves a multi-step process. First, the typical price for each period is calculated, considering the average of high, low, and closing prices. Then, the raw money flow is determined by multiplying the typical price by the volume. Positive and negative money flow values are segregated based on whether the closing price is higher or lower than the previous period. The Money Flow Ratio is then calculated by dividing the positive money flow by the negative money flow.

    The final step involves the computation of the Money Flow Index using the formula: MFI = 100 - (100 / (1 + Money Flow Ratio)). This index provides a clear indication of the strength of money flow, with values closer to 100 reflecting strong buying pressure and values near 0 suggesting robust selling pressure.

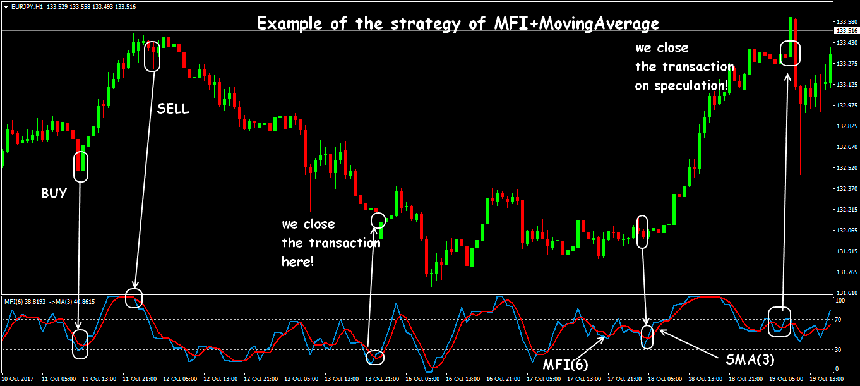
    Traders often use the Money Flow Index in conjunction with other technical indicators to validate signals and enhance the overall accuracy of their analysis. It is particularly effective when combined with trendlines, support and resistance levels, and chart patterns.

    Divergence analysis is another powerful application of the Money Flow Index. Traders look for instances where the price and the MFI are moving in opposite directions, indicating a potential weakening of the prevailing trend. This divergence can serve as an early warning sign for traders to adjust their strategies accordingly.

    Moreover, the Money Flow Index is advantageous for spotting potential trend reversals. As the MFI approaches extreme levels, traders become cautious about a possible shift in market sentiment. A divergence between the MFI and price can confirm the likelihood of a reversal, providing traders with valuable insights for decision-making.

    In conclusion, the Money Flow Index is a versatile and valuable tool for traders and investors. Its ability to identify overbought and oversold conditions, divergence signals, and potential trend reversals makes it a crucial component of technical analysis strategies. Traders who master the interpretation of the MFI can gain a competitive edge in navigating the complexities of financial markets.


    Click image for larger version

Name:	images (6) (2).png
Views:	85
Size:	13.2 کلوبائٹ
ID:	12818800


  • <a href="https://www.instaforex.org/ru/?x=ruforum">InstaForex</a>
  • #2 Collapse

    Assalamu Alaikum Dosto!

    Money Flow Index (MFI)


    Ek strong trading financial markets, jese ke foreign exchange market, ka ek sab se ahem kaam paisa ki redisbursement hai. Stocks, precious metals, aur currency ki khareed/farokht ke zariye paisa person se person tak, company se company tak pohochta hai. Is tarah, ek market economy mein kuch hamwar haasil hoti hai, aur ek mustawar ban jata hai. Paisay ki daakhil ya nikalne ko cash flow kehte hain.
    Forex bhi aise cash flows ka bohot complex aur dynamic system hai. Ek taajir jo tajaweez aur indicator readings ke peeche chhupay cash flows dekh sakta hai. Lekin agar koi khaas indicator istemal kare, toh koi bhi in cash flows ko nazar andaz nahi kar sakta. Ye indicator Money Flow Index ke naam se jana jata hai.
    Money Flow Index (MFI) ek technical indicator hai jo ke price movement speed ka measure hai, jo ke Relative Strength Index (RSI) ke mutabiq hai. Iska farq RSI se hai ke iske calculations mein volume indicator ko shamil kiya jata hai. Is indicator ka moallif trader Bill Williams hai, unho ne is tool ko apne kitaab "Trading Chaos" mein describe kiya. Is oscillator ko banate waqt, unhone tick volume ko market ki expectations ka aham indicator bataya, jo ke price movement ke sath ta'alluq rakhta hai.
    Volume indicator market mein aane wale naye orders ko darust karta hai, jo ke movement ki dar ko badal deta hai. Ya phir, ek aur taur par kaha jaye toh, naye players market mein aate hain aur trades ki tadad badha dete hain, jo ke tick volume mein tabdili dikhata hai. Is tarah, mojood dynamics ki taqat ya kamzori hoti hai.
    MFI ka main faida yeh hai ke yeh ek stable instrument hai jo ke asset (jese ke currency ya stock) mein invest hone wale cash flows ki taqat ka durust measure deta hai. Money Flow Index positive aur negative cash flows ko mawafiq karke, ek measure deta hai jo ke price data ke sath mawafiq hokar trend ki taqat maloom karta hai. Jese ke RSI, MFI bhi 0 se 100 ke darmiyan values leta hai aur 14 candles ke istemal se calculate hota hai. Yeh dekhein ke MFI indicator MetaTrader 4 platform par kaise dikhta hai:

    Click image for larger version

Name:	images - 2024-01-31T131333.288.png
Views:	78
Size:	17.6 کلوبائٹ
ID:	12818802

    Money Flow Indicator Kaise Kaam Karta Hai?

    MFI ka kaam market ke positive aur negative cash flows ki readings ko mawafiq karne ka hai. Agar kisi muddat ke liye price index zyada hai, toh yeh ishara karta hai ke funds asset mein daakhil ho rahe hain. Agar kisi muddat ke liye price index kam hai, toh yeh ishara karta hai ke investors funds asset se nikal rahe hain.
    Ek asset ki price movement ko track karte hue aur ye dikhate hue ke trading volume badh raha hai ya kam ho raha hai, MFI trend ki taqat ko signal karta hai, jisse trading justified hoti hai, naye trend ka shuru hone ko pehchana ja sakta hai, ya woh waqt jab behtareen hai ke orders place na kiye jaayen. Yeh forex trading mein khaas tor par qeemti hai, kyun ke isse market entries ke liye aala tajaweez banai ja sakti hai.

    Money Flow Index ke saath kaam karte waqt, yeh tips madde nazar rakhen:[LIST][*]Divergence ke data ke baren mein. Agar prices barh rahe hain aur Money Flow Index value ghat rahi hai (ya ulta ho), toh ek price reversal mumkin hai;[*]Money Flow Index ke readings 80 ke upar ya 20 ke neeche potential market top ya bottom ko indicate karte hain;[*]MFI har time frame par achhe taur par kaam karta hai - paanch minute se lekar haftay ke charts tak.

    Is indicator ko setup karna laconic hai. Iske sirf ek parameter hote hain - period (default mein 14) jiski calculation hoti hai. Jitna chota period ka value hoga, utna hi MFI zyada responsive aur volatile hoga:

    Yaad rakhein, zyada sensitivity bhi bohot achi nahi hoti - bohot saare false signals ho sakte hain.

    Iske alawa, aap is indicator ke display ka style customize kar sakte hain aur levels set kar sakte hain. Default mein, woh 20% (20% ya is se kam - oversold area) aur 80% (80% ya is se zyada - overbought area) hote hain.

    Money Flow Index Indicator Calculation


    MFI indicator ka calculation algorithm kaafi complex hai. Isko yaad rakhne ki zarurat nahi hai, lekin is se waqif hona koi buri baat nahi hai taa'ke indicator ke peeche ki logic ka aam idea ho.

    MFI calculation ke stages:
    • Candle ki closing price, minimum aur maximum price ke darmiyan ka arithmetic mean nikalna;
    • Money Flow per unit of time calculate karna, average price ko volume se multiply karke positive flow (current average price pehle se zyada hai) ya negative flow (average price pehle se kam hai) se divide karke;
    • Money Ratio indicator calculate karna, positive flows ki sum ko negative flows ki sum se divide karke;
    • Money Flow Index indicator values ko direct calculate karna. Iske liye 100 ko Money Ratio indicator ki sum aur ek se divide karne ka result subtract karna hai.


    Jo values nikalti hain woh 0 se 100 ke darmiyan hoti hain. Lines 20 aur 80 ya 30 aur 70 ko ahem levels samjha jata hai. 80 (70) se 100 ke darmiyan wala area overbought area kehlata hai. 0 aur 20 (30) ke darmiyan wala area oversold area kehlata hai.

    Money Flow Index Signals MFI Kaise Read Karein

    MFI ke principle se waqif hone ke baad, hum iske trading signals ko study kar sakte hain. Teen mukhya signals hote hain:
    1. Overbought/Oversold. Jese RSI aur doosre oscillators, Money Flow Index bhi market ke "overheating" ke waqt ko determine karne ke liye perfect hai. Agar MFI 80% level ko paar karta hai, toh yeh ishara karta hai ke market overbought hai. Jab indicator neeche jaane lagta hai aur dobara 80% level ko cross karta hai, lekin iss baar neeche se, toh yeh ek sell signal hai. Aur ulta, jab indicator 20% level ko neeche jaata hai, phir upar badhta hai aur oversold area se bahar nikalta hai, toh yeh ek buy signal hai.
    2. Divergence. Yeh ek classic aur bohot taqatwar reversal signal hai oscillators ke liye. Divergence - chart par price movement ki direction aur indicator readings mein farq. Aur aise divergence par, aapko bilkul indicator ki taraf tawajjo deni chahiye.

      Misaal ke liye, chart par do local minimums (troughs) hain, aur doosra trough pehle se kam hai. Visual taur par, chart par price gir rahi hai, trend neeche ki taraf hai. Lekin indicator chart par, tasweer ulta hai. Wahan bhi do troughs bane hain jo ke price chart ke ke mutabiq hain, lekin doosra indicator ka minimum pehle se zyada hai. Yeh ek bullish divergence hai, jo ke ishara karta hai ke market jald hi reverse hoga aur upar jaayega.

      Wahi, lekin ulta (divergence in the highs, aur peaks), bearish divergence hogi, jo ke neeche market ke reversal ko ishara karegi. By the way, agar divergence 2nd extremum (highs, lows) par nahi balki 3rd par (highs, lows), toh signal aur bhi majboot ho jayega.
    3. Central Line ka Cross. Yeh shayad MFI ka sabse asaan trading signal ho. Hum indicator chart par central line (50%) ko add karte hain aur intezaar karte hain ke isse cross ho. Agar MFI ise neeche se cross karta hai, toh yeh ek buy signal hai; upar se neeche jaata hai, toh sell signal hai.


    Money Flow Index (MFI) Ki Trading

    MFI indicator ke istemal ki principles RSI ke istemal se kuch zyada nahi farq karte. Chaliye inko ek ek karke discuss karte hain.
    Jese ke humne pehle bhi kaha hai, 20 aur 80 levels Money Flow indicator ke liye ahem levels hote hain. Jab yeh pair line 80 ko neeche cross karta hai, toh yeh indicator ek signal deta hai ke currency pair ko bechna chahiye. Agar chart line oversold area se bahar nikal jata hai (20 level ko upar cross karta hai), toh humein umeed hai ke price mein izafa hoga.
    Yeh signals 100% darust nahi hote aur inhe mazeed filters ki zarurat hoti hai. Aap is indicator ke readings ko check karne ke liye overbought aur oversold areas par calculate hone wale doosre oscillators ka istemal kar sakte hain, jo ke alag tareeqe se calculate hote hain. For example, Stochastic.
    MFI indicator ke 50 level ke relative position ne pair ki sentiment ko indicate karta hai. Agar chart ise neeche se cross karta hai, toh yeh ishara karta hai ke pair bearish mood mein hai. Jab indicator line 50 level ko upar cross karti hai, toh yeh darust hai ke market par bulls ka dominion hai.
    MFI indicator jo ke cash flow ki intensity ko napta hai, ek umoomi oscillator hai. Iska istemal classical scheme par kaam karne ke liye mumkin hai (divergences ki talash, overbought/oversold areas), lekin yeh doosre tools ke bina kaam karna zyada mufeed nahi hai. Behtar hai ke aap ise doosre indicators ke saath istemal karen takay market mein galat dakhil hone ki tadad ko kam kiya ja sake aur trading ki munafaat ko barhaya ja sake.


    • #3 Collapse


      Different benefits of using money flow index indecater


      Definition


      Money Flow Index (MFI) ek technical indicator hai jo market ke momentum aur trend reversal ko evaluate karne mein madad karta hai. Yeh indicator predominantly volume aur price analysis par mabni hota hai, aur traders ko market ke potential entry aur exit points ka pata lagane mein madad deta hai. Money Flow Index ka istemal karne ke kai faide hain jo forex aur stock trading mein istemal hota hai.


      Money Flow Index Indicator Ke Kuch Fayde:

      1. Momentum Aur Trend Reversals Ka Pata Lagana:
        • MFI, market ke momentum ko measure karta hai. Agar MFI high hai, toh yeh indicate karta hai ke market mein strong buying pressure hai, aur agar low hai toh yeh bearish sentiment ko darust karta hai. Isse traders ko trend reversals aur momentum shifts ka pata chalta hai.
      2. Overbought aur Oversold Conditions Ka Pata Lagana:
        • MFI ki madad se traders overbought ya oversold conditions ka pata laga sakte hain. Agar MFI ek certain level se zyada hai (commonly 70), toh yeh indicate karta hai ke market overbought hai aur prices mein correction ho sakti hai. Upar se neeche jaane wala MFI (commonly 30 ke neeche) oversold conditions ko darust karta hai, jisse future mein price increase hone ka indication hota hai.
      3. Volume Analysis:
        • MFI volume analysis par mabni hota hai, jisse ke traders ko market ke participation aur strength ka pata lagta hai. Agar price aur volume dono badh rahe hain aur MFI bhi high hai, toh yeh ek strong uptrend ko indicate karta hai.
      4. Divergence Ki Recognition:
        • MFI ki madad se traders divergence identify kar sakte hain, jahan price aur indicator mein mukhtalif directions ki movement hoti hai. Divergence, trend reversal ko indicate kar sakti hai aur traders ko advance mein market movement ka pata chal sakta hai.
      5. Entry Aur Exit Points Ka Tayaar Karna:
        • Money Flow Index, traders ko potential entry aur exit points tay karnay mein madad karta hai. High MFI values par traders apne positions ko monitor karte hain aur low MFI values par entry points tay karte hain.
      6. Risk Management:
        • MFI, risk management mein bhi istemal hota hai. Traders apne stop-loss orders ko tay karte hain aur MFI ke fluctuations ko monitor kar ke apni positions ko manage karte hain.
      7. Short-Term aur Long-Term Trends Ka Analysis:
        • MFI, short-term aur long-term trends ka bhi analysis karti hai. Short-term trends mein jyada volatility aur fluctuations hote hain, jabki long-term trends mein stability aur consistency hoti hai.
      8. Combination with Other Indicators:
        • MFI ko doosre technical indicators ke sath combine karke bhi istemal kiya ja sakta hai, jese ke moving averages, relative strength index (RSI), ya stochastic oscillators. Isse trading signals aur confirmations ko aur bhi strong bana sakte hain.


      Money Flow Index Ka Istemal Karte Waqt Kuch Zaroori Baatein:
      1. Confirmation with Other Indicators:
        • MFI ko doosre technical indicators ke sath istemal karna behter hota hai taki false signals se bacha ja sake. Ismein RSI, moving averages, aur trend lines shamil hote hain.
      2. Period Setting:
        • MFI ka period setting important hai. Different market conditions ke liye, traders ko alag-alag period settings tajaweez ki jaati hain. Ye typically 14 ya 21 days ke liye hoti hain.
      3. Market Conditions:
        • MFI ke signals ko samajhne ke liye market conditions aur trend ke saath juda hona zaroori hai. Market ke different phases mein, MFI ke signals ka interpretation bhi change ho sakta hai.
      4. Risk Management:
        • Money Flow Index ka istemal karne wale traders ko risk management par bhi tawajju deni chahiye. Stop-loss orders aur position sizes ko carefully plan karna important hai.Overall, Money Flow Index ek versatile indicator hai jo traders ko market ke dynamics ko samajhne mein madad karta hai. Lekin, har indicator ki tarah, isko bhi sahi tajaweez aur doosre confirmatory tools ke saath istemal karna zaroori hai. Isse traders ko accurate aur reliable trading signals milte hain.


      • #4 Collapse

        Hello dear friends


        What is Gravestone Doji pattern in forex


        Definition


        Gravestone Doji, forex trading mein ek specific candlestick pattern hai jo market mein potential trend reversal ko indicate karta hai. Ye pattern market ke sentiment aur price dynamics ko interpret karne mein traders ko madad karta hai. Gravestone Doji candlestick ek bearish reversal signal hai aur traders ko alert karta hai ke market mein potential shift hone wala hai.

        Gravestone Doji Pattern Ki Pehchan:


        Gravestone Doji ek candlestick pattern hai jo ek specific market condition ko darust karta hai. Iski pehchan karne ke liye kuch key characteristics hain:
        1. Body Ka Shape:
          • Gravestone Doji ka body chhota hota hai aur iska closing price opening price ke bohot qareeb hota hai. Iska shape ek taweez ya gravestone ki tarah hota hai.
        2. Upper Wick Ka Length:
          • Gravestone Doji ki sabse prominent feature upper wick ka lamba hona hota hai. Upper wick highest price ko represent karta hai, aur agar ye lamba hai, toh ye indicate karta hai ke market mein sellers ne control le liya hai.
        3. Lower Wick Ya Absence:
          • Lower wick ya uska bilkul na hona Gravestone Doji ki pehchan mein important hai. Lower wick ka na hona ya bahut chhota hona ye dikhata hai ke buyers ne attempt kiya tha lekin unka success nahi hua.
        4. Color:
          • Gravestone Doji typically bearish reversal ko indicate karta hai, isliye iski body red ya black hoti hai.

        Gravestone Doji Pattern Ka Maayne:


        Gravestone Doji pattern ka matlub hota hai ke market mein buyers initially control mein thay lekin phir se sellers ne control le liya hai. Is pattern ke formation ke baad, traders ko ye samajh aata hai ke market mein trend reversal hone ka potential hai aur future mein prices mein girawat hone ki sambhavna hai.

        Gravestone Doji Pattern Aur Trading


        Strategies
        Reversal Signal:
        1. ​​​​​​
          • Gravestone Doji ek bearish reversal signal hai. Agar ye pattern market chart par dikhai de raha hai, toh traders ko alert hona chahiye ke bullish trend ke baad bearish reversal hone ki sambhavna hai.
        2. Confirmation with Other Indicators:
          • Gravestone Doji pattern ko confirm karne ke liye traders ko doosre technical indicators ka bhi istemal karna chahiye. Isse pattern ki reliability badhti hai.
        3. Entry Point Tey Karna:
          • Traders ko Gravestone Doji pattern ke baad entry point tay karna hota hai. Entry point ko confirm karne ke liye doosre confirmatory signals ka bhi dhyan rakhna zaroori hai.
        4. Stop-Loss Aur Take-Profit Levels:
          • Har trade mein stop-loss aur take-profit levels ko carefully plan karna important hai. Stop-loss level ko trend ke opposite side par aur take-profit level ko trend ke mutabiq set karna zaroori hai.
        5. Risk Management:
          • Har trading strategy mein risk management ka dhyan rakhna crucial hai. Position size aur risk tolerance ke hisab se stop-loss orders tay karna zaroori hai.


        Gravestone Doji Pattern Ka Istemal Ke Fayde:


        1. Bearish Reversal Ka Pata Lagana:
          • Gravestone Doji pattern bearish reversal ko identify karne mein madad karta hai, jisse ke traders future price movements ke liye taiyar rahein.
        1. Market Sentiment Ko Interpret Karna:
          • Is pattern ka istemal karke traders market sentiment ko better interpret kar sakte hain. Gravestone Doji market mein shift hone wale sentiment ko represent karta hai.
        2. Entry Aur Exit Points Tey Karna:
          • Gravestone Doji pattern traders ko potential entry aur exit points tay karnay mein madad deta hai.
        3. Confirmation with Other Patterns:
          • Gravestone Doji ko doosre candlestick patterns ke sath combine karke bhi istemal kiya ja sakta hai, jisse ke confirmatory signals mil saken.
        4. Technical Analysis Mein Istemal:
          • Gravestone Doji pattern technical analysis ke important component hain aur traders inka istemal karke apne trading strategies ko optimize kar sakte hain.In conclusion, Gravestone Doji pattern bearish reversal ko darust karnay mein madad karta hai aur traders ko market dynamics ko better samajhne mein madad deta hai. Lekin, is pattern ka istemal karne se pehle traders ko market conditions aur confirmatory indicators ka dhyan rakhna zaroori hai.


        • #5 Collapse

          Forex Mein Money Flow Index Indicator[][][][][]

          Forex mein Money Flow Index (MFI) ek technical analysis indicator hai jo price aur volume ke correlation ko analyze karta hai. Yeh indicator mainly overbought ya oversold conditions ko identify karne mein madad karta hai, jo traders ko potential reversals ki indication deta hai.

          MFI ko calculate karne ke liye, sabse pehle typical price (high + low + close)/3 aur fir raw money flow (typical price * volume) ko calculate kiya jata hai. Phir, positive money flow aur negative money flow ko calculate kiya jata hai. Positive money flow, jab price higher close karta hai aur negative money flow, jab price lower close karta hai.

          Forex Mein Money Flow Index Indicator Ke Fawaed[][][][][]

          Money Flow Index (MFI) ka istemal forex trading mein kai fawaid pohancha sakta hai:
          1. Overbought aur Oversold Conditions ki Pehchan: MFI traders ko overbought aur oversold conditions ko identify karne mein madad karta hai. Overbought conditions mein, jab MFI 80 se zyada hota hai, wahan price mein reversal ka chance hota hai aur traders short positions le sakte hain. Jab MFI 20 se kam hota hai, tab oversold conditions hoti hain aur price mein reversal ka potential hota hai, jiske baad traders long positions le sakte hain.
          2. Price Reversals ki Prediction: MFI traders ko price reversals ke potential points ko predict karne mein madad karta hai. Jab MFI extreme levels (80 ya 20) tak pahunchta hai, tab price mein reversal hone ka chance hota hai. Isse traders ko entry aur exit points decide karne mein asani hoti hai.
          3. Divergence ki Pehchan: MFI ki madad se traders price aur volume ke beech ki divergence ko identify kar sakte hain. Agar price higher highs banata hai aur MFI lower highs, ya phir price lower lows banata hai aur MFI higher lows, toh yeh divergence signal hai jo price reversal ki possibility ko darust karta hai.
          4. Trend Confirmation: MFI ek trend confirmation tool bhi hai. Agar trend upar ki taraf ja raha hai aur MFI bhi upar ja raha hai, toh yeh uptrend ko confirm karta hai. Isi tarah, agar trend neeche ki taraf ja raha hai aur MFI bhi neeche ja raha hai, toh yeh downtrend ko confirm karta hai.
          5. Simple aur Effective Tool: MFI simple aur effective indicator hai jo price aur volume ke correlation ko analyze karta hai. Iska istemal karna easy hota hai aur isse traders market ka better understanding kar sakte hain.

          Overall, Money Flow Index (MFI) ek powerful technical indicator hai jo traders ko market analysis mein madad karta hai aur trading decisions lene mein confidence deta hai. Lekin, jaise har indicator ki tarah, iska istemal bhi dusre confirmatory tools aur risk management ke saath kiya jana chahiye.
          • #6 Collapse


            Money Flow Index (MFI) ek momentum oscillator hai jo market ke buying or selling pressure ko measure karta hai. Chaliye, is indicator ke faide aur uske tafseelat ke bare mein baat karte hain:

            Money Flow Index (MFI) Kya Hai? MFI ek technical indicator hai jo volume aur price ke combination se market ke momentum ko measure karta hai. Yeh indicator typically 0 se 100 tak ke range mein hota hai. High MFI values indicate strong buying pressure and low MFI values indicate weak buying pressure.

            Money Flow Index (MFI) Ke Faida:
            1. Momentum Ko Measure Karna: MFI market ke momentum ko measure karne mein madad karta hai. High MFI values strong buying pressure ko indicate karte hain aur low MFI values weak buying pressure ko indicate karte hain.
            2. Overbought Aur Oversold Conditions Ko Identify Karna: MFI overbought aur oversold conditions ko identify karta hai. Agar MFI ki value 80 ke upar hai, toh yeh overbought condition ko indicate karta hai aur agar 20 ke neeche hai, toh yeh oversold condition ko indicate karta hai.

            Money Flow Index (MFI) Ka Istemal:
            Divergence Ko Identify Karna:
            MFI ka istemal divergence ko identify karne ke liye hota hai. Agar price chart mein higher highs hote hain aur MFI mein lower highs hote hain (ya vice versa), toh yeh bearish divergence ko indicate karta hai aur potential trend reversal ka signal deta hai.
            Overbought Aur Oversold Conditions Par Trading:
            MFI ka istemal overbought aur oversold conditions par trading ke liye bhi hota hai. Jab MFI 80 ke upar jaata hai, toh yeh overbought condition ko indicate karta hai aur traders ko short positions lene ke liye suggest karta hai. Aur jab MFI 20 ke neeche jaata hai, toh yeh oversold condition ko indicate karta hai aur traders ko long positions lene ke liye suggest karta hai.

            Money Flow Index (MFI) Ke example:
            Maan lijiye aap EUR/USD currency pair ke price chart par dekh rahe hain aur MFI indicator ka istemal kar rahe hain. Agar MFI ki value 80 ke upar jati hai aur price chart mein reversal candlesticks dikh rahe hain, to yeh ek potential short entry point ko dust karta hai.

            important:
            MFI ek powerful indicator hai lekin iska istemal karne se pehle traders ko iske interpretation aur market ke overall conditions ko samajhna zaroori hai. Iske alawa, MFI ko dusri technical analysis tools ke sath istemal karke hi trading decisions lena chahiye.
            • <a href="https://www.instaforex.org/ru/?x=ruforum">InstaForex</a>
            • #7 Collapse


              Money Flow Index (MFI) ek ahem technical analysis indicator hai jo market trend aur momentum ka andaza lagane mein madad deta hai. Yeh indicator market mein bullish ya bearish signals ko identify karta hai. Yahan hum Money Flow Index ke mukhtalif faiday par ghaur karenge:
              1. Trend aur Momentum ki Pehchan: MFI market ke trend aur momentum ko identify karne mein madad karta hai. Yeh indicator price aur volume ke combination ko istemal karta hai takay market ki direction ko samjha ja sake. Is tarah se, traders ko market ka trend pata chal jata hai aur woh apne trading strategies ko us trend ke mutabiq adjust kar sakte hain.
              2. Overbought aur Oversold Levels ki Pehchan: Money Flow Index overbought aur oversold levels ko identify karne mein istemal hota hai. Jab MFI ek high level ko cross karta hai, yeh indicate karta hai ke market overbought ho gayi hai aur price ka reversal hone ka chance hai. Isi tarah, jab MFI ek low level ko cross karta hai, yeh indicate karta hai ke market oversold ho gayi hai aur price ka upward movement ka chance hai.
              3. Divergence ki Pehchan: MFI divergence ko detect karne mein madad karta hai. Divergence tab hoti hai jab price aur MFI mein opposite directions ki movement hoti hai. Jaise agar price ek naye high banati hai lekin MFI ek lower high banata hai, toh yeh bearish divergence ho sakti hai, jo future mein price ka downward movement indicate karti hai. Isi tarah, agar price ek naye low banati hai lekin MFI ek higher low banata hai, toh yeh bullish divergence ho sakti hai, jo future mein price ka upward movement indicate karti hai.
              4. Entry aur Exit Points ka Pata Lagana: Money Flow Index entry aur exit points ka pata lagane mein madad karta hai. Overbought aur oversold levels ko dekhte hue, traders apne positions ko enter ya exit kar sakte hain. Agar market overbought hai aur MFI ne downward movement shuru kiya hai, toh yeh ek sell signal ho sakta hai. Aur agar market oversold hai aur MFI ne upward movement shuru kiya hai, toh yeh ek buy signal ho sakta hai.
              5. Confirmation ke Liye Istemal: MFI dusre technical indicators ke sath istemal kiya ja sakta hai confirmation ke liye. Agar kisi aur indicator ki signal ke sath MFI ka signal bhi match karta hai, toh woh signal aur bhi strong ho jata hai. Is tarah se, traders apne trading decisions ko confirm kar sakte hain.
              6. Volatility ka Pata Lagana: MFI volatility ko bhi measure karta hai. Jab MFI ki values tezi se change karti hain, toh yeh indicate karta hai ke market mein zyada volatility hai. Isi tarah, jab MFI ki values dheere se change karti hain, toh yeh indicate karta hai ke market mein kam volatility hai.
              7. Long aur Short Term Trends ka Analysis: Money Flow Index long aur short term trends ka analysis karne mein madad karta hai. Isse traders ko pata chal jata hai ke market mein kis direction mein trend hai aur woh apne trading strategies ko us trend ke mutabiq adjust kar sakte hain.
              8. Risk Management ke Liye: MFI traders ko risk management ke liye bhi madad karta hai. Overbought aur oversold levels ko dekhte hue, traders apne positions ko manage kar sakte hain aur apne nuksan ko minimize kar sakte hain.

              Key Notes:
              • MFI 0 se 100 tak ka scale istemal karta hai.
              • MFI calculation mein price aur volume ka istemal hota hai.
              • Overbought aur oversold levels ko identify karne ke liye, commonly 70 aur 30 level ka istemal hota hai.
              • MFI divergence bullish ya bearish signals ke liye istemal kiya jata hai.
              • MFI ka istemal short term aur long term trading strategies mein kiya ja sakta hai.
              • MFI ek lagging indicator hai, isliye market trends ko confirm karne ke liye istemal hota hai.
              • MFI ke signals ko dusre technical indicators ke sath confirm karna zaroori hai.
              • MFI ke istemal se pehle, traders ko iske functionality aur interpretation ka pura ilm hona chahiye.


              اب آن لائن

              Working...
              X