Counter Attack Pattern In Forex

No announcement yet.
`
X
  • وقت
  • دکھائیں
Clear All
new posts
  • #1 Collapse

    Counter Attack Pattern In Forex
    Hello,
    Dosto kaise hain aap umeed hay ke aap khyryat se hongay aur trading enjoy kar rahe hongay aj ka hamara topic hay counter Attack pattern kis ko ham aaj detail ke sat discus karenge


    Forex main counter attack pattern kya hota hay?

    Forex main counter attack pattern ek do candle ka reversal pattern hay jo downtrend ya uptrend main ho sakta hay. Is pattern main first candle trend ke sath hota hay aur second candle trend ke khilaf hota hay.
    Click image for larger version

Name:	images - 2024-01-31T093623.521_1.jpeg
Views:	44
Size:	22.3 کلوبائٹ
ID:	12818534


    Counter attack pattern ko chart main kaise find kiya jata hay?

    Counter attack pattern ko chart main find karne ke liye aapko yeh steps follow karne chahiye:

    Pehli baat to yeh dekhen ki market trend main hai ya nahi.

    Agar market trend main hai to fir pehli candle ka trend dekhen.

    Agar pehli candle trend ke sath hai to fir second candle ka trend dekhen.

    Agar second candle trend ke khilaf hai to fir yeh counter attack pattern ho sakta hay.


    Counter attack pattern ko market main kaise use kiya jata hay?

    Counter attack pattern ko market main use karne ke liye aapko yeh steps follow karne chahiye:

    Pehli baat to yeh dekhen ki pattern complete ho gaya hai ya nahi.

    Agar pattern complete ho gaya hai to fir second candle ke close ke baad trade karna start kar sakte hain.Trade ka direction trend ke khilaf hota hay.


    Bullish counter attack patt

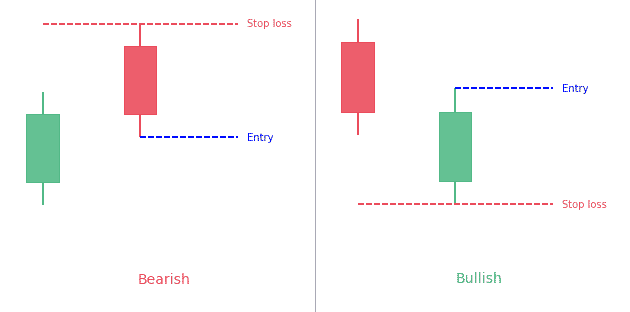
    Bullish counter attack pattern downtrend main hota hay. Is pattern main first candle ek long black candle hota hay aur second candle ek long white candle hota hay. Second candle first candle ke gap ko close karta hay aur first candle ke close ke paas close hota hay.
    Click image for larger version

Name:	images - 2024-01-31T093426.594_1.png
Views:	36
Size:	10.2 کلوبائٹ
ID:	12818535


    Bearish counter attack pattern

    Bearish counter attack pattern uptrend main hota hay. Is pattern main first candle ek long white candle hota hay aur second candle ek long black candle hota hay. Second candle first candle ke gap ko close karta hay aur first candle ke close ke paas close hota hay.
    Click image for larger version

Name:	images - 2024-01-31T093426.594_2.png
Views:	36
Size:	10.0 کلوبائٹ
ID:	12818536


    Counter attack pattern ki strength

    Counter attack pattern ek strong reversal pattern hota hay. Is pattern ka success rate bahut zyada hota hay.


    Counter attack pattern ke liye risk management

    Counter attack pattern ka use karne ke liye risk management bahut important hota hay. Aap stop loss ko first candle ke low se set kar sakte hain.
    Thank you for your attention
  • <a href="https://www.instaforex.org/ru/?x=ruforum">InstaForex</a>
  • #2 Collapse

    Assalamu Alaikum Dosto!

    Counterattack Line Candlestick Pattern


    Counterattack line candlestick pattern aik trend reversal pattern hai, jo prices k top par ya bohut zoada bottom main paya jata hai. Pattern do candles par mushtamil hota hai, jis main pehli candle market k maojoda trend ko zahir karti hai, jab k pattern ki dosri candle market k trend reversal ka sabab banti hai. Iss pattern ko meeting line pattern bhi kaha jata hai, q k pattern ki khas baat ye hai, k dono candles ka close point same hi price par banta hai. Jab k dono candlestick aik dosre se opposite direction main open hoti hen. Pattern ki dono candles lazmi real body main honi chaheye aur trend reversal candle pehli candle k opposite direction aur color main zaror honi chaheye.

    Click image for larger version

Name:	images - 2024-01-31T100236.412.png
Views:	37
Size:	16.6 کلوبائٹ
ID:	12818545

    Bullish Counter Attack Line Pattern


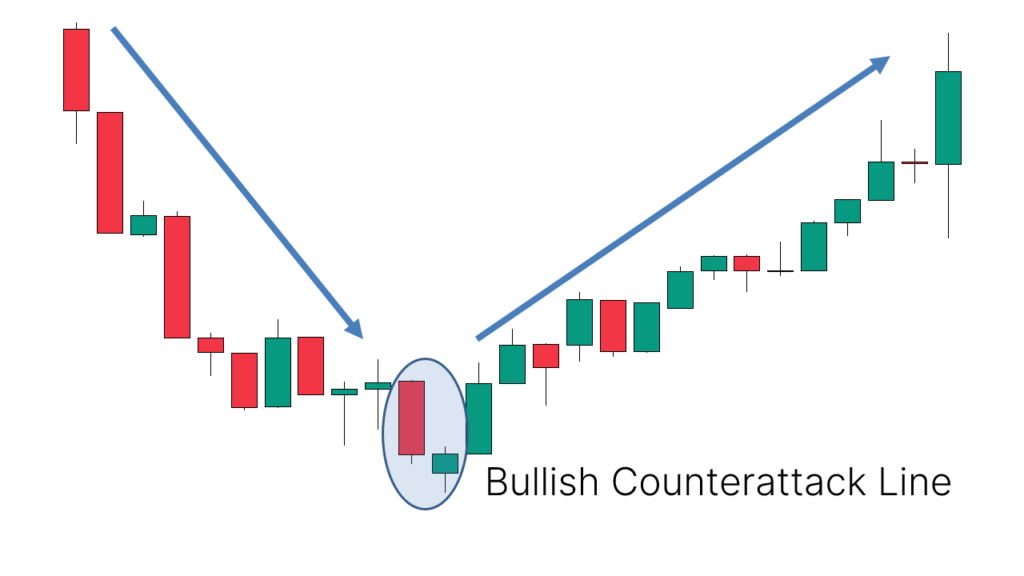
    Bullish counter attack line pattern main aik bullish candle bearish trend ki akhari candle par lower side se attack karke market main bearish trend ka khatma karti hai. Ye pattern two days candles par mushtamil hota hai, jiss main pehli candle aik long real body wali bearish candle hoti hai, jo k qeematon ko downward push karti hai. Pattern ki dosri candle aik bullish candle hoti hai, jo k open pehli candle se below gap main hoti hai, lekin close pehli candle k closing point par hoti hai. Yanni pehli aur dosri candles k closing prices same point par melte ya meeting karte hen iss waja se iss pattern ko meeting line pattern bhi kaha jata hai. Bullish meeting line pattern ka opposite side ya bottom price par bearish counter attack line pattern banta hai, jo k bearish trend reversal pattern hai.


    Bearish Counterattack Line Candlestick Pattern

    Bearish counterattack line candlestick pattern aik bearish trend reversal pattern hai, jo k do candles par mushtamil hota hai. Ye pattern prices k top ya bullish trend main banne ki waja se prices ko mazeed ooper jane se rokti hai. Ye pattern dekhne main "Bearish Belt-Hold Line Candlestick Pattern" ki tarah hota hai, lekin dosri candle ki real body k upper side par bhi wick ya shadow banti hai, jab k prices pehli candle k close point se below bhi nahi jati hai. Bearish counterattack line pattern ki dosri candle aik bari real body wali bearish candle hoti hai, jiss k close price pehli candle k close price se nechay close nahi hona chaheye. Bearish counterattack line pattern ki dosri candle strong banne ki waja se prices reverse hoti hai, aur bearish trend reversal ka sabab banti hai.


    Trading

    Counterattack line pattern buyers aur sellers ki achanak market main pressure ki waja se banti hai, jiss main market main buyers ki dabao ka khatma karke prices k top ko bearish trend main badal deti hai. Bearish counter attack line pattern par trading se pehle aik confirmation black candle ka hona zarori hai, jo k dosri candle k baad real body main honi chaheye, jiss par sellers market main sell ki entry kar sakte hen. Jab k bullish counterattack line candlestick pattern par trading se pehle aik bullish candle ka pattern k baad banna aham hai, jis k baad hi market me entry ki ja sakti hai. Bearish counterattack line pattern me aggar pattern k baad white candle banti hai to pattern ki reliability khatam ho jati hai, aur bullish counterattack line me pattern k baad bearish candle se pattern ka asar invalid ho jata hai. Stop Loss k leye beariah pattern ka sab se top position jab k bullish pattern k leye pattern ka sab se bottom position muntakhib karen, jo k dosri candle ka top ya bottom banega, se two pips above ya below select karen.


    • #3 Collapse


      "Counter Attack Pattern"

      Forex trading mein ek candlestick pattern hai jo market mein trend reversal ko darust karta hai. Yeh pattern bullish trend ke badle mein bearish reversal ko darust karta hai. Aaiye is pattern ko roman Urdu mein samajhte hain.
      Click image for larger version

Name:	blog-10.jpg
Views:	39
Size:	42.5 کلوبائٹ
ID:	12818579
      Counter Attack Pattern Kya Hai:

      Counter Attack Pattern ek candlestick pattern hai jo trend reversal ko darust karta hai. Yeh pattern bull market ke doran aata hai aur bullish movement ke baad market mein bearish sentiment ko highlight karta hai.

      Counter Attack Pattern Ki Pechan:
      1. Pehla Candlestick (Bullish):
        • Counter Attack pattern ka pehla candlestick ek strong bullish candle hota hai jiska upper shadow lamba hota hai. Yeh candle bullish trend ko darust karta hai.
      2. Doosra Candlestick (Bearish):
        • Doosra candlestick pehle wale bullish candle ke upar hota hai aur iski body bearish hoti hai. Is candlestick ka body pehle wale candlestick ke andar hota hai. Agar yeh candlestick pehle wale candlestick ke closing price se neeche close hota hai, toh yeh bearish reversal ko indicate karta hai.

      Trading Strategy:

      Counter Attack Pattern ko dekhte hue traders bearish reversal ke signals ke liye tayyar ho sakte hain. Agar aap is pattern ko observe karte hain, toh aapko sell position enter karne ka mauka milta hai.

      Kuch Ahem Baatein:
      1. Confirmation Aur Dusre Indicators:
        • Counter Attack pattern ko dekhne ke baad, traders ko confirmatory signals ka intezaar karna chahiye, jaise ke doosre technical indicators ya chart patterns ki taraf se bearish signals.
      2. Risk Management:
        • Har trading decision mein risk management ko yaad rakhein. Stop-loss orders ka istemal karein takay aap apne trades ko protect kar sakein.
      3. Time Frame:
        • Different time frames par Counter Attack Pattern dekha ja sakta hai. Lekin, chunauti yeh hai ke aapko apne trading strategy ko market conditions ke mutabiq customize karna padega.
      4. Dusre Technical Indicators Ke Saath:
        • Counter Attack Pattern ko dusre technical indicators ke saath combine karein. Isse aapko confirmatory signals milenge aur aap apne trading decisions ko strengthen kar sakte hain.

      Yeh important hai ke aap hamesha market trends aur conditions ko analyze karein aur multiple technical indicators ka istemal karein, taake aapki trading decisions sahi aur informed ho. Trading mein hamesha risk hai, isliye savdhaan rahein aur apne trading plan ko discipline ke saath follow karein.

      • #4 Collapse


        Counter Attack Pattern in Forex (Forex Mein Counter Attack Pattern):

        Counter Attack Pattern ek candlestick pattern hai jo market mein trend reversal ko darust karta hai. Yeh pattern bearish trend ke baad hone wale possible bullish reversal ko indicate karta hai. Aaiye is pattern ko roman Urdu mein samajhte hain.
        Click image for larger version

Name:	image_55497.jpg
Views:	36
Size:	18.7 کلوبائٹ
ID:	12818616
        Counter Attack Pattern Kya Hai:

        Counter Attack Pattern ek single candlestick pattern hai, jo market mein trend reversal ko represent karta hai. Yeh pattern bearish trend ke baad aata hai aur bullish reversal ko darust karta hai.

        Counter Attack Pattern Ki Pechan:
        1. Candlestick Ka Jism (Body):
          • Counter Attack pattern ki pehchan ke liye dekhein ke candle ki body kis tarah ki hai. Agar yeh pattern bearish trend ke baad aata hai, toh iski body choti hogi aur bullish color ki hogi.
        2. Shadows (Upper aur Lower Shadows):
          • Candle ki upper aur lower shadows ko dekhein. Agar counter attack pattern bearish trend ke baad aata hai, toh iski upper shadow lambi hogi aur lower shadow choti hogi.
        3. Closing Price:
          • Closing price upper end par hoti hai, jo bullish reversal ko indicate karta hai.

        Trading Strategy:

        Counter Attack Pattern ko dekhte hue traders bullish reversal ke signals ke liye tayyar ho sakte hain. Agar aap is pattern ko observe karte hain, toh aapko buy position enter karne ka mauka milta hai, expecting ke market mein bullish move hone ke chances hain.

        Kuch Ahem Baatein:
        1. Confirmation Aur Dusre Indicators:
          • Counter Attack Pattern ko dekhne ke baad, traders ko confirmatory signals ka intezaar karna chahiye, jaise ke doosre technical indicators ya chart patterns ki taraf se bullish signals.
        2. Risk Management:
          • Har trading decision mein risk management ko yaad rakhein. Stop-loss orders ka istemal karein takay aap apne trades ko protect kar sakein.
        3. Time Frame:
          • Different time frames par Counter Attack Pattern dekha ja sakta hai. Lekin, chunauti yeh hai ke aapko apne trading strategy ko market conditions ke mutabiq customize karna padega.
        4. Dusre Technical Indicators Ke Saath:
          • Counter Attack Pattern ko dusre technical indicators ke saath combine karein. Isse aapko confirmatory signals milenge aur aap apne trading decisions ko strengthen kar sakte hain.

        Yeh important hai ke aap hamesha market trends aur conditions ko analyze karein aur multiple technical indicators ka istemal karein, taake aapki trading decisions sahi aur informed ho. Trading mein hamesha risk hota hai, isliye savdhaan rahein aur apne trading plan ko discipline ke saath follow karein.

        • #5 Collapse


          Counter Attack Pattern in Forex

          Counter Attack Pattern ek technical analysis tool hai jo market trends aur reversals ko identify karne mein madad karta hai. Yeh pattern bullish ya bearish trends ke opposite movements ko represent karta hai. Aaiye is pattern ko roman Urdu mein samajhte hain.
          Click image for larger version

Name:	Capture.PNG
Views:	33
Size:	117.1 کلوبائٹ
ID:	12818661
          Counter Attack Pattern Ki Pechan:
          1. Bullish Counter Attack Pattern:
            • Bullish Counter Attack Pattern tab hota hai jab market downtrend mein hota hai aur sudden reversal ke baad price mein achanak tezi se barh jata hai.
            • Is pattern mein, ek bearish candle ke baad ek strong bullish candle aati hai, jiska closing price pehle bearish candle ke opening price se zyada hota hai.
            • Yeh indicate karta hai ke sellers ki dominance kamzor ho rahi hai aur buyers market control mein aa rahe hain.
          2. Bearish Counter Attack Pattern:
            • Bearish Counter Attack Pattern tab hota hai jab market uptrend mein hota hai aur sudden reversal ke baad price mein achanak tezi se giraavat hoti hai.
            • Is pattern mein, ek bullish candle ke baad ek strong bearish candle aati hai, jiska closing price pehle bullish candle ke opening price se kam hota hai.
            • Yeh indicate karta hai ke buyers ki dominance kamzor ho rahi hai aur sellers market control mein aa rahe hain.

          Trading Strategy:

          Counter Attack Pattern ko dekh kar traders ko market ke reversal signals milte hain. Agar aap is pattern ko observe karte hain, toh aapko new positions enter karne ka mauka milta hai, expecting ke market mein trend reversal hone ke chances hain.

          Kuch Ahem Baatein:
          1. Confirmation Aur Dusre Indicators:
            • Counter Attack Pattern ko dekhne ke baad, traders ko confirmatory signals ka intezaar karna chahiye, jaise ke doosre technical indicators ya chart patterns ki taraf se.
          2. Volume Analysis:
            • Volume analysis bhi important hai. Agar reversal ke doran volume tez hoti hai, toh yeh confirmation ko strengthen karta hai.
          3. Risk Management:
            • Har trading decision mein risk management ka tawajju rakhna chahiye. Stop-loss orders ka istemal karna bhi important hai.

          Counter Attack Pattern market sentiment ko represent karta hai aur traders ko potential trend reversal ko identify karne mein madad karta hai. Lekin, hamesha yaad rahe ke kisi bhi indicator ya pattern ka istemal keval ek piece of information hai aur ise doosre confirmatory signals ke saath dekha jana chahiye. Trading mein risk hota hai, isliye savdhaan rahein aur apne trading plan ko discipline ke saath follow karein.

          • #6 Collapse


            "Counter Attack"

            pattern, Forex market mein ek technical analysis pattern hai jo trend reversal ko represent karta hai. Yeh pattern traders ko indicate karta hai ke current trend khatam ho sakta hai aur opposite direction mein naya trend shuru ho sakta hai.
            Click image for larger version

Name:	Capture.PNG
Views:	36
Size:	73.1 کلوبائٹ
ID:	12818733
            Counter Attack Pattern Ka Tareeqa:
            1. Initial Trend (Ibtida'i Trend): Counter Attack pattern ka shuru hamesha kisi pehle ke trend ke saath hota hai. Agar market mein uptrend hai, toh yeh pattern downtrend ki shuruat mein hota hai, aur agar market mein downtrend hai, toh yeh pattern uptrend ki shuruat mein hota hai.
            2. Pullback (Girawat): Initial trend ke against mein ek pullback ya retracement aata hai. Yeh pullback market mein temporary reversal ko darust karta hai.
            3. Counter Attack Candle (Counter Attack Candlestick): Counter Attack pattern ka asal hissa ek particular candlestick hota hai. Yeh candlestick pullback ke doran banti hai aur iski closing price initial trend ki taraf se zyada hoti hai.
            4. Confirmation (Tasdeeq): Counter Attack pattern ki confirmation ke liye traders woh waqt ka intezaar karte hain jab next candlestick bhi initial trend ki taraf se zyada close ho. Yeh do consecutive candlesticks, especially jab yeh strong bullish (uptrend) ya bearish (downtrend) candles hote hain, trend reversal ko tasdeeq karte hain.

            Trading Strategy:
            1. Entry Point: Traders entry point ko determine karte hain jab Counter Attack candlestick aur uske baad wale candlestick dono initial trend ki taraf se zyada close karte hain. Yani ke entry point woh waqt hota hai jab trend reversal ko confirm kiya jaa sakta hai.
            2. Stop Loss: Stop loss order ko set karna important hai taki traders apne positions ko protect kar sakein agar trend reversal confirm nahi hota. Stop loss ko aksar Counter Attack candlestick ke low se thoda sa neeche set kiya jata hai.
            3. Target: Target ko aksar initial trend ki extension ya phir pullback ke high tak set kiya jata hai. Yeh target woh level hota hai jahan traders ko lagta hai ke naya trend shuru ho sakta hai.

            Dhyan Rahe:
            1. Counter Attack pattern sirf ek indicator hai aur isay isolated form mein interpret nahi karna chahiye. Traders ko market context aur aur confirmatory signals ka bhi khayal rakhna zaroori hai.
            2. Risk management hamesha important hai. Position sizing aur stop loss orders ke istemal se traders apne risk ko control mein rakh sakte hain.
            3. Har trading strategy ki tarah, yeh pattern bhi kabhi-kabhi galat ho sakta hai. Is liye, trading decisions ko carefully aur market conditions ke mutabiq lena zaroori hai.

            Counter Attack pattern ka istemal karke traders apne trading strategies ko refine kar sakte hain aur potential trend reversals ko early stage mein identify karke behtar trading opportunities create kar sakte hain.

            • #7 Collapse

              Forex trading mein technical analysis bohat zyada importance rakhta hai, aur is analysis ke zariye traders market ki movements ko samajhne ki koshish karte hain. Candlestick patterns is technical analysis ka aik ahem hissa hain, aur inme se aik pattern jo khas tor par significant hota hai, usay Counter Attack Pattern kaha jata hai. Counter Attack Pattern aik reversal candlestick pattern hota hai jo ke do opposite candlesticks par mushtamil hota hai. Yeh pattern tab banta hai jab market mein ek strong trend chal raha hota hai, lekin phir doosray din ek aisi candlestick banti hai jo pehle din ki candlestick ke against hoti hai. Yeh pattern dikhata hai ke trend mein potentially reversal aane wala hai ya market mein do teams (bulls aur bears) ke darmiyan power struggle ho raha hai.


              Forex market mein Counter Attack Pattern do types ka hota hai:
              1. Bullish Counter Attack Pattern
              2. Bearish Counter Attack Pattern
              Ab hum in dono types ko detail mein discuss karte hain.

              Bullish Counter Attack Pattern
              Bullish Counter Attack Pattern tab banta hai jab market mein downtrend chal raha hota hai. Pehli candlestick ek strong bearish candlestick hoti hai jo ke market ke downtrend ko confirm karti hai. Lekin doosri candlestick, jo ke bullish hoti hai, woh pehli candlestick ke closing price ke qareeb close hoti hai. Yeh pattern is baat ki indication hai ke market mein buying interest barh raha hai aur yeh trend reverse ho sakta hai.

              Structure aur Formation
              1. Pehli Candlestick: Pehli candlestick ek lambi bearish candlestick hoti hai jo ke market ke ongoing downtrend ko represent karti hai. Yeh candlestick demonstrate karti hai ke sellers market ko control kar rahe hain aur price neeche ja rahi hai.
              2. Doosri Candlestick: Doosri candlestick ek lambi bullish candlestick hoti hai jo pehli candlestick ke closing price ke qareeb close hoti hai. Yeh candlestick demonstrate karti hai ke buyers ne control le liya hai aur price ko upar push karne ki koshish kar rahe hain.
              Is pattern ki khas baat yeh hai ke doosri candlestick pehli candlestick ke opening price ke qareeb close hoti hai, jo ke ek significant reversal signal hota hai.

              Bearish Counter Attack Pattern
              Bearish Counter Attack Pattern tab banta hai jab market mein uptrend chal raha hota hai. Pehli candlestick ek strong bullish candlestick hoti hai jo ke market ke uptrend ko confirm karti hai. Lekin doosri candlestick, jo ke bearish hoti hai, woh pehli candlestick ke closing price ke qareeb close hoti hai. Yeh pattern is baat ki indication hai ke market mein selling pressure barh raha hai aur yeh trend reverse ho sakta hai.

              Structure aur Formation
              1. Pehli Candlestick: Pehli candlestick ek lambi bullish candlestick hoti hai jo ke market ke ongoing uptrend ko represent karti hai. Yeh candlestick demonstrate karti hai ke buyers market ko control kar rahe hain aur price upar ja rahi hai.
              2. Doosri Candlestick: Doosri candlestick ek lambi bearish candlestick hoti hai jo pehli candlestick ke closing price ke qareeb close hoti hai. Yeh candlestick demonstrate karti hai ke sellers ne control le liya hai aur price ko neeche push karne ki koshish kar rahe hain.
              Yahan bhi, doosri candlestick pehli candlestick ke opening price ke qareeb close hoti hai, jo ke ek significant reversal signal hota hai.

              Counter Attack Pattern ka Interpretation
              Counter Attack Pattern ka interpretation karte waqt hamesha yeh dekhna chahiye ke yeh pattern kis trend mein ban raha hai. Yeh pattern trend reversal ka signal de sakta hai, lekin isko doosray indicators ke sath dekhna chahiye taake confirmation mil sake.

              1. Market Sentiment ko Samajhna
              Counter Attack Pattern market sentiment ka aik clear signal hota hai. Agar Bullish Counter Attack Pattern ban raha hai, to iska matlab hai ke market mein buyers ne apni taqat dikhani shuru kar di hai aur sellers ka pressure kam ho raha hai. Isi tarah, agar Bearish Counter Attack Pattern ban raha hai, to iska matlab hai ke market mein sellers ne apni taqat dikhani shuru kar di hai aur buyers ka pressure kam ho raha hai.

              2. Trend Reversal ka Signal
              Counter Attack Pattern ko aksar trend reversal ke signal ke tor par dekha jata hai. Lekin yeh zaroori nahi ke har dafa reversal ho. Kabhi kabhi yeh pattern sirf ek temporary pullback ya consolidation ka signal bhi ho sakta hai. Is pattern ko trade karte waqt hamesha doosray confirmation indicators ka istimaal karna chahiye.

              3. Support aur Resistance Levels
              Counter Attack Pattern ko support aur resistance levels ke sath use karna bhi kaafi effective hota hai. Agar yeh pattern kisi significant support level par ban raha hai, to Bullish Counter Attack Pattern ka appearance yeh signal de sakta hai ke market mein bottom form ho chuka hai aur ab reversal ho sakta hai. Isi tarah, agar Bearish Counter Attack Pattern kisi resistance level par ban raha hai, to yeh signal de sakta hai ke market mein top form ho chuka hai aur ab downtrend shuru ho sakta hai.

              Counter Attack Pattern ke Saath Trading Strategies
              Counter Attack Pattern ke sath trading karte waqt kuch important strategies ka dhyan rakhna chahiye. Yeh strategies aapko is pattern ko effectively trade karne mein madad karengi.

              1. Confirmation Candlestick ka Wait karna
              Counter Attack Pattern ko trade karte waqt hamesha agle candlestick ka wait karna chahiye. Yeh agla candlestick confirmation dega ke kya market mein trend reversal hone wala hai ya nahi. Agar Bullish Counter Attack Pattern ke baad ek strong bullish candlestick ban jaye, to yeh signal hai ke market ab upar jayegi. Isi tarah, agar Bearish Counter Attack Pattern ke baad ek strong bearish candlestick ban jaye, to yeh signal hai ke market ab neeche jayegi.

              2. Risk Management
              Forex trading mein risk management bohat zyada important hoti hai. Counter Attack Pattern ko trade karte waqt hamesha stop loss lagana chahiye. Bullish Counter Attack Pattern ke case mein stop loss pehli candlestick ke low ke neeche lagaya ja sakta hai, aur Bearish Counter Attack Pattern ke case mein stop loss pehli candlestick ke high ke upar lagaya ja sakta hai.

              3. Support aur Resistance Levels ka Istimaal
              Support aur resistance levels ke sath Counter Attack Pattern ko trade karna bohat effective hota hai. Agar yeh pattern kisi major support ya resistance level par ban raha ho, to yeh ek strong signal ho sakta hai. Support level par Bullish Counter Attack Pattern ka formation market mein ek strong buying opportunity create kar sakta hai. Isi tarah, resistance level par Bearish Counter Attack Pattern ka formation selling opportunity create kar sakta hai.

              4. Multiple Timeframes ka Analysis
              Agar aap multiple timeframes par Counter Attack Pattern ko observe karte hain, to yeh pattern zyada reliable ho sakta hai. For example, agar aapko daily aur hourly charts dono par Bullish Counter Attack Pattern nazar aata hai, to yeh signal ho sakta hai ke market mein ek significant reversal hone wala hai.

              5. Combination with Other Indicators
              Counter Attack Pattern ko doosray technical indicators ke sath combine karna zaroori hai. Indicators jaise ke Moving Averages, RSI, MACD, etc., aapko additional confirmation denge. Agar Counter Attack Pattern ke sath RSI oversold ya overbought condition mein ho, to yeh signal ho sakta hai ke trend reversal zyada strong hoga.

              Counter Attack Pattern ki Limitations aur Challenges
              Jab bhi aap candlestick patterns use karte hain, to yeh samajhna zaroori hai ke inka asar 100% nahi hota. Counter Attack Pattern ke bhi kuch limitations hain:
              1. False Signals: Counter Attack Pattern kabhi kabhi false signals bhi de sakta hai, especially agar market mein volatility zyada ho ya pattern ke baad confirmation nahi mile. Is wajah se hamesha confirmation indicators ka istimaal karna chahiye.
              2. Market Conditions ka Asar: Yeh pattern har market condition mein kaam nahi karta. Highly volatile markets mein yeh pattern unreliable ho sakta hai, aur isko trade karna mushkil ho jata hai.
              3. Over-reliance ka Risk: Sirf Counter Attack Pattern par rely karna risky ho sakta hai. Isko doosray technical indicators aur market analysis ke sath combine karna chahiye taake zyada accurate trading decisions liye ja saken.
              Counter Attack Pattern ka Comparison Doosray Candlestick Patterns se
              Counter Attack Pattern ko doosray candlestick patterns se compare karna bhi zaroori hai taake aap samajh sakein ke kis situation mein yeh pattern zyada valuable hota hai.

              1. Engulfing Pattern
              Engulfing Pattern aur Counter Attack Pattern mein kuch similarities hain. Engulfing Pattern mein doosri candlestick pehli candlestick ko completely engulf kar leti hai, jabke Counter Attack Pattern mein doosri candlestick pehli candlestick ke closing price ke qareeb close hoti hai. Engulfing Pattern zyada strong reversal signal hota hai, lekin Counter Attack Pattern bhi significant ho sakta hai agar yeh kisi key level par ban raha ho.

              2. Harami Pattern
              Harami Pattern aur Counter Attack Pattern mein bhi kuch similarities hain. Harami Pattern ek inside bar type pattern hai jisme doosri candlestick pehli candlestick ke range ke andar rehti hai. Counter Attack Pattern mein doosri candlestick pehli candlestick ke closing price ke qareeb close hoti hai. Harami Pattern zyada subtle reversal signal hota hai, jabke Counter Attack Pattern zyada prominent signal hota hai.

              3. Piercing Line aur Dark Cloud Cover
              Piercing Line aur Dark Cloud Cover patterns bhi reversal patterns hain jo Counter Attack Pattern ke sath compare kiye ja sakte hain. Piercing Line ek bullish reversal pattern hai jo ke downtrend ke end mein banta hai, aur Dark Cloud Cover ek bearish reversal pattern hai jo ke uptrend ke end mein banta hai. Yeh patterns aur Counter Attack Pattern mein yeh farq hai ke Piercing Line aur Dark Cloud Cover mein doosri candlestick halfway through pehli candlestick ke body mein enter karti hai, jabke Counter Attack Pattern mein doosri candlestick pehli candlestick ke closing price par close hoti hai.


              Counter Attack Pattern Forex trading mein ek significant reversal pattern hai jo ke market ke prevailing trend ke against signal deta hai. Yeh pattern buyers aur sellers ke darmiyan power struggle ko represent karta hai aur is baat ka indication deta hai ke market mein trend reversal aasakta hai. Lekin is pattern ko trade karte waqt confirmation indicators ka istimaal zaroori hota hai taake aap false signals se bacha sakain.

              Is pattern ko effectively trade karne ke liye zaroori hai ke aap isko support aur resistance levels, multiple timeframes, aur doosray technical indicators ke sath combine karen. Is tarah aap market mein better trading decisions le sakte hain aur apne profits ko maximize kar sakte hain. Trading mein success hasil karne ke liye analysis aur sabr bohat zaroori hai, aur Counter Attack Pattern ko samajh kar aap apni trading strategy mein ek valuable tool add kar sakte hain.
               
              Believe in yourself and your abilities. When you fight for your dreams, you can achieve anything.
              • #8 Collapse

                Counter Attack Pattern In Forex

                Introduction

                Counter Attack Pattern aik ahem chart pattern hai jo forex trading mein traders ke liye behad faidamand ho sakta hai. Yeh pattern aksar market mein trend reversal ke doran nazar aata hai. Is pattern ka use karke, traders apni trading strategies ko enhance kar sakte hain aur behterin entry aur exit points identify kar sakte hain.

                Counter Attack Pattern Kya Hai?

                Counter Attack Pattern ek candlestick pattern hai jo do opposite candles se mil kar banta hai. Is pattern mein pehli candle ka color trend ke mutabiq hota hai, jab ke doosri candle ka color pehli candle ke baraks hota hai. Yeh pattern aksar market mein sudden reversal ya strong support ya resistance level par nazar aata hai.

                Counter Attack Pattern Ki Types

                Counter Attack Pattern ki do main types hain: Bullish Counter Attack aur Bearish Counter Attack.
                1. Bullish Counter Attack: Yeh pattern tab banta hai jab market mein pehli bearish candle ke baad ek bullish candle ban jati hai. Yeh bullish candle aksar pehli candle ke closing price ke aas-paas close hoti hai, jo market mein buying pressure ka izhar karti hai. Is pattern se yeh andaza lagaya ja sakta hai ke market mein uptrend start ho sakta hai.
                2. Bearish Counter Attack: Yeh pattern tab banta hai jab market mein pehli bullish candle ke baad ek bearish candle ban jati hai. Yeh bearish candle aksar pehli candle ke closing price ke aas-paas close hoti hai, jo market mein selling pressure ka izhar karti hai. Is pattern se yeh andaza lagaya ja sakta hai ke market mein downtrend shuru ho sakta hai.

                Counter Attack Pattern Ka Use Kaise Karein?

                Counter Attack Pattern ka sahi tor par istimal karne ke liye traders ko kuch key points ko mad e nazar rakhna chahiye.
                1. Trend Ki Pehchan: Yeh pattern aksar trend reversal ke doran nazar aata hai, is liye pehle se chal rahi trend ki pehchan bohot zaroori hai. Agar market downtrend mein hai aur Bullish Counter Attack Pattern banta hai, to yeh is baat ka ishara ho sakta hai ke market uptrend mein convert ho rahi hai.
                2. Support Aur Resistance Levels: Counter Attack Pattern aksar strong support aur resistance levels par banta hai. In levels ko dekhte hue, traders apni positions enter ya exit karne ka faisla le sakte hain.
                3. Confirmation: Sirf Counter Attack Pattern par bharosa karna risky ho sakta hai. Is liye, is pattern ko confirm karne ke liye doosre technical indicators, jaise ke RSI ya Moving Averages ka istimal karna chahiye.

                Conclusion

                Counter Attack Pattern ek powerful tool hai jo traders ko market mein significant trend reversals ko pehchanne mein madad deta hai. Is pattern ka sahi istimal karke, traders apni trading performance ko enhance kar sakte hain. Magar, har pattern ki tarah, Counter Attack Pattern ka bhi istimal carefully aur doosri technical analysis tools ke sath karna chahiye. Sahi knowledge aur practice ke sath, yeh pattern traders ke liye forex market mein kaamyaabi ka zariya ban sakta hai.
                • #9 Collapse

                  **Counter Attack Pattern In Forex**
                  Counter Attack Pattern aik candlestick pattern hai jo Forex trading mein market reversal ya continuation ki nishani hota hai. Yeh pattern do alag alag candlesticks ka combination hota hai, jo traders ko market ke aglay move ke baare mein hints de sakta hai. Yeh pattern bearish aur bullish dono market conditions mein form ho sakta hai, is liye yeh pattern har tarah ke traders ke liye kaafi ahmiyat rakhta hai.

                  ### **Counter Attack Pattern Kya Hai?**

                  Counter Attack Pattern tab form hota hai jab market mein price ek direction mein move kar rahi hoti hai, lekin aglay session mein uss direction ke khilaf ek bara move hota hai. Yeh pattern tab zyada mazid hota hai jab yeh ek strong trend ke baad form hota hai, kyun ke yeh market ke sentiment mein ek dramatic shift ko represent karta hai.

                  ### **Bullish Counter Attack Pattern**

                  Bullish Counter Attack Pattern tab form hota hai jab market mein price pehle gir rahi hoti hai, lekin aglay session mein yeh trend reverse hota hai aur price significant tor pe upar close hoti hai. Is pattern mein pehli candle bearish hoti hai, jo ke market ke giraawat ko represent karti hai, aur doosri candle bullish hoti hai jo ke market mein wapas se kharidari ke rujhan ko darshaati hai. Bullish Counter Attack Pattern often indicate karta hai ke market ab support level pe pohanch chuki hai aur yahan se price mein uchhaal aasakta hai.

                  ### **Bearish Counter Attack Pattern**

                  Bearish Counter Attack Pattern ka mechanism Bullish Counter Attack Pattern jaisa hi hota hai, lekin yeh pattern tab form hota hai jab market mein pehle price barh rahi hoti hai aur phir aglay session mein market ke andar selling pressure dominate karne lagta hai. Pehli candle bullish hoti hai jo ke market ke ooper jane wale trend ko represent karti hai, jab ke doosri candle bearish hoti hai jo ke market mein giraawat ko darshaati hai. Yeh pattern aksar indicate karta hai ke market ab resistance level pe hai aur yahan se price girne ki expect ki ja sakti hai.

                  ### **Counter Attack Pattern Ka Istemaal**

                  Counter Attack Pattern ko samajhna aur uss ka istemaal karna Forex traders ke liye kaafi faidemand ho sakta hai. Yeh pattern aksar market mein reversal ki nishani hota hai, lekin isko doosray technical indicators ke sath combine karke zyada achi tarah samjha ja sakta hai. Jaise ke Moving Averages, RSI (Relative Strength Index), aur MACD (Moving Average Convergence Divergence) jaise indicators ko Counter Attack Pattern ke sath combine karke market ki direction ko confirm karna aur zyada reliable trading decisions lena mumkin hota hai.

                  ### **Risk Management**

                  Har trading strategy ki tarah, Counter Attack Pattern ka istemaal karte hue bhi risk management ka khayal rakhna zaroori hai. Yeh pattern har waqt accurate predictions nahi deta, is liye stop-loss orders lagana aur proper risk-reward ratio maintain karna trading ke liye behad zaroori hai. Agar market expected direction mein move nahi karti, to stop-loss aapko bade nuksan se bacha sakta hai.

                  ### **Conclusion**

                  Counter Attack Pattern ek powerful candlestick pattern hai jo Forex trading mein market ke trend reversal ya continuation ki pehchan mein madad kar sakta hai. Yeh pattern, agar sahi indicators ke sath use kiya jaye, to aapko profitable trading opportunities de sakta hai. Lekin, trading mein hamesha risk involve hota hai, is liye hamesha apni strategy ko test karna aur risk management ka proper khayal rakhna zaroori hai. Forex market mein successful hone ke liye market ki dynamics ko samajhna aur unhein apni trading strategy mein integrate karna behad ahmiyat rakhta hai.
                  • <a href="https://www.instaforex.org/ru/?x=ruforum">InstaForex</a>
                  • #10 Collapse

                    Forex trading mein kayi tarah ke technical patterns use kiye jate hain jo traders ko market ki movement ko samajhne mein madad dete hain. Aise hi ek pattern ka naam hai Counter Attack Pattern. Ye pattern ek candlestick reversal pattern hai jo kisi trend ke khatam hone ka ishara deta hai aur isse pehchankar trader apni strategy ko modify kar sakte hain. Counter Attack Pattern ek reversal candlestick pattern hai jo do opposite candles ka combination hota hai. Yeh pattern tab banata hai jab ek trend (uptrend ya downtrend) apne aakhri hadd tak pohanch chuka ho aur price reversal ke liye tayyar ho. Is pattern ke zariye traders ko indication milti hai ke market ka sentiment shift ho raha hai aur ab market opposite direction mein move karne wali hai. Yani agar market uptrend mein thi, to downtrend mein ja sakti hai, aur agar market downtrend mein thi, to uptrend mein shift ho sakti hai.


                    Counter Attack Pattern ko samajhne ke liye, humein candlestick analysis ko achi tarah samajhna hoga. Yeh pattern do candles se milkar banta hai:
                    1. Pehli Candle: Jo pehle se chalte hue trend ko represent karti hai. Agar market uptrend mein hai, to yeh bullish candle hogi (white ya green). Aur agar market downtrend mein hai, to yeh bearish candle hogi (black ya red).
                    2. Doosri Candle: Jo opposite direction mein close hoti hai lekin uska open price, pehli candle ke close price ke kareeb hota hai. Yeh bullish ya bearish reversal ko indicate karti hai.
                    Counter Attack Pattern Ki Iqsaam
                    Counter Attack Pattern ki do important qisam hain:
                    1. Bullish Counter Attack Pattern: Yeh pattern tab banta hai jab market downtrend mein hota hai aur ek bearish candle ke baad ek strong bullish candle ban jati hai. Yeh bullish candle usually bearish candle ke close ke kareeb open hoti hai aur usi level tak pohanchti hai. Is pattern ka matlab hai ke sellers ka pressure kam ho raha hai aur buyers control le rahe hain. Iska matlab hai ke market reversal ke liye tayaar hai aur uptrend shuru ho sakta hai.
                    2. Bearish Counter Attack Pattern: Yeh pattern tab banta hai jab market uptrend mein hota hai aur ek bullish candle ke baad ek strong bearish candle ban jati hai. Yeh bearish candle bullish candle ke close ke kareeb open hoti hai aur usi level tak close hoti hai. Is pattern ka matlab hota hai ke buyers ka pressure ab khatam ho raha hai aur sellers control le rahe hain. Iska matlab hai ke market reversal ke liye tayaar hai aur downtrend shuru ho sakta hai.
                    Counter Attack Pattern Ke Components
                    1. Market Trend: Yeh pattern tab banta hai jab market mein ek clearly defined trend ho (ya to uptrend ya downtrend). Agar trend pehle se weak ho, to pattern ka asar utna strong nahi hota.
                    2. Candlestick Structure: Do candles ka hona zaroori hai, jisme pehli candle trend ko follow kar rahi hoti hai, aur doosri candle reversal indicate karti hai.
                    3. Opening and Closing Price: Pehli candle ka closing price aur doosri candle ka opening price kareeb hote hain, jo ke market mein uncertainty ya balance shift ko dikhata hai.
                    4. Volume: Agar Counter Attack Pattern ke sath volume kaafi zyada ho, to pattern ki confirmation aur bhi mazid strong ho jati hai.
                    Counter Attack Pattern Ko Kaise Identify Karein
                    Counter Attack Pattern ko identify karna zyadatar visual observation par mabni hota hai. Lekin kuch specific factors hain jo dekhne chahiyein jab yeh pattern ban raha ho:
                    1. Strong Trend: Sabse pehle yeh dekhein ke market mein koi strong trend chal raha ho, chahe wo uptrend ho ya downtrend. Kyun ke yeh pattern trend reversal ko indicate karta hai, isliye pehle se trend ka hona zaroori hai.
                    2. Opposite Candles: Doosra step hai do opposite candles ko observe karna. Pehli candle jo trend ko follow kar rahi hoti hai (agar uptrend hai to bullish candle, agar downtrend hai to bearish candle). Phir dekhein ke doosri candle opposite direction mein close ho rahi hai.
                    3. Opening and Closing Prices: Doosri candle ka opening price pehli candle ke closing price ke kareeb hona chahiye.
                    4. Confirmation: Is pattern ke sath kuch aur confirmation indicators ka istemal karna zaroori hai, jese ke RSI, MACD, ya Moving Averages. Yeh indicators pattern ko aur bhi zyada validate karne mein madad dete hain.
                    Counter Attack Pattern Ko Forex Trading Mein Kaise Use Kiya Jata Hai
                    Forex trading mein Counter Attack Pattern ka istemal karte hue traders apni position ko reverse ya modify karte hain. Chaliye ab hum step-by-step dekhte hain ke kis tarah se is pattern ka practical istemal kiya jata hai.

                    1. Trend Ka Analysis
                    Jab bhi market mein koi strong trend ho, chahe wo uptrend ho ya downtrend, aapko Counter Attack Pattern ko dhundhna hoga. Sabse pehle yeh dekhein ke market kis trend mein hai. Kya market bullish hai ya bearish? Agar market uptrend mein hai, to aapko bearish reversal ke liye tayaar rehna chahiye, aur agar market downtrend mein hai, to bullish reversal ka intezar karein.

                    2. Pattern Ki Pehchan
                    Jab aapne trend identify kar liya, to aap candlestick chart par focus karein aur Counter Attack Pattern ko pehchanne ki koshish karein. Jab pehli candle strong trend ko follow kar rahi ho aur doosri candle uske opposite close ho rahi ho, to yeh ek Counter Attack Pattern ka signal hai.

                    3. Confirmation Indicators Ka Use
                    Sirf candlestick pattern par rely karna thoda risky ho sakta hai. Isliye, kuch aur technical indicators ka istemal karein jese ke Relative Strength Index (RSI), Moving Average Convergence Divergence (MACD), ya Moving Averages. Agar yeh indicators bhi trend reversal ki taraf ishara kar rahe ho, to aapke liye yeh signal strong hota hai ke market ab reverse hone wala hai.

                    4. Trade Ka Decision
                    Agar Bullish Counter Attack Pattern banta hai, to yeh indication hoti hai ke ab downtrend khatam ho raha hai aur buyers control le rahe hain. Aap is waqt long position (buy) open kar sakte hain.

                    Agar Bearish Counter Attack Pattern banta hai, to yeh indication hoti hai ke ab uptrend khatam ho raha hai aur sellers control le rahe hain. Aap is waqt short position (sell) open kar sakte hain.

                    5. Stop Loss Aur Take Profit Ki Strategy
                    Jab aap Counter Attack Pattern ke base par koi trade open karte hain, to aapko zaroori hai ke apni risk management strategy ko madde nazar rakhein. Stop loss ko recent swing high ya low par set karein, aur take profit ka level pehle se defined risk-reward ratio ke mutabiq set karein.

                    Counter Attack Pattern Ki Ahemiyat Aur Limitations
                    Jahan ek taraf Counter Attack Pattern kaafi useful ho sakta hai, wahan iske kuch limitations bhi hain jo samajhna zaroori hai.

                    Ahemiyat
                    1. Clear Trend Reversal: Yeh pattern trend reversal ko kaafi accurately predict karta hai, jo short-term traders ke liye kaafi beneficial hota hai.
                    2. Simple Structure: Yeh pattern visually kaafi simple hota hai, isliye beginners bhi isse easily identify kar sakte hain.
                    3. Market Sentiment Shift: Counter Attack Pattern market ke sentiment mein shift ko indicate karta hai, jo ke buying aur selling decision ke liye ek strong signal hota hai.
                    Limitations
                    1. False Signals: Kabhi kabhi Counter Attack Pattern false signals bhi de sakta hai, khas tor par jab market volatile ho.
                    2. Confirmation Indicators Ka Zaroori Hona: Is pattern ke sath kisi aur indicator ki confirmation lena zaroori hota hai, kyun ke yeh akela kabhi kabhi sufficient nahi hota.
                    3. Short-Term Nature: Yeh pattern zyadatar short-term price movements ke liye kaam karta hai, lekin long-term trend reversal ke liye is pattern par rely karna risky ho sakta hai.


                    Counter Attack Pattern Forex trading mein ek powerful tool ho sakta hai agar sahi tarah se istemal kiya jaye. Yeh trend reversal ko accurately predict karta hai aur aapko market ke movement ke bare mein pehle se indication de sakta hai. Is pattern ko identify karne ke liye aapko market trend ka analysis karna hoga, candlestick patterns ko samajhna hoga, aur kuch aur technical indicators ka bhi istemal karna hoga.

                    Lekin yaad rakhein ke kisi bhi pattern ka use karte waqt aapko apni risk management strategy ko zaroor madde nazar rakhna hoga, aur confirmation indicators ka istemal karna hoga. Forex trading mein kisi bhi strategy ka success, trader ki understanding aur discipline par mabni hota hai. Counter Attack Pattern ko sahi tarah se samajhkar aur istemal karke aap apne trading results ko improve kar sakte hain.
                     
                    Believe in yourself and your abilities. When you fight for your dreams, you can achieve anything.

                    اب آن لائن

                    Working...
                    X