What is the Butterfly candlestick pattern
X
  • وقت
  • دکھائیں
Clear All
new posts
  • #1 Collapse

    What is the Butterfly candlestick pattern
    Butterfly candlestick pattern

    Butterfly candlestick pattern ek technical analysis concept hai jo traders ko market ke potential reversals ya trend changes ko identify karne mein madad karta hai. Yeh pattern harmonics trading theory ka hissa hai aur Fibonacci levels ka use karke market movements ko analyze karta hai.
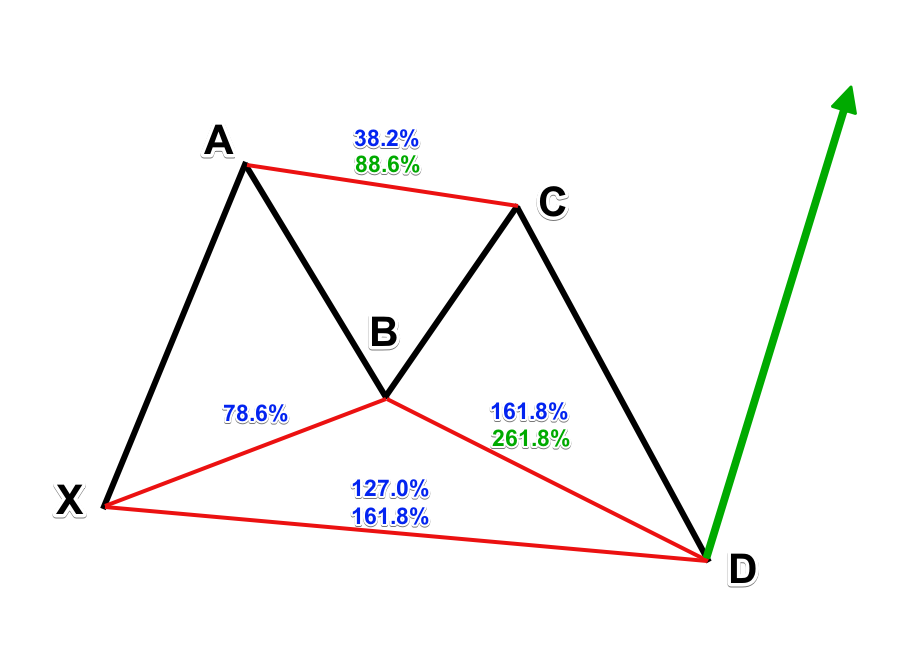
    Butterfly pattern ka formation ABCD structure par mabni hota hai, jismein XA leg, AB leg, BC leg, aur CD leg shamil hote hain. Yeh structure Fibonacci retracement aur extension levels par based hota hai. Har leg specific Fibonacci ratios ka use karte hue calculate ki jati hai.

    XA leg: Yeh market ke initial move ko represent karta hai, jisse X se A tak labeled hota hai.
    AB leg: Yeh XA leg ke opposite direction mein hota hai aur Fibonacci retracement level se related hota hai.
    BC leg: Yeh AB leg ke direction mein hota hai aur Fibonacci extension level se related hota hai.
    CD leg: Yeh BC leg ke opposite direction mein hota hai aur Fibonacci retracement level se related hota hai.
    Butterfly pattern ki pehchan ke liye, traders ko specific Fibonacci ratios ka istemal karna hota hai. ABCD structure mein, commonly istemal hone wale ratios 0.786, 0.618, 1.272, aur 1.618 hote hain.

    Butterfly pattern ka key point yeh hai ke BC leg 0.786 retracement level tak pahunchti hai, aur CD leg 1.618 extension level tak pahunchti hai. Agar yeh conditions meet hoti hain, to butterfly pattern ko confirm karte hain.

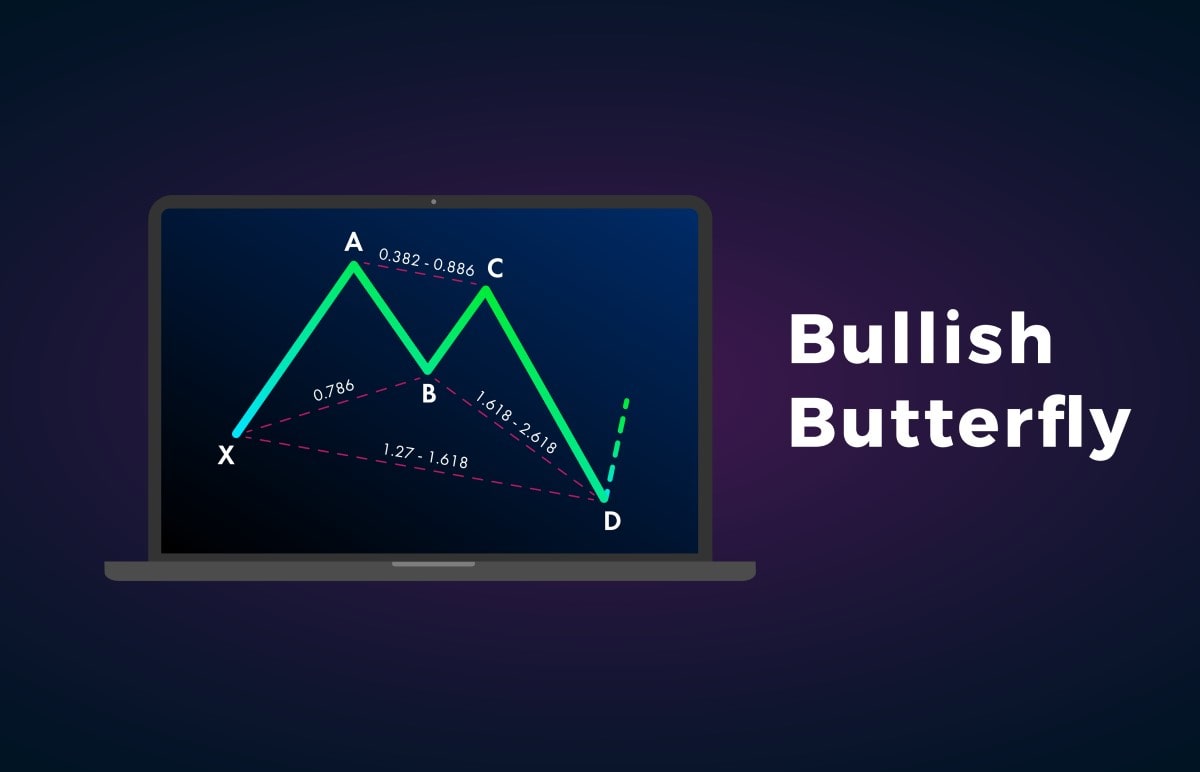
    Jab butterfly pattern complete hota hai, to traders ko price reversal hone ke possibilities ka indication milta hai. Yeh pattern downtrend ke baad bullish reversal aur uptrend ke baad bearish reversal ko indicate kar sakta hai.

    Butterfly pattern trading mein risk management ka bhi ahem hissa hai. Stop-loss orders ka istemal karke traders apne positions ko protect kar sakte hain. Lekin, hamesha yaad rahe ke kisi bhi pattern ya indicator par pura bharosa na karein aur doosre confirmatory signals ka bhi dhyan rakhein.

    Is pattern ko samajhne ke liye traders ko Fibonacci retracement aur extension levels ko samajhna zaroori hai. Butterfly pattern ke istemal mein patience aur discipline bhi zaroori hai, kyun ki market conditions hamesha changing rehti hain.

    In conclusion, butterfly candlestick pattern harmonic trading theory ka ek important part hai jo Fibonacci levels ka use karke market reversals ko predict karne mein madad karta hai. Traders ko is pattern ko samajhne ke liye Fibonacci ratios ka istemal karna sikhna chahiye aur market context ko bhi madde nazar rakhna important hai.
    Click image for larger version

Name:	download.png
Views:	43
Size:	9.7 کلوبائٹ
ID:	12808996
  • <a href="https://www.instaforex.org/ru/?x=ruforum">InstaForex</a>
  • #2 Collapse

    Introduction,

    Dosto umeed Karta hon K ap SAB dost theek hongy our APNA Kam samajhe Dari se Kam ker rahy hon gy to shalty Hai ab ham apny topic ke janib Butterfly candlestick pattern ke bare mein thoda saabqat de sakta hoon. Butterfly pattern ek technical analysis pattern hai, jo market trends ko predict karne ke liye istemal hota hai. Ye pattern usually reversal ko indicate karta hai.

    Butterfly pattern Kia hy ,

    Butterfly pattern mein, price mein ek initial move hota hai, fir ek retracement hoti hai, followed by another move in the original direction. Yeh retracement zone Fibonacci levels ke aas-pass hoti hai, aur pattern completion ke liye specific ratios ko follow karti hai.Is pattern ko samajhne ke liye, aapko candlestick charts aur Fibonacci levels ka istemal karna hoga. Agar aap detailed information chahte hain, toh specific charting platform ya trading resource se aur tafseel hasil ki ja sakti hai.

    Click image for larger version

Name:	images (5).png
Views:	35
Size:	20.8 کلوبائٹ
ID:	12809028

    Pattern Recognition,

    Butterfly pattern ko pehchanne ke liye aapko candlestick charts aur Fibonacci retracement levels ka istemal karna hoga. Pattern ke specific ratios ko samajhna aur recognize karna mahatvapurna hai.

    Entry point,

    Jab aap butterfly pattern ko pehchaan lete hain, toh aap entry points ko identify kar sakte hain. Pattern completion ke baad, reversal hone ki sambhavna hoti hai, aur aap iska istemal trade entry ke liye kar sakte hain.

    Risk management,

    Har trading strategy mein risk management ka khayal rakhna zaroori hai. Stop-loss orders ka istemal karke aap apne trades ko protect kar sakte hain.

    Conformation tool,

    Butterfly pattern ke istemal ko aur bhi mazboot banane ke liye, aap dusre technical indicators aur tools ka istemal bhi kar sakte hain, jaise ki moving averages ya momentum indicators Yaad rahe market mein hamesha risk hota hai aur kisi bhi trading strategy ko istemal karte waqt hoshiyari aur zimmedari baratna zaroori hai. Trading decisions lene se pehle market conditions ko moolya dena important hai.

    Click image for larger version

Name:	images (4).png
Views:	22
Size:	29.1 کلوبائٹ
ID:	12809029
    Summery ,
    Butterfly candlestick pattern ko Forex trading mein istemal karne ka mukhtalif tareeqay ho sakte hain. Yeh pattern market trends mein hone wale reversals ko identify karne mein madad karta hai. Yahan kuch tajaweez hain:


    • #3 Collapse

      What is the butterfly candlestick pattern

      Click image for larger version

Name:	o.jpg
Views:	31
Size:	119.2 کلوبائٹ
ID:	12809032

      Tijarat mein chart patterns ka istemal market ki harkat aur mukhalif mawadat ko samajhne ke liye hota hai, aur butterfly candlestick pattern is tajaweezat mein aik ahem aur makhsoos pattern hai. Ye pattern Fibonacci levels par mabni hota hai aur jab sahi taur par banta hai, to isay market mein hone wale mukhalif mawadat ya tezi ko zahir karne ke liye istemal kya jata hai.


      Butterfly Candlestick Pattern Kya Hai?


      Butterfly candlestick pattern aik technical analysis chart pattern hai jo market mein hone wale potential reversal points ko pehchanne mein madad karta hai. Ye pattern char mukhtalif harkatayon (legs) par mabni hota hai aur jab ye sahi taur par banta hai, to ye aik trend reversal ko zahir kar sakta hai.


      Butterfly Pattern Ki Tafsiliat:
      1. X-A Leg:
        • Ye pehli harkat hoti hai, jisme price aik rukh mein chalti hai, either upar ya neeche.
      2. A-B Leg:
        • A-B leg ek retracement hoti hai X-A leg ki, aksar Fibonacci level 38.2% ya 50% par.
      3. B-C Leg:
        • B-C leg ek mazeed move hoti hai, jo aksar X-A leg ke 78.6% Fibonacci level par hoti hai.
      4. C-D Leg:
        • C-D leg aik aur retracement hoti hai, aksar 78.6% Fibonacci level par, aur is se butterfly pattern complete hojata hai.


      Butterfly pattern ko pehchanne ke liye, tijaratmand Fibonacci ratios ki tafteesh karte hain jo in harkaton ke darmiyan hote hain. Sab se ahem ratio C-D leg ka hota hai, jo ke aksar X-A leg ke 78.6% Fibonacci level par hota hai.


      Butterfly Pattern Ka Tareeqa-e-Kaam:
      1. Pehchan (Identification):
        • Tijaratmand chart par butterfly pattern ki pehchan karte hain jisme ke in char harkaton ke darmiyan sahi Fibonacci ratios hoti hain.
      2. Verification:
        • Once identified, traders verify the pattern by ensuring that the price levels align with the Fibonacci ratios specified for each leg.
      3. Entry Aur Exit Points:
        • Butterfly pattern traders ko potential entry aur exit points dikhata hai. Agar pattern sahi taur par banta hai, to tijaratmand isko istemal karke market mein dakhil ho sakte hain.
      4. Stop Loss Aur Target Levels:
        • Tijaratmand stop loss aur target levels tay karte hain taki unka risk control ho sake aur unko pata chale ke agar pattern ulta ho gaya to unko nuqsaan se bachane ke liye kya karna chahiye.


      Butterfly candlestick pattern ek powerful tool ho sakta hai tijaratmandon ke liye agar sahi taur par samjha jaye aur doosre technical indicators ke saath milake istemal kiya jaye. Hamesha yaad rahe ke har pattern ki tarah, butterfly pattern bhi kisi bhi trading decision se pehle mawafiq analysis aur risk management ke sath istemal karna chahiye.
      • #4 Collapse

        Butterfly candlestick pattern forex trading mein aik advanced chart pattern hota hai jo technical analysis mein use hota hai. Yeh pattern typically reversal points ko identify karne ke liye use hota hai. Butterfly pattern harmonics trading ka aik hissa hota hai aur Gartley pattern ka aik advanced version hai. Yeh pattern specially complex trading strategies mein use hota hai aur beginners ke liye isko samajhna thora challenging ho sakta hai.


        Butterfly Pattern ka Structure
        Butterfly pattern ka structure usually chaar points par based hota hai, jinhein X, A, B, C, aur D se represent kiya jata hai. Is pattern mein 5 segments hotay hain jo is tarah se connect hotay hain: XA, AB, BC, CD, aur AD. Yeh points Fibonacci retracement aur extension levels ke hisaab se form hotay hain.
        1. XA Segment: Yeh pattern ka initial move hota hai. Yeh bullish ya bearish ho sakta hai depending on market condition.
        2. AB Segment: Point A se market retrace hota hai aur point B tak jata hai. Yeh retracement usually 78.6% hota hai XA move ka.
        3. BC Segment: Point B se market ek aur retracement karta hai aur point C tak jata hai. Yeh retracement 38.2% ya 88.6% hota hai AB move ka.
        4. CD Segment: Yeh segment ek extension hota hai BC move ka aur point D tak jata hai. Yeh extension 161.8% ya 224% hota hai BC move ka.
        5. AD Segment: Finally, yeh segment complete hota hai jab market point D se point A ki taraf move karta hai.
        Butterfly Pattern ke Types
        Butterfly pattern ke do types hain: Bullish Butterfly aur Bearish Butterfly. Dono ka structure same hota hai lekin inki direction opposite hoti hai.

        Bullish Butterfly
        Bullish Butterfly pattern typically tab form hota hai jab market ek downtrend mein hota hai aur reversal ka indication deta hai. Is pattern mein XA downtrend hota hai, AB retracement uptrend hota hai, BC retracement downward hota hai, aur CD upward extension hota hai.

        Bearish Butterfly
        Bearish Butterfly pattern tab form hota hai jab market ek uptrend mein hota hai aur reversal ka indication deta hai. Is pattern mein XA uptrend hota hai, AB retracement downward hota hai, BC retracement upward hota hai, aur CD downward extension hota hai.

        Fibonacci Levels aur Butterfly Pattern
        Butterfly pattern ko identify karne ke liye Fibonacci levels ka istimaal hota hai. Yeh levels crucial hain kyunki yeh pattern ke har segment ki measurement aur validation ke liye zaroori hain.
        1. XA Segment: Yeh segment typically kisi significant move ko represent karta hai. Yeh move kabhi bhi aur kahin bhi initiate ho sakta hai.
        2. AB Segment: Point A se point B tak ka move Fibonacci retracement ka 78.6% hona chahiye XA move ka.
        3. BC Segment: Point B se point C tak ka move 38.2% ya 88.6% retracement hona chahiye AB move ka.
        4. CD Segment: Yeh segment Fibonacci extension hota hai BC move ka, jo 161.8% ya 224% hota hai.
        5. AD Segment: Final move typically 127.2% ya 161.8% extension hota hai XA move ka.
        Butterfly Pattern ko Trade Karna
        Butterfly pattern ko trade karne ke liye kuch specific steps follow karne chahiye taake risk management aur profitability ensure ho sake.

        Step 1: Pattern ko Identify Karna
        Sabse pehle trader ko yeh identify karna hota hai ke market mein Butterfly pattern form ho raha hai. Yeh usually complex patterns hotay hain aur inhein manually identify karna mushkil ho sakta hai. Is liye technical analysis tools aur software ka istimaal helpful ho sakta hai.

        Step 2: Fibonacci Levels ko Validate Karna
        Jab pattern identify ho jaye, toh next step yeh hota hai ke Fibonacci levels ko validate kiya jaye. Har segment ka Fibonacci retracement aur extension check karna zaroori hai taake pattern accurate ho.

        Step 3: Entry Point ko Determine Karna
        Entry point typically point D hota hai, jahaan par last leg complete hota hai. Yeh point reversal ka indication hota hai aur yeh best entry point hota hai.

        Step 4: Stop Loss aur Take Profit Levels Set Karna
        Risk management ke liye stop loss aur take profit levels set karna zaroori hota hai. Stop loss ko point X ke thoda niche (bullish pattern ke case mein) ya point X ke thoda upar (bearish pattern ke case mein) set karna chahiye. Take profit levels ko usually Fibonacci levels ke hisaab se set kiya jata hai, jaise ke 38.2%, 61.8%, aur 100% retracement levels.


        Butterfly Pattern ke Advantages
        Butterfly pattern ka aik major advantage yeh hai ke yeh reliable reversal pattern hota hai. Agar accurately identify ho jaye aur sahi tarah se trade kiya jaye, toh yeh profitable trades generate kar sakta hai. Iska doosra advantage yeh hai ke yeh pattern harmonics aur Fibonacci levels ka istimaal karta hai jo ke technical analysis mein effective tools hain.

        Butterfly Pattern ke Disadvantages
        Is pattern ka aik major disadvantage yeh hai ke yeh complex hota hai aur beginners ke liye identify karna mushkil ho sakta hai. Iske alawa, agar Fibonacci levels accurately measure na kiye jayein, toh pattern inaccurate ho sakta hai. Aur kyunki yeh reversal pattern hai, agar market trend strong ho, toh pattern fail bhi ho sakta hai.

        Butterfly candlestick pattern forex trading mein aik advanced aur complex pattern hai jo market reversals ko identify karne ke liye use hota hai. Yeh pattern harmonics aur Fibonacci levels ka istimaal karta hai aur agar accurately identify aur trade kiya jaye, toh profitable trades generate kar sakta hai. Lekin beginners ke liye yeh pattern challenging ho sakta hai is liye technical analysis tools aur software ka istimaal helpful ho sakta hai.

        Is pattern ko trade karte waqt risk management, stop loss, aur take profit levels ko consider karna zaroori hota hai taake losses minimize ho aur profitability ensure ho. Butterfly pattern trading mein ek important tool hai lekin isko samajhne aur effectively use karne ke liye practice aur experience ki zaroorat hoti hai.
        Believe in yourself and your abilities. When you fight for your dreams, you can achieve anything.
        • #5 Collapse

          **Butterfly Candlestick Pattern Kya Hai?**
          Butterfly candlestick pattern forex aur stocks trading mein ek popular technical analysis tool hai jo price action aur market trends ko samajhne mein madad deta hai. Yeh pattern typically reversal patterns ki category mein aata hai aur traders ke liye potential entry aur exit points identify karne mein istemal hota hai.

          Butterfly pattern ek complex pattern hai jo kuch specific candlesticks ke arrangement par based hota hai. Is pattern ko recognize karna traders ke liye zaroori hai taake woh market ki trend changes aur reversals ko anticipate kar sake.

          Is pattern mein typically char main candlesticks hote hain, jo ek specific sequence mein aate hain:

          1. **Swing High:** Pehla candlestick ek uptrend ya downtrend ke baad aata hai aur yeh high point ko indicate karta hai.

          2. **Retracement:** Dusra candlestick price mein ek retracement ya pullback ko dikhata hai, jisse trend ke against movement hota hai.

          3. **Extension:** Teesra candlestick swing high se neeche ya upar move karta hai, indicating potential reversal ki starting point.

          4. **Completion:** Chotha candlestick original swing high level ko dubara touch karta hai ya cross karta hai, confirming pattern completion aur potential reversal ko.

          Butterfly pattern ka naam is liye hai kyunki iski appearance ek butterfly ki wings jaisi hoti hai, jahan retracement aur extension ke movements ko visualize kiya ja sakta hai. Yeh pattern Fibonacci retracement levels aur other technical indicators ke saath combine karke confirm kiya ja sakta hai.

          Traders butterfly pattern ko istemal karte hain taake woh market ke potential reversals ko spot kar sake aur unhe trading strategies mein incorporate kar sake. Is pattern ke istemal se pehle, traders ko thorough market analysis aur pattern recognition ki practice karni chahiye taake unhe false signals se bachaya ja sake.

          Final words mein, Butterfly candlestick pattern ek powerful tool hai jo traders ko market trends aur reversals ko analyze karne mein madad deta hai. Iske istemal se pehle, traders ko pattern ki characteristics ko samajhna zaroori hai aur apni trading strategy ko iske saath align karna chahiye. Is tarah ke technical analysis tools traders ke liye valuable hote hain agar sahi tareeqe se istemal kiye jaye.
          • #6 Collapse

            What is the Butterfly pattern and how does it work?


            ziyada Maroof graph dizaynon se mukhtalif, gartly design sakht febonaci tanasub se kaam karte hain. sab se mashhoor dizaynon mein se aik consowant butter flayi design hai. titlee misalon ke samfony group ka aik tukda hai, jis mein gartly, chimgaadar, kekray, aur pait ke pathon ki disk jaisi mukhtalif trqyat shaamil hain. yeh aik paanch nakati ulta khaka design hai jisay taajiron ke zareya khusoosi imthehaan mein istemaal kya jata hai taakay talaash ke lamhaat ko pehchanney mein madad ki jasakay. yeh aik khaas shakal aur misaal ke har taang ke darmiyan faaslay ke sath aik tabadlah design hai .


            paanch nakati laagat ki taraqqi, jisay baad mein gartly butter flayi design kaha jata hai, brice gamlor ne paaya. kisi bhi soorat mein, tareef abhi naye tareeqa par nahi aayi. beeswin 100 saal ke ekhtataam par khusoosi imthehaan mein kansowant ka tabadlah aam ho gaya. is waqt, gartly ke kaam ko is ke aqeedat mandoon, scot am karni aur liri piswanto ne khatam kya tha aur is mein tarmeem ki thi. aakhri option ne febonaci tanasub ko paish kya, jo kisi ko ziyada durust tareeqay se faisla karne aur laagat mein honay wali paish Raft ko numaya karne ke liye baakhtyar banata hai. herat angaiz febonaci retracemt wali titlee ko piswanto butter flayi kaha jata hai .


            aik nuqta nazar se, butterfly consonant ki misaal aik ulta tabadlah design hai. is ke mukammal honay ke baad, laagat zabardasti badal jati hai aur aik directional drive ( oopar ki screen capture mein niilii lakeer ) banati hai. kisi bhi soorat mein, is soorat mein ke aap duniya bhar mein ziyada nazar atay hain, paros ka ulta design aksar aik barray patteren ke aaghaz ka jhanda lagaata hai .


            How to identify the Butterfly pattern chart pattern


            hamein yeh maloom karna chahiye ke aap dayagram mein butter flayi ki samfony misaal ko kaisay pehchan satke hain. jaisa ke mein ne pehlay tehreer kya tha, yeh misaal chaar lehron se bani hai. un mein se har aik aik dosray se jura sun-hwa hai jaisa ke taraqiyati usoolon ke zareya ishara kya gaya hai. jab bhi aap gartly ke mumkina design ko allag karte hain, har shart ko poora karne ke liye aik point shaamil karen. development score ko paanch fox mantay hue, aap ko yaqeen dilana chahiye ke yeh gartly design aik butter flayi hai aur aykschinjz daakhil karen jaisa ke is tarteeb se ishara kya gaya hai


            Butterfly harmonic pattern history


            hum ahangi ke tabadlay ka tareekhi pas manzar 1935 se shuru hota hai. aik mashhoor market master aur khusoosi muaina car, herald make kanly gartly ne laagat ki sar garmion ke design banaye hain jin ke baray mein unhon ne khufia mulakaton mein tawajah di aur jaanch ki hai. baad mein is ne apni kitaab benefits un di financial exchange mein gartly design ke tabadlay ki hikmat e amli ki tafseel ki tasweer kashi ki, jisay kansowant misalon par parhnay ke aik misali course ke tor par dekha jata hai .


            jaisa ke wahan gartly ke naye qisam ke design dukhaay jatay hain, un ke imtiazi saboot ki tknikin bhi badal jati hain. dealers phir kabhi jismani tor par tosiay le outd ki talaash nahi karte hain phir bhi metatrader aur mukhtalif marahil mein khusoosi markr istemaal karte hain .


            misaal ka khaka drawing chaar paish riftoon par mushtamil hai jo aylyot lehron ki terhan nazar aati hai aur misaal ki tashkeel karti hai. turn foksaiz aur value driving forces ko aam tor par huroof ke sath allag kya jata hai. mutlaq ibtidayi tor par x taang hai, usay ibtidayi marhalay x se tayyar kya gaya hai aur nuqta a ke sath band kya gaya hai, jo poori taraqqi ka sab se qabil zikar ya mutlaq neechay hai. phir, is waqt, section pait ke pathon, bc, aur compact disk ghair mutawaqqa ke rush par aahista aahista zahir hotay hain .

            • <a href="https://www.instaforex.org/ru/?x=ruforum">InstaForex</a>
            • #7 Collapse

              ### Butterfly Candlestick Pattern Kya Hai?
              Butterfly candlestick pattern aik mashhoor technical analysis tool hai jo trading aur investment mein use hota hai. Yeh pattern aik reversal pattern hai jo typically price ke bottom ya top par banta hai. Is pattern ka naam "Butterfly" is liye rakha gaya hai kyunki iska structure aik butterfly jaisa lagta hai.

              #### Pattern Ki Pehchan

              Butterfly pattern ko pehchaanne ke liye chaar main points hote hain:

              1. **X to A Move:** Pehla leg X se A tak hota hai jo ek strong price move ko depict karta hai.
              2. **A to B Retracement:** Dusra leg A se B tak hota hai jo typically 78.6% Fibonacci retracement level tak pohnchta hai.
              3. **B to C Move:** Teesra leg B se C tak hota hai jo 38.2% ya 88.6% Fibonacci retracement ke range mein hota hai.
              4. **C to D Move:** Akhri leg C se D tak hota hai jo 161.8% ya 224% Fibonacci extension ke range mein hota hai. D point pattern ka completion point hota hai aur yahan se price reversal expect hota hai.

              #### Butterfly Pattern Ki Importance

              Butterfly candlestick pattern ko traders is liye pasand karte hain kyunki yeh unhein price reversals ke bare mein early indications deta hai. Is pattern ko identify kar ke, traders apni positions adjust kar sakte hain aur potential profits ko maximize kar sakte hain.

              #### Pattern Ka Use

              Butterfly pattern ko use karne ke liye kuch basic steps follow karni parti hain:

              1. **Pattern Ko Identify Karna:** Pehle chart par Butterfly pattern ko identify karna hota hai. Yeh kaam thoda mushkil ho sakta hai aur practice ke saath easy hota hai.
              2. **Fibonacci Levels Ko Use Karna:** Pattern ko accurately identify karne ke liye Fibonacci retracement aur extension levels ka use kiya jata hai.
              3. **Trade Ka Entry Point:** D point par, jo pattern ka completion point hota hai, yeh trade entry ka best point hota hai. Yahan se price reversal expect hota hai.
              4. **Stop Loss Aur Target Levels:** Stop loss ko thoda D point ke neeche set karte hain aur target levels ko B ya C points ke qareeb rakhte hain.

              #### Conclusion

              Butterfly candlestick pattern aik valuable tool hai jo traders ko price reversals identify karne mein madad deta hai. Is pattern ka sahi tareeke se use karne ke liye practice aur patience zaroori hai. Trading mein successful hone ke liye technical analysis tools, jaise ke Butterfly pattern, ko samajhna aur use karna bohot important hai.

              Yeh pattern un traders ke liye khas tor par useful hai jo swing trading aur day trading mein interested hain. Trading mein risk management aur proper strategy bohot zaroori hoti hai, aur Butterfly pattern ko apni strategy mein include karna aik achha step ho sakta hai.

              اب آن لائن

              Working...
              X