Tweezer Bottom Double Candlestick

No announcement yet.
`
X
  • وقت
  • دکھائیں
Clear All
new posts
  • #16 Collapse

    Tweezer Bottom Double Candlestick kai hai


    Click image for larger version

Name:	download (9).png
Views:	72
Size:	8.1 کلوبائٹ
ID:	12804147

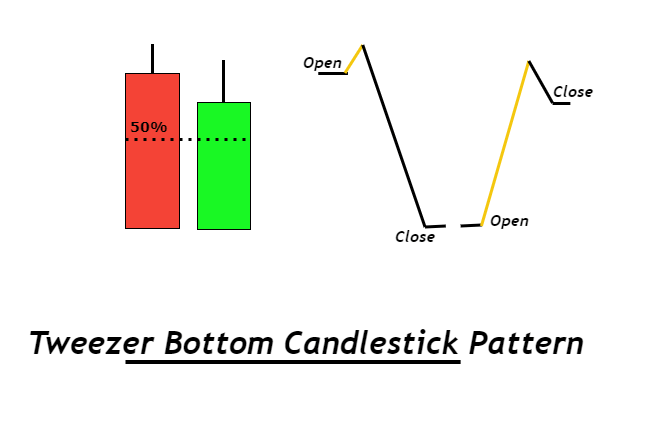
    Tweezer Bottom Double Candlestick Pattern:

    Tweezer Bottom ek bullish reversal candlestick pattern hai jo market mein potential trend change ko indicate karta hai. Yeh pattern downtrend ke baad aata hai aur bullish reversal ko suggest karta hai. Ismein do consecutive candles hote hain, jo ki neeche diye gaye hain:
    1. Pehla Candle (Bearish):
      • Pehla candle downtrend ke dauran aata hai aur ek downward movement ko represent karta hai. Is candle ka closing price neeche hota hai.
    2. Dusra Candle (Bullish):
      • Dusra candle bhi downtrend ke dauran aata hai, lekin iski opening price pehle candle ke closing price ke paas hoti hai ya use neeche hoti hai. Dusra candle bullish hota hai aur upward movement ko represent karta hai. Iski closing price pehle candle ke opening price ke paas ya usse upar hoti hai.

    Key Characteristics of Tweezer Bottom:
    1. Consecutive Candles:
      • Tweezer Bottom pattern mein do consecutive candles hote hain - pehla bearish aur doosra bullish.
    2. Equal or Near Equal Lows:
      • Is pattern mein dono candles ke lows lagbhag barabar hote hain ya phir bahut karib hote hain, jise "equal lows" kehte hain.
    3. Bullish Reversal Signal:
      • Tweezer Bottom pattern bullish reversal ko signal karta hai. Is pattern ke appearance ke baad traders expect karte hain ki market mein trend change hone ke chances hain aur prices mein upar ki taraf movement hone wala hai.
    4. Volume Confirmation:
      • Trading decisions ko aur bhi strong banane ke liye, traders volume ko bhi confirm karte hain. Agar tweezer bottom pattern ke sath achhi trading volume dikhe, toh ye pattern aur bhi powerful ho jata hai.

    Interpretation and Trading Strategies:
    • Tweezer Bottom pattern ke appearance ke baad traders long positions le sakte hain, expecting ki bullish reversal hoga aur prices upar ki taraf jaayenge.
    • Stop-loss orders ko tight rakha jata hai taki nuksan control mein rahe.
    • Target levels ko set karte waqt, traders recent swing highs ya resistance levels ko consider karte hain.

    Limitations of Tweezer Bottom:
    • Jaise ki har technical pattern mein hota hai, tweezer bottom bhi false signals de sakta hai, isliye confirmation ke liye aur indicators ka istemal karna important hai.
    • Market conditions, overall trend, aur doji candlestick ke characteristics ko bhi dhyan mein rakhna important hai.

    Tweezer Bottom ek powerful reversal signal ho sakta hai, lekin traders ko hamesha apne trading plan aur risk management rules ko follow karna chahiye.
    • <a href="https://www.instaforex.org/ru/?x=ruforum">InstaForex</a>
    • #17 Collapse

      Tweezer Bottom Double Candlestick kai hai
      Click image for larger version

Name:	download (10).png
Views:	60
Size:	7.6 کلوبائٹ
ID:	12804150

      Tweezer Bottom Double Candlestick Pattern
      Tweezer Bottom Double Candlestick Pattern ek bullish reversal candlestick pattern hai jo market mein trend reversal ko indicate karta hai. Is pattern mein do consecutive candles hote hain, jinmein pehli candle bearish hoti hai aur dusri candle ise follow karte hue bullish hoti hai.

      Tweezer Bottom Pattern Ki Pehchan:
      1. Pehli Candle (Bearish):
        • Pehli candle downtrend ke doran hoti hai aur iski closing price pehli candle ki opening price se niche hoti hai.
      2. Dusri Candle (Bullish):
        • Dusri candle pehli candle ke baad aati hai aur iski opening price pehli candle ki closing price ke barabar hoti hai ya thodi si upar hoti hai. Dusri candle ki closing price pehli candle ki opening price se upar hoti hai.
      3. Wick Heights:
        • Dono candles ke wicks ya shadows ki heights approximately barabar hoti hain, jisse ye ek level ke support zone ko indicate karta hai.
      4. Size:
        • Tweezer bottom pattern mein dono candles ka size lagbhag barabar hota hai, lekin isme flexibility hoti hai.
      5. Color:
        • Pehli candle ka color typically red (ya black) hota hai, aur dusri candle ka color green (ya white) hota hai, jo bullish movement ko represent karta hai.

      Tweezer Bottom Pattern Ka Arth Aur Trading Strategy:
      1. Bullish Reversal Signal:
        • Tweezer bottom pattern bullish reversal signal deta hai, yani ke ye indicate karta hai ke market mein downtrend ke baad bullish trend start hone ke chances hain.
      2. Support Zone:
        • Is pattern mein dono candles ke wicks ya shadows approximately barabar hote hain, jo ek level ke support zone ko highlight karte hain. Traders is support zone ko consider karke apne trading decisions ko aur bhi strong bana sakte hain.
      3. Confirmation Ke Liye Volume Check Karein:
        • Tweezer bottom pattern ko confirm karne ke liye traders volume analysis ka istemal karte hain. Agar dusri candle ke sath volume bhi badh raha hai, toh ye bullish reversal signal ko aur bhi strong bana deta hai.
      4. Stop Loss Aur Target Levels:
        • Trading decisions lene se pehle stop loss levels aur target levels tay karna important hai. Is pattern ke breakout ya reversal ke baad, traders ko apne positions ke liye sahi risk management ka istemal karna chahiye.
      5. Doosre Indicators Ke Sath Confirm Karein:
        • Tweezer bottom pattern ko confirm karne ke liye doosre technical indicators ka bhi istemal karna important hai. Trend lines, support aur resistance levels, aur doosre candlestick patterns ki tafseel se confirmation hasil ki ja sakti hai.

      Tweezer bottom pattern ka istemal market mein potential trend reversal ko identify karne mein hota hai. Traders is pattern ko doosre technical tools aur market context ke sath combine karke apne trading decisions ko optimize karte hain.
      • #18 Collapse

        Tweezer Bottom Double Candlestick

        Click image for larger version

Name:	download (17).jpeg
Views:	27
Size:	14.1 کلوبائٹ
ID:	12807854


        "Tweezer Bottom" ek double candlestick pattern hai jo market analysis mein istemal hota hai, khaas kar ke Forex trading mein. Yeh pattern downtrend ke baad trend reversal ko suggest karta hai. Isme do consecutive candles shamil hote hain jinhe "tweezer bottom" kaha jata hai.

        Roman Urdu mein, isey is tarah bayan kiya ja sakta hai:

        Tweezer Bottom Double Candlestick:

        "Tweezer Bottom" ek double candlestick pattern hai jo market analysis mein istemal hota hai, khaas kar ke Forex trading mein. Yeh pattern downtrend ke baad trend reversal ko suggest karta hai. Isme do consecutive candles shamil hote hain jinhe "tweezer bottom" kaha jata hai.

        Kaise Recognize Karein:
        1. Dusri Candle Ki Low:
          • Pehli candle bearish (downward) hoti hai aur downtrend ko represent karti hai.
          • Dusri candle bullish (upward) hoti hai aur pehli candle ki low ke near close hoti hai.

        Interpretation (Tawil):
        • Tweezer bottom pattern ko dekh kar traders expect karte hain ke market mein bearish trend khatam ho sakta hai aur bullish trend shuru ho sakta hai.
        • Is pattern ke baad traders long positions le sakte hain, ya existing short positions ko close kar sakte hain.

        "Tweezer Bottom" ek double candlestick pattern hai jo market analysis mein istemal hota hai, khaas kar ke Forex trading mein. Yeh pattern downtrend ke baad trend reversal ko suggest karta hai. Isme do consecutive candles shamil hote hain jinhe "tweezer bottom" kaha jata hai. Is pattern ko dekh kar traders expect karte hain ke market mein bearish trend khatam ho sakta hai aur bullish trend shuru ho sakta hai. Iske baad traders long positions le sakte hain, ya existing short positions ko close kar sakte hain."
         
        Last edited by ; 15-01-2024, 07:20 AM.
        • #19 Collapse

          tweezer bottom double candlestick


          "Tweezer Bottom" forex trading mein aik important double candlestick pattern hai jo market analysis mein istemal hota hai. Ye pattern market mein price reversal ki possibility ko darust karta hai. Chaliye iske baray mein thoda detail se baat karein.

          Tweezer Bottom Double Candlestick Pattern:

          Tweezer Bottom pattern tab banta hai jab do consecutive (sath mein aane wale) candlesticks ek dosre ke neeche similar low prices par close karte hain. Yani ke pehli candlestick ne neeche girne ke baad, doosri candlestick bhi wahi price level touch karti hai ya us se kareeb close hoti hai.

          Is pattern ko "Tweezer Bottom" is liye kaha jata hai kyun ke yeh candlesticks market chart par tweezer (chimti) ki tarah dikhte hain, jahan dono ends barabar hote hain. Yeh pattern market mein bearish trend ke baad hone wale possible reversal ko darust karta hai.

          Key Features:
          1. Do Candlesticks: Tweezer Bottom pattern mein hamesha do candlesticks hote hain. Pehla candlestick downtrend ko darust karta hai aur neeche girne ke baad doosra candlestick usi price level par ya uske kareeb close karta hai.
          2. Similar Lows: Dono candlesticks ka low price aapas mein barabar hota hai ya phir bohot qareeb hota hai, isse ek support level ban jata hai.
          3. Bullish Reversal Signal: Tweezer Bottom pattern bullish reversal signal deta hai, yaani ke is pattern ke appearance ke baad market mein uptrend ka aghaz hone ki ummed hoti hai.

          Tafseelat se Samajhain:

          Agar hum yeh pattern chart par dekhein toh jab bearish trend ke baad do candlesticks similar lows par close karte hain, toh yeh samjha jata hai ke sellers ne control gawara karna band kar diya hai aur buyers market mein taqat hasil kar rahe hain. Is situation mein traders ko lagta hai ke ab market mein bullish momentum shuru ho sakta hai.

          Trading Strategy:

          Tweezer Bottom pattern ko dekhte hue traders ko long position lena ya existing short positions ko close karna ka soch sakte hain. Lekin, jese ke har trading strategy mein, risk management ka khaas khayal rakhna zaroori hai taake nuksan se bacha ja sake.

          In conclusion, Tweezer Bottom double candlestick pattern forex market mein ek aham signal hai jo bearish trend ke baad hone wale bullish reversal ko darust karta hai. Lekin, hamesha yaad rahe ke kisi bhi pattern ya signal par pura bharosa karne se pehle doosre technical tools aur market ki overall situation ko bhi mad e nazar rakha jaye.
           
          • #20 Collapse

            tweezer bottom double candlestick


            "Tweezer Bottom" forex trading mein aik important double candlestick pattern hai jo market analysis mein istemal hota hai. Ye pattern market mein price reversal ki possibility ko darust karta hai. Chaliye iske baray mein thoda detail se baat karein.


            Tweezer Bottom Double Candlestick Pattern:

            Tweezer Bottom pattern tab banta hai jab do consecutive (sath mein aane wale) candlesticks ek dosre ke neeche similar low prices par close karte hain. Yani ke pehli candlestick ne neeche girne ke baad, doosri candlestick bhi wahi price level touch karti hai ya us se kareeb close hoti hai.


            Is pattern ko "Tweezer Bottom" is liye kaha jata hai kyun ke yeh candlesticks market chart par tweezer (chimti) ki tarah dikhte hain, jahan dono ends barabar hote hain. Yeh pattern market mein bearish trend ke baad hone wale possible reversal ko darust karta hai.


            Key Features:
            1. Do Candlesticks: Tweezer Bottom pattern mein hamesha do candlesticks hote hain. Pehla candlestick downtrend ko darust karta hai aur neeche girne ke baad doosra candlestick usi price level par ya uske kareeb close karta hai.
            2. Similar Lows: Dono candlesticks ka low price aapas mein barabar hota hai ya phir bohot qareeb hota hai, isse ek support level ban jata hai.
            3. Bullish Reversal Signal: Tweezer Bottom pattern bullish reversal signal deta hai, yaani ke is pattern ke appearance ke baad market mein uptrend ka aghaz hone ki ummed hoti hai.


            Tafseelat se Samajhain:

            Agar hum yeh pattern chart par dekhein toh jab bearish trend ke baad do candlesticks similar lows par close karte hain, toh yeh samjha jata hai ke sellers ne control gawara karna band kar diya hai aur buyers market mein taqat hasil kar rahe hain. Is situation mein traders ko lagta hai ke ab market mein bullish momentum shuru ho sakta hai.


            Trading Strategy:

            Tweezer Bottom pattern ko dekhte hue traders ko long position lena ya existing short positions ko close karna ka soch sakte hain. Lekin, jese ke har trading strategy mein, risk management ka khaas khayal rakhna zaroori hai taake nuksan se bacha ja sake.


            In conclusion, Tweezer Bottom double candlestick pattern forex market mein ek aham signal hai jo bearish trend ke baad hone wale bullish reversal ko darust karta hai. Lekin, hamesha yaad rahe ke kisi bhi pattern ya signal par pura bharosa karne se pehle doosre technical tools aur market ki overall situation ko bhi mad e nazar rakha jaye.
             
            • #21 Collapse

              "Tweezer Bottom" ek double candlestick pattern hai jo market mein potential trend reversal ko indicate karta hai, specifically downtrend se uptrend ki or. Ye pattern bearish trend ke baad aata hai aur buyers ki strength ko signal karta hai. Yahan is pattern ki kuch key characteristics hain:


              Tweezer Bottom:
              Formation:
              - Tweezer Bottom pattern tab hota hai jab do consecutive candles neechay ki taraf move karte hain, aur dono candles ke low points lagbhag ek doosre ke barabar hote hain.

              Candlestick Shapes:
              - Pehli candle bearish hoti hai, iske baad aati hai ek bullish candle. Dono candles ka size approximately same hota hai. Pehli candle ka low dusri candle ke low ke barabar ya usse thoda upar hota hai.

              Volume:
              - Ideal scenario mein, uptrend ki shuruaat mein volume bhi increase hota hai, indicating buyers ke active hone ki confirmation.

              Signal of Reversal:
              - Tweezer Bottom pattern ek reversal signal provide karta hai, suggesting ki sellers ke control mein tha market, lekin ab buyers ki strength badh rahi hai.

              Confirmation:
              - Confirmation ke liye traders ko next few candles ka price action observe karna chahiye. Agar price continue karke upar ja raha hai, toh Tweezer Bottom ka signal strong hota hai.

              Trading with Tweezer Bottom:
              Entry Point:
              - Entry point Tweezer Bottom ke confirmation ke baad hota hai. Agar next few candles mein uptrend jari hai, toh traders long position le sakte hain.

              Stop-Loss:
              - Stop-loss order ko set karna important hai, usually neeche wale low ke thode se neeche. Isse loss control mein rahega agar reversal galat sabit hota hai.

              Target:
              - Target ko set karne ke liye traders Tweezer Bottom pattern ke height ko measure karte hain aur use entry point se upar add karte hain.

              Important Considerations:
              Confirmation by Volume:
              - Volume ke saath confirmation dekhein, kyunki volume ki increase Tweezer Bottom ke signal ko aur bhi strong banata hai.

              Overall Market Conditions:
              - Pura market context, jaise ki trend direction aur overall market conditions, ko bhi consider karein. Tweezer Bottom ek reversal signal hai, isliye ye strong trend ke opposite mein aata hai.

              Multiple Time Frames:
              - Dusre time frames ko bhi check karein for confirmation. Ek pattern ko confirm karne ke liye multiple time frames ka use karna helpful hota hai.

              Tweezer Bottom pattern ka sahi taur par identify karna aur uske saath trading karna, ek trader ke technical analysis skills aur market understanding par depend karta hai. Is pattern ko sahi taur par interpret karke, aap market ke potential reversal points ko identify kar sakte hain.
              • #22 Collapse

                Tweezer Bottom Double Candlestick

                Tweezer Bottom Double Candlestick Pattern: Ek Mauqifat Bhara Chart Ki Raaz


                Candlestick patterns have been a vital tool in technical analysis for traders and investors. Ek aise candlestick pattern ka jiska naam hai "Tweezer Bottom," jo ke ek tezi se girte hue trend ko indicate karta hai. Yeh pattern do mukhtalif candles se bana hota hai jo market ke mood ka pata lagane mein madad karte hain.

                Tweezer Bottom ek bullish reversal pattern hai jo ke downtrend ke baad aata hai aur uptrend ki shuruaat ko darust karta hai. Is pattern mein do candles hote hain, jo ke ek dusre ke saath milke ek mukhtalif story ke hawale se keh rahe hote hain.

                Pehli candle, jo ke downtrend ke doran ban sakta hai, ek chhota sa red candle hota hai. Is candle se market kaamzor hone ki aur girne ki soorat mein hoti hai. Dusri candle, jo ke iske baad aata hai, ek lamba green candle hota hai jo pehle candle ki low price se shuru hota hai. Yeh dikhaata hai ke sellers ki takat kamzor ho gayi hai aur buyers ne control haasil kiya hai.

                Tweezer Bottom pattern ka asal maza yeh hai ke yeh ek reversal ko indicate karta hai jab market pehle gir raha hota hai. Yeh ek mauqa ho sakta hai jise traders long position le sakte hain, ya existing short positions ko cover kar sakte hain.

                Is pattern ki pehchan karna mushkil nahi hota, lekin iske sahi samajhne ke liye thoda sa practice zaroori hai. Market mein kabhi-kabhi false signals bhi aate hain, isliye yeh zaroori hai ke doosre technical indicators aur analysis tools ka bhi istemaal kiya jaye.

                Ek Tweezer Bottom pattern ke baad, traders ko aur bhi indicators ko madde nazar rakhna chahiye, jaise ke volume analysis, moving averages, aur trend lines. Yeh sabhi tools ek saath istemal hote hain takay trader ko ek sahi aur comprehensive picture mil sake.

                Is pattern ka istemaal karte waqt, risk management bhi ek ahem factor hai. Kabhi-kabhi market mein unexpected movements aajate hain, isliye stop-loss orders ka istemaal karna zaroori hai takay nuksan se bacha ja sake. Traders ko bhi yaad rakhna chahiye ke koi bhi pattern 100% guarantee nahi deta, isliye prudent aur cautious approach rakhna hamesha behtar hota hai.

                Tweezer Bottom double candlestick pattern ek powerful tool hai jo ke market ke mood ka pata lagane mein madad karta hai. Lekin, iske istemaal se pehle, traders ko market ke mizaaj ko samajhne ke liye aur bhi factors ka tajziya karna chahiye. Technical analysis mein maharat hasil karke, traders apne trading decisions ko aur bhi powerful bana sakte hain aur market ke fluctuations ka behtar jawab de sakte hain.


                • #23 Collapse

                  TWEEZER BOTTOM CANDLESTICK PATTERN

                  Tweezer Bottom Candlestick Pattern kya hy:
                  As salam o alaikum dosto, tweezer bottom candlestick pattern 2 days candles by Muzamil Ik bullish trend reversal pattern he jo ki price stand ke bad banta he yah pattern market Mein price ke masjid Bishu Na jaane sy rokane aur bullish trend reversal ka signal Deta He tweezer bottom candlestick pattern Dikhne Mein same matching low Canda Street pattern Jaisa lagta he district pattern Mein first candle Hona Zaruri He Tabhi pattern ke banne ki Piche ki psychology Kuchh Is Tarah Sy Hoti He Ki Jab Bhi price Mein first candle Ik Khas bear is point per closy Ho Jaati He Aur dusre Din Ki candle banne ke bad sym first candles Ke Log ko touch karne ke bad Apar per closy.Hoti He pattern ki donon candles ka open aur closy price Ik dusre sy aap usy direction Mein Hota He.

                  Tweezer Bottom Candlestick Pattern ki pehchan:
                  Hello dear buddies,Tweezer bottom candlestick pattern Ik Friend reversal pattern He Is vajah Sy pattern sy pahle price ka low area strand ka hone bahut zyada zaruri he pattern ki first candle Ik real body wali black candle hoti he jo ke market ke current bearing ya down trend ko jahir Karti He battle Mein Shamil sycond candle Ik real body wali white candle Hoti He pattern ki first Black candle ka real body Hona zaruri he yani open aur closy sym price per Nahin Hona chahie jabki sycond candle ke liye size Ka Hona Zaruri Nahin He pattern Mein candles Shadow Himmat ya Tweezer bottom candlestick pattern Ik Mun Fareed pattern He jismein Shamil candles Ik dusre sy different format visa trend any Bully should be reshoti He pattern low price area stand Mein Banta He Jis ki first candle strong real body Mein banne wali bearing scandal Hoti He sycond Din Ki candle Ik Bulleh scandal Hoti He yah candle first candle ke closy point ke bad open hokar sym log banne ke bad Upar closy Hoti He pattern ki fast aur sycond candle ka Lo Ya closy price sym hone ki vajah sy yah ik strong support level ban jata he.

                  Trading strategy of Tweezer Bottom Candlestick Pattern:
                  Dear forex members,tweezer bottom candlestick pattern price made double bottom pattern banti he Jani price ko 2 dafa same price ya point sy reject Ho Jaati He yah point price ke liye ik strong spot level ka work Karta He Kyunki pattern ki donon candle same point sy reject hoti hen jo ki police trend ki alamat Hoti He tabijer bottom candlestick pattern per trading karne ke liye zaruri he ki price bottom area stand mein ho dusra candles take ke time framing
                  term ki honi chahie Jo kam az kam one day sy zyada.

                  Importance of Tweezer candlestick pattern
                  Dear tweezers bottom candlestick pattern trading sy pahle confirmation candle Ka Hona important he jo ki ik real body wali bullish candle Hoti He Tabhi bottom candlestick pattern ke bad banne wali third bullish scandal per bike entry Karen ya position Zyada Tej buying position Sabhi ho sakte hen tweezer bottom candlestick pattern per top loss ka Lagana zaruri he Kyunki reversal pattern Zyada reliable nahi hote hen top loss pattern ke sabsy bottom position Jo ke donon candles ka support level Banta He isasy Ik Do Peps below position per syt Karen.
                  • #24 Collapse

                    What is Double Candlestick;

                    "Tweezer Bottom" ek double candlestick pattern hai jo marketplace evaluation mein istemal hota hai, khaas karke trend reversal ko darust karne ke liye. Is sample mein do consecutive candles shamil hote hain, jinhe "tweezer backside" kaha jata hai. Yeh pattern market mein potential bullish reversal ko darust karta hai. Isko Roman Urdu mein samajhne ke liye, neeche diye gaye factors par gaur karen:Tweezer Bottom ek aisa pattern hai jo do candles se banta hai. Pehli candle bearish hoti hai, yaani ke commencing rate se remaining charge tak girawat hoti hai. Doosri candle bullish hoti hai, jismein beginning rate se last fee tak izafa hota hai. Dono candles ka low ek doosre ke bohot qareeb hota hai, jise tweezer backside kehte hain.


                    Bottom Aur Support Level:

                    Tweezer Bottom ka istemal trading techniques banane mein kiya ja sakta hai. Agar ye pattern downtrend ke baad aata hai, to buyers isay bullish reversal ka sign samajh kar long positions le sakte hain. Lekin, hamesha yaad rahe ke har method kaam nahi karti har waqt, is liye doosre technical signs aur marketplace analysis tools ka bhi saath lena zaroori hai.Tweezer Bottom ko aur bhi powerful banane ke liye, traders isay market ke important aid ranges ke qareeb paya gaya hona pasand karte hain. Agar yeh pattern aise tiers ke qareeb aata hai, to iska bullish reversal effect aur bhi zyada hota hai. Istemal karne se pehle, danger control ka khaas khayal rakhna zaroori hai. Stop-loss orders ka istemal karke buyers apni positions ko nuksan se bacha sakte hain. Market dynamics hamesha changing hoti hain, is liye threat ko manipulate mein rakhna ahem hai.


                    Market Analysis:

                    Bottom sample ki know-how, buying and selling psychology ko bhi madadgar sabit ho sakti hai. Jab traders ye pattern ko samajhte hain, to unhe market mein hone wale possible changes ka pata chalta hai aur woh apne trading choices ko behtareen taur par cope with kar sakte hain.Tweezer Bottom pattern ki tafseelat ko samajh kar, investors ko market ki average scenario ka pata chalta hai. Tehqiqati maqamat aur market tafseelat ke asoolon ki roshni mein, tweezer backside pattern ki asliyat aur unki ahmiyat ko behtar samajha ja sakta hai.Jo investors ko marketplace ke capability bullish reversals ke baray mein malumat faraham karta hai. In styles ki sahi samajh aur istemal se investors apne trading techniques ko mazbooti se bana sakte hain. Lekin, hamesha yaad rahe ke market dynamic hai aur har strategy har waqt kaam nahi karti. Is liye, doosre technical signs aur evaluation equipment ka bhi saath lena zaroori hai taake trading decisions ko aur behtar banaya ja sake.


                    Bottom Double Candlestick Pattern;

                    Upar diye gaye chart mein aap dekhte hain ki do consecutive candles hain. Pehli candle bearish hai, jabki dusri candle ek hammer ki form mein hai aur aid degree ke neeche ban rahi hai. Yeh Tweezer Bottom Pattern ko darust karta hai. Traders is sample ke saath doosre confirmatory indicators ka bhi intezar karenge, aur agar woh bhi bullish hote hain, toh yeh suggest karega ke fashion reversal hone ke possibilities hain.
                    Har ek trading sample ya indicator ki tarah, Tweezer Bottom Pattern ka bhi istemal samajhdaari aur doosre analysis equipment ke saath milake karna zaroori hai. Is sample ko standalone sign ke roop mein istemal karna hamesha risky ho sakta hai.Tweezer Bottom Double Candlestick Pattern ek technical evaluation device hai jo marketplace mein potential trend reversal ko darust karne ke liye istemal hota hai. Yeh sample do consecutive candles se banta hai, jismein pehli candle bearish hoti hai aur dusri candle bullish hoti hai. Tweezer Bottom ka naam uske form ke liye hai, jo ek hammer ya doji ki tarah hota hai aur ek aid stage ke neeche banata hai.
                    • #25 Collapse

                      Double Candlestick; double candlestick pattern hai jo marketplace evaluation mein istemal hota hai, khaas karke trend reversal ko darust karne ke liye. Is sample mein do consecutive candles shamil hote hain, jinhe "tweezer backside" kaha jata hai. Yeh pattern market mein potential bullish reversal ko darust karta hai. Isko Roman Urdu mein samajhne ke liye, neeche diye gaye factors par gaur karen:Tweezer Bottom ek aisa pattern hai jo do candles se banta hai. Pehli candle bearish hoti hai, yaani ke commencing rate se remaining charge tak girawat hoti hai. Doosri candle bullish hoti hai, jismein beginning rate se last fee tak izafa hota hai.Tweezer bottom double candlestick forex main ek aisi candlestick pattern hai jis mein doosri candle pehli candle ki low se neeche jaati hai. Ye pattern bearish trend ke baad trend reversal ke liye use kiya jaata hai.Trading Strategies:Traders ko yaad rakhna chahiye ke kisi bhi pattern ki tarah, Tweezer Bottom pattern bhi kabhi-kabhi false signals de sakta hai. Is liye, confirmatory signals aur market ki overall situation ka bhi tawajju dena zaroori hai.Tweezer Bottom Double Candlestick Pattern ko dekhte hue traders samajh sakte hain ke downtrend ke baad market mein buyers ki entry ho rahi hai aur possible reversal hone ka chance hai. Is pattern ko confirm karne ke liye, traders ko doosre technical indicators aur confirmatory signals ka bhi tawajju dena chahiye.i. Is pattern ko use karke traders bearish trend ke baad trend reversal ke liye trade kar sakte hai. teaser bottom candlestick pattern ki help se market ke trend ko find karne mein problem Nahin Hoti or maximum senior traders is pattern ko apni trading mein use Kar ke acha profit le rahe hain patterns ki help trading ko continue karne se beneficial results gain hote Hain. indication: Tweezer bottom pattern ke appearance se market mein reversal ki expectation weezer Bottom double candlestick pattern ek powerful tool hai jo ke market ke mood ka pata lagane mein madad karta hai. Lekin, iske istemaal se pehle, traders ko market ke mizaaj ko samajhne ke liye aur bhi factors ka tajziya karna chahiye. Technical analysis mein maharat hasil karke, traders apne trading decisions ko aur bhi powerful bana sakte hain aur market ke fluctuations ka behtar jawab de sakte hain.Tweezer Bottom Double Candlestick Pattern ek technical evaluation device hai jo marketplace mein potential trend reversal ko darust karne ke liye istemal hota hai. Yeh sample do consecutive candles se banta hai, jismein pehli candle bearish hoti hai aur dusri candle bullish hoti hai. Tweezer Bottom ka naam uske form ke liye hai, jo ek hammer ya doji ki tarah hota hai aur ek aid stage ke neeche banata hai.
                      • #26 Collapse

                        Tweezer Bottom Double Candlestick


                        Introduction


                        Tweezer Bottom Double Candlestick

                        ek technical analysis pattern hai jo stock market mein istemal hota hai. Yeh pattern traders ko market ke trend reversal ke signals provide karta hai. Is article mein, hum dekheinge ke Tweezer Bottom kya hai, iski tafseelat kya hain, aur kaise iska istemal karke traders apne tijarat mein faida utha sakte hain.

                        Understanding Tweezer Bottom

                        Tweezer Bottom ek aisa candlestick pattern hai jo market mein bearish trend ke baad hone wale reversal ko darust karti hai. Yeh pattern do candles se bana hota hai, jinmein pehla candle bearish hota hai aur dusra candle bullish hota hai. Dono candles ka low ek doosre ke qareeb hota hai, jisse ek saaf taur par dikhai dene wala bottom pattern ban jata hai.


                        Tweezer Bottom Ka Tijarat Mein Istemal

                        Tweezer Bottom pattern ka sahi taur par istemal karke traders market mein hone wale trend reversal ko pehchan sakte hain. Agar market mein bearish trend chal raha hai aur ek Tweezer Bottom pattern dikhai deta hai, to yeh ishara ho sakta hai ke market mein bullish trend ane wala hai. Is situation mein traders ko apne investments ko adjust karne ka mauka milta hai.

                        Tijarat Mein Tweezer Bottom Ka Istemal Kaise Karein

                        Pattern Ki Pehchan:

                        Pehle to traders ko Tweezer Bottom pattern ko sahi taur par pehchanne ki zarurat hai. Dono candles ka low aapas mein qareeb hona chahiye. Agar aisa hota hai, to yeh ek potential Tweezer Bottom ho sakta hai.

                        Confirmation Ke Liye Intezar:

                        Tweezer Bottom ko dekhte waqt, traders ko confirmation ke liye thoda intezar karna chahiye. Agar agle kuch candles mein bullish movement hoti hai aur market mein uptrend ka signal milta hai, to yeh Tweezer Bottom pattern ki confirmation ho sakti hai.

                        Stop-Loss Ka Istemal:

                        Jaise ke har tijarat mein, risk management bohat zaroori hai. Tweezer Bottom pattern ka istemal karte waqt, traders ko stop-loss ka istemal karna chahiye taake unka nuksan kam ho sake.

                        Target Levels Ka Tey Karna:

                        Traders ko apne trades ke liye target levels tay karna chahiye. Yeh targets unhein guide karte hain ke kab apne positions ko close karna chahiye aur kitna profit ya loss acceptable hai.

                        Tweezer Bottom Aur Market Psychology

                        Tweezer Bottom pattern ka istemal karte waqt, market psychology ko samajhna bhi bohat zaroori hai. Jab yeh pattern dikhai deta hai, to yeh dikhata hai ke market mein sellers ka control kamzor ho raha hai aur buyers ka dabdaba barh raha hai. Is tarah se, traders ko samajh aata hai ke market mein reversal hone wala hai.

                        Conclusion

                        Tweezer Bottom Double Candlestick pattern ek powerful tool ho sakta hai agar ise sahi taur par samjha jaye aur istemal kiya jaye. Is pattern ka tajaweez se istemal traders ko market ke potential reversals ko pehchanne mein madad karta hai. Lekin, hamesha yaad rahe ke koi bhi technical analysis tool 100% guarantee nahi deta aur market mein hamesha risk hota hai. Isliye, saavdhan taur par tijarat karna aur risk management principles ko follow karna bohat zaroori hai.
                        • <a href="https://www.instaforex.org/ru/?x=ruforum">InstaForex</a>
                        • #27 Collapse

                          Tweezer Bottom Double Candlestick kai hai

                          Click image for larger version

Name:	download (41).png
Views:	36
Size:	5.5 کلوبائٹ
ID:	12807500


                          Maazrat kha hoon, lekin mujhe yahan aapko koi tasweer ya image provide nahi kar sakti, kyunki main sirf text-based responses generate kar sakta hoon. Lekin main aapko Tweezer Bottom Double Candlestick pattern ke description se madad kar sakta hoon.

                          Tweezer Bottom Double Candlestick Pattern:

                          Tweezer Bottom ek bullish reversal candlestick pattern hai, jo downtrend ke baad hone wale trend reversal ko indicate karta hai. Is pattern mein do candlesticks hote hain, jinmein se pehla candlestick bearish hota hai (down candle), aur doosra candlestick bullish hota hai (up candle).

                          Characteristics of Tweezer Bottom:
                          1. First Candle (Down Candle):
                            • Pehla candlestick downtrend ke dauran aata hai. Yeh candlestick market mein selling pressure ko represent karta hai.
                          2. Second Candle (Up Candle):
                            • Doosra candlestick, jo ke up candle hota hai, pehle candle ki low se start karta hai aur market mein buying interest ko indicate karta hai. Is candle ka closing price pehle candle ki opening price ke qareeb hota hai.
                          3. Equal or Near Lows:
                            • Tweezer Bottom ka ek important characteristic ye hai ke dono candlesticks ke lows aapas mein equal ya phir bohat qareeb hote hain, jise "tweezer" kehte hain.
                          4. Volume Confirmation:
                            • Ideally, jab Tweezer Bottom pattern form hota hai, toh uske sath zyada volume ki bhi zarurat hoti hai. Agar pattern ke sath zyada volume aa raha hai, toh ye pattern aur bhi reliable ho sakta hai.

                          Tweezer Bottom Trading Strategy:
                          1. Confirmation:
                            • Tweezer Bottom ko confirm karne ke liye, traders doosre technical indicators ka istemal karte hain jese ke RSI, MACD, ya moving averages.
                          2. Entry Point:
                            • Traders Tweezer Bottom ke confirmation ke baad long position le sakte hain, yani ke uptrend mein shamil ho sakte hain.
                          3. Stop-Loss:
                            • Stop-loss order ko thayat di jati hai taki agar reversal galat sabit hota hai, toh nuksan kam ho sake.
                          4. Take-Profit:
                            • Take-profit level ko set kiya jata hai taki jab price uptrend mein badhe, toh trader profit le sake.

                          Caution:
                          • Har ek candlestick pattern ki tarah, Tweezer Bottom bhi 100% confirmatory signal nahi hota. False signals ko avoid karne ke liye, market context, doosre technical indicators aur risk management ka bhi moolya lena chahiye.


                          اب آن لائن

                          Working...
                          X