Bullish Flag Pattern
No announcement yet.
X
  • وقت
  • دکھائیں
Clear All
new posts
  • #1 Collapse

    Bullish Flag Pattern
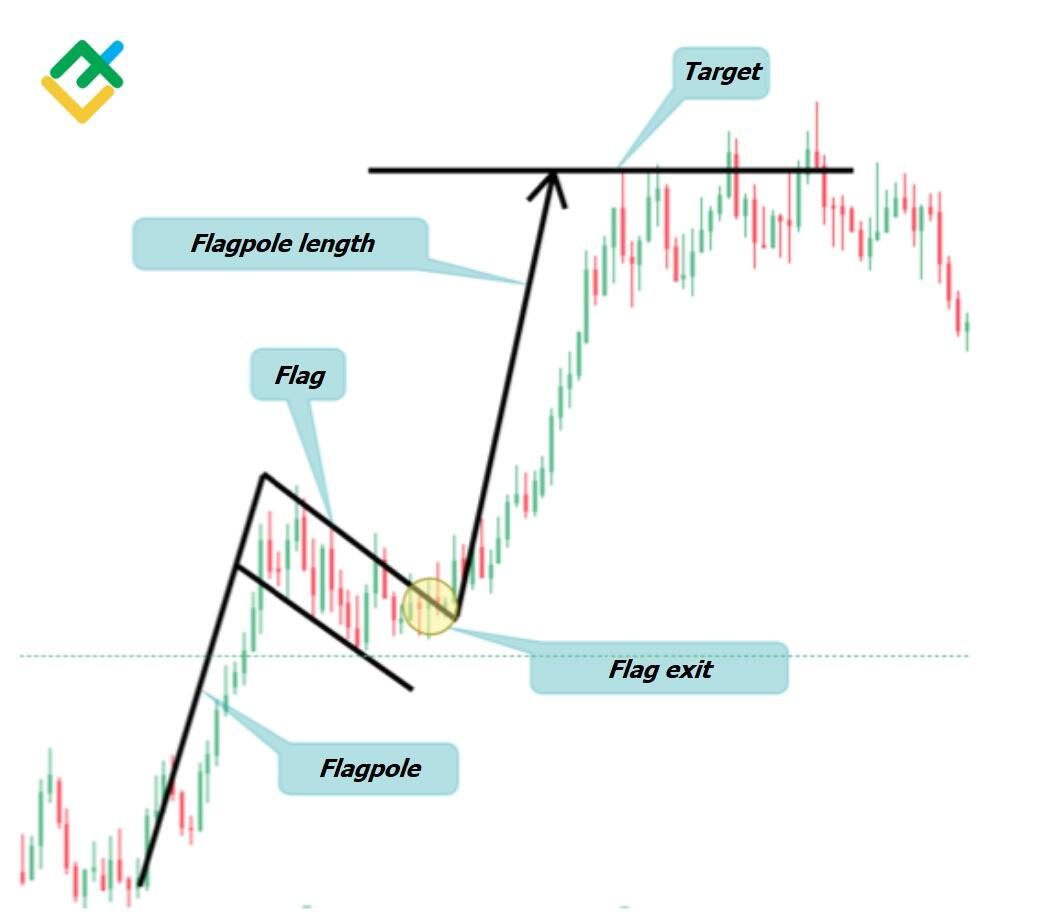
    Bullish Flag Pattern Kia Ha?

    Bullish flag patterns strong uptrends wale forex market mein paye jate hain aur ye continuation patterns consider kiye jate hain. Inhe bull flags isliye kaha jata hai kyunki ye pattern ek pole par flag ki tarah dikhte hain. Pole forex market ki vertical rise ka result hota hai aur flag consolidation period ka result hota hai. Flag ek horizontal rectangle ho sakta hai lekin aksar prevailing trend se alag tarike se downward angled hota hai. Flag ka shape utna important nahi hai jitna pattern ke piche wali psychology hai. Basically, ek strong vertical rally ke bawajood forex market main appreciably drop nahi karta kyunki bulls har share ko acquire kar lete hain. Flag se breakout karne se often ek powerful move higher hota hai, jiska length previous flag pole ka measurement hota hai.

    Click image for larger version  Name:	IMG_20231231_163511.png Views:	0 Size:	56.7 KB ID:	12800265

    Bullish Flag Pattern Identify Karna:

    Bullish flag pattern ko identify karne ke liye aap price chart par ghor se dekhey. Is pattern mein aap ko do cheezein dikhai dengi. Fist ek strong upward movement (pole) aur phir ek consolidation phase (flag). Flag usually ek sideways ya downward movement hota hai. Agar aapko price chart par aise pattern dikhte hain toh ye ek indication ho sakta hai ki forex market ka price phir se upward move karega.

    Bullish Flag Pattern components:

    Bullish flag kay 5 components hain.

    1. Rising Flagpole:

    Yeh ek uptrend line hai jo market ke price ki strong bullish direction ko illustrate karti hai. Isse "flagpole" component of the bull flag bhi kaha jata hai.

    2. Flag:

    Flag ek rectangular ya channel-shaped consolidation area hai jisme price narrow range mein move karta hai. Ye phase market ke bullish activity mein temporary pause ko signify karta hai.

    3. Declining Support Level:

    Yeh ek downtrending support level hai jo swing lows ko connect karta hai. Jab trader bull flag pattern trade karta hai, tab yeh line stop-loss place karne ke liye use hoti hai.

    4. Declining Resistance Level:

    Yeh bull flag ka downtrend resistance level hai jo swing highs ko connect karta hai. Jab price is level se break karke upar badhta hai, tab trader buy order place karta hai. Ye support trendline ke parallel trendline hai.

    5. Price Breakout:

    Price breakout component mein market price pattern ke resistance point se upar badhti hai, sath hi sath bullish volume bhi increase hota hai. Ye bullish flag pattern traders ke liye price entry point mark karta hai.

    Bullish Flag Pattern breakout Identify:

    Bullish flag pattern ka breakout identify karne ke liye aapko price chart ko dekhay. Breakout tab hota hai jab price flag pattern se bahar nikal jata hai aur ek strong upward movement shuru karta hai. Aap breakout ko identify karne ke liye flag pattern ke upper resistance level ko dekheyen. Agar price us level ko cross karke upar badhta hai, toh ye breakout ki indication ho sakti hai.

    Bullish Flag Pattern Failure:

    Bull flag pattern ko "failed bullish flag" ke naam se bhi jana jata hai ye tab hota hai jab bull flag toh ban jata hai magar price mein further higher movement nahi hota hai. Bull flag pattern invalidate ho jata hai aur fail ho jata hai jab asset price upar badhti hai aur breakout entry price se bahar nikal jati hai bullish movement mein, lekin jaldi se resistance area se neeche trend karke pattern ke support level se neeche bearish direction mein girti hai. Failed bull flag ek bearish signal hai.

    Click image for larger version  Name:	IMG_20231231_163426.jpg Views:	0 Size:	30.3 KB ID:	12800266

    Bullish Flage Pattern Example:

    Agar forex market ka price uptrend mein ja raha hai. Fir price ek consolidation phase mein aata hai aur ek flag shape banata hai. Is flag ke andar price range limited hoti hai. Fir ek breakout hota hai aur price upar badhne lagta hai. Yeh breakout entry point hota hai. Jab price breakout ke baad upar badhkar flag pattern ke bahar nikal jata hai, tab traders ko buy signal milta hai. Yeh ek example hai jahan bull flag pattern dekhkar traders entry point aur price target decide kar sakte hain.

    Click image for larger version  Name:	IMG_20231231_163208.jpg Views:	0 Size:	30.9 KB ID:	12800267
  • <a href="https://www.instaforex.org/ru/?x=ruforum">InstaForex</a>
  • #2 Collapse

    Bullish Flag PatteClick image for larger version

Name:	bullish-flag-pattern_body_IDENTIFYINGFLAGOLEpngfull.png
Views:	56
Size:	26.7 کلوبائٹ
ID:	12800290


    Bullish Flag Pattern ek bullish continuation pattern hai, jo market mein uptrend ke doran aata hai. Yeh pattern ek short-term consolidation phase ko represent karta hai, jismein asset ke price mein temporary decline hota hai, lekin overall uptrend continue hota hai.

    Bullish Flag Pattern ki pehchan ke liye kuch key characteristics hain:
    1. Flagpole:
      • Bullish Flag Pattern ka pehla hissa "flagpole" hota hai. Yeh flagpole uptrend ke doran tay hota hai aur jismein price mein tezi hoti hai.
    2. Flag Formation:
      • Flagpole ke baad, ek rectangular-shaped "flag" ban jata hai. Is flag mein price mein consolidation hoti hai, jise "flag" kehte hain.
    3. Sideways Movement:
      • Flag formation ke doran price sideways move karti hai, aur ismein generally price decline bhi hoti hai, lekin overall trend continue rehta hai.
    4. Parallel Trendlines:
      • Flag formation ke dauran, traders parallel trendlines draw karte hain jo flag ke upper aur lower sides ko connect karte hain. Yeh trendlines flag ke structure ko define karte hain.
    5. Decreasing Volume:
      • Flag formation ke dauran volume usually kam hota hai, jo ki indicate karta hai ke market mein interest kam ho gaya hai aur consolidation phase mein hai.
    6. Breakout:
      • Bullish Flag Pattern complete hone ke baad, ek breakout hota hai. Breakout ka matlab hai ke price phir se tezi se badhne lagta hai aur overall uptrend resume hota hai.
    7. Target Calculation:
      • Traders target calculate karte hain jise "flagpole height" se measure kiya ja sakta hai. Flagpole height, flag breakout ke baad ki expected move ko represent karta hai.

    Bullish Flag Pattern ka istemal traders market ke continuation phase ko identify karne ke liye karte hain. Is pattern ko samajhne ke liye, traders ko doosre technical indicators aur market context ko bhi madde nazar rakhna chahiye. Bullish Flag Pattern ki tafsili tajaweezat ko samajh kar traders apne trading decisions mein behtareen hokar is pattern ka faida utha sakte hain.
     
    • #3 Collapse

      Bullish Flag Pattern
      Click image for larger version

Name:	bullish-flag-pattern_body_IDENTIFYINGFLAGOLEpngfull (1).png
Views:	58
Size:	26.7 کلوبائٹ
ID:	12800303


      Bullish Flag Pattern ek technical analysis ka pattern hai jo market mein uptrend ke doran aata hai. Yeh ek continuation pattern hota hai, jise traders uptrend ke baad hone wale further upward movement ko represent karne ke liye dekhte hain.

      Bullish Flag Pattern ka structure typically ek pole aur ek flag se milta hai, aur iski pehchan ke liye kuch key characteristics hain:
      1. Flagpole:
        • Pattern ka shuru hota hai ek strong uptrend ke saath, jo ki "flagpole" kehlata hai. Yeh pole price mein tezi ko represent karta hai.
      2. Flag:
        • Flagpole ke baad, ek rectangle-shaped "flag" banta hai. Is flag mein price mein consolidation hoti hai, lekin overall trend continue rehta hai.
      3. Parallel Trendlines:
        • Flag formation ke doran, traders parallel trendlines draw karte hain jo flag ke upper aur lower sides ko connect karte hain. Yeh trendlines flag ke structure ko define karte hain.
      4. Decreasing Volume:
        • Flag formation ke dauran volume kam hota hai, jo ki indicate karta hai ke market mein interest kam ho gaya hai aur consolidation phase mein hai.
      5. Breakout:
        • Bullish Flag Pattern complete hone ke baad, ek breakout hota hai. Breakout ka matlab hai ke price phir se tezi se badhne lagta hai aur overall uptrend resume hota hai.
      6. Target Calculation:
        • Traders target calculate karte hain jise "flagpole height" se measure kiya ja sakta hai. Flagpole height, flag breakout ke baad ki expected move ko represent karta hai.

      Bullish Flag Pattern ka istemal traders market ke continuation phase ko identify karne ke liye karte hain. Is pattern ko samajhne ke liye, traders ko doosre technical indicators aur market context ko bhi madde nazar rakhna chahiye. Bullish Flag Pattern ki tafsili tajaweezat ko samajh kar traders apne trading decisions mein behtareen hokar is pattern ka faida utha sakte hain.
       
      • #4 Collapse

        Bullish Flag Pattern

        Forex market mein, Bullish Flag Pattern ek aham muhim nishan hai jo uptrend ke doraan nazar aata hai.

        Click image for larger version

Name:	images.jpeg
Views:	40
Size:	37.7 کلوبائٹ
ID:	12811117

        Bullish Flag Pattern Ki Pechan
        Bullish Flag Pattern ka asal pehchan karne ka tariqa yeh hai ke jab market mein tezi hoti hai aur phir thori dair ke liye ruk jaati hai, ek chhota sa flag ban jata hai.

        Alaamat
        Bullish Flag Pattern ki kuch khaas alaamat shamil hain: kamzor giravat, tight trading range, aur ek chhota sa flag shape.

        Trend Aur Volume Ka Taalluq
        Is pattern ki pehchan karne mein trend aur volume ka barabari ka role hota hai. Tezi ke baad jab volume gir jaata hai, aur phir ek flag shape banta hai, to yeh Bullish Flag Pattern hone ki alaamat hai.

        Entry Point Ka Tariqa
        Jab Bullish Flag Pattern nazar aata hai, entry point tajwez kiya jata hai jab market flag ke upper breakout karti hai.

        Nishanat-e-Intikhab
        Bullish Flag Pattern ko pehchanne ke liye sahi nishanat ko intikhab karna zaroori hai, jaise ke tight trading range aur volume ki giravat.

        Maqsad-e-Maarka
        Bullish Flag Pattern ka maqsad uptrend ko confirm karna hota hai aur traders ko sahi waqt par entry point dene mein madad karta hai.

        Risk Aur Reward Ka Tawazun
        Is pattern ko istemal karne se pehle risk aur reward ka tawazun barabar se tajwez kiya jata hai, taake trader mehfooz rahe.

        Real-Time Misraaj
        Bullish Flag Pattern ko samajhna aur uska istemal karne ke liye real-time market analysis ki zarurat hoti hai.

        Istemal Ke Asbab
        Bullish Flag Pattern ka istemal market mein hone wale specific situations mein hota hai, jaise ke trend reversal ya phir consolidation ke baad ki tezi.
        • #5 Collapse


          Bullish Flag Pattern

          Click image for larger version

Name:	download (80).jpeg
Views:	38
Size:	6.3 کلوبائٹ
ID:	12811128


          Bullish Flag Pattern:

          Introduction: Bullish Flag Pattern ek technical analysis ka chart pattern hai jo market mein hone wale potential upward moves ko identify karta hai. Is pattern mein price ek flag ki tarah behave karti hai, jismein pehle ek strong uptrend hota hai, phir ek horizontal consolidation phase aati hai, aur fir market mein ek aur bullish move shuru hota hai.

          Bullish Flag Pattern Ki Tafseel:
          1. Uptrend (Tezi): Bullish Flag Pattern ka pehla hissa hota hai ek strong uptrend. Is phase mein security ki price mein tezi hoti hai, aur investors high buying activity observe karte hain.
          2. Flagpole (Jhanda Ki Sond): Uptrend ke baad aata hai flagpole, jismein security ki price mein tezi hoti hai. Yeh price movement pehle ke uptrend ki continuation ko show karta hai.
          3. Horizontal Consolidation (Flat Flag): Flagpole ke baad, security ki price mein horizontal consolidation ya flat flag ka phase hota hai. Ismein price ek range mein trade karti hai aur volume kam hota hai. Yeh phase market ke participants ke beech uncertainty ko darust karta hai.
          4. Volume Analysis (Hajam Ki Tafteesh): Flagpole ke doran hone wale high volume ke baad, consolidation phase mein volume kam hota hai. Yeh ek sign hai ke market participants cautious hain aur agla move ka intezaar kar rahe hain.
          5. Breakout (Tutna): Jab flat flag complete hoti hai, breakout hota hai. Breakout ek bullish move ko indicate karta hai, jismein security ki price tezi se upar jaati hai. Traders is point par long positions le sakte hain.
          6. Target Price (Maqsad Ki Keemat): Bullish Flag Pattern ke breakout ke baad, traders target price ka estimate kar sakte hain. Iske liye flagpole ko measure karte hain aur use breakout point se add karte hain.

          Sawalat aur Ghor o Fikar:
          1. Kya har Bullish Flag Pattern profitable hota hai?
          2. Volume analysis kyun important hai is pattern mein?
          3. Flagpole ki length ka kya significance hai target price mein?

          Yeh tafseel sa Bullish Flag Pattern ko samajhne mein madadgar ho sakta hai. Technical analysis mein mazeed tajaweez aur tafseelat ke liye, financial experts se mashwara lena mufeed ho sakta hai.
          • #6 Collapse

            Bullish flag pattern

            Click image for larger version

Name:	p.png
Views:	39
Size:	26.7 کلوبائٹ
ID:	12811134

            Bullish flag pattern ek technical analysis ka concept hai jo ke financial markets mein istemal hota hai. Yeh pattern market trends ko samajhne mein aur future price movements ke liye predictions banane mein madad karta hai. Bullish flag pattern, jise "bullish" hone ka matlab hai ke market mein upar ki ore ki movement hone wali hai, ek aham bullish signal ko represent karta hai.


            Bullish Flag Pattern Ki Khasoosiyat:
            1. Pehle Uptrend: Bullish flag pattern tab banta hai jab market mein pehle se hi ek strong uptrend hota hai. Is uptrend ko flagpole kehte hain, jo ke ek tezi se upar ki taraf ki movement ko darust karti hai.
            2. Flag Formation: Flag formation, yaani ke flag ka ban jana, ek makhsoos rectangle shape ko describe karta hai jo flagpole ke baad aata hai. Is flag mein price ek consolidation phase mein chali jati hai, jise lower highs aur higher lows ke series ke zariye dikhaya jata hai. Flag aksar initial uptrend ke opposite direction mein slope karta hai.
            3. Volume: Bullish flag pattern ke dauran ideal taur par trading volume kam hota hai. Yeh kam volume, market mein kam volatility aur consolidation ki nishani hai.
            4. Breakout: Bullish flag pattern ka signal tab hota hai jab price flag pattern ke upper boundary se bahar nikal jati hai. Is breakout ke sath mein volume bhi badh sakta hai, jo ke renewed buying interest ko indicate karta hai.
            5. Target: Bullish flag pattern ka potential target estimate karne ke liye, traders flagpole ki height ko measure karte hain aur use breakout point se project karte hain. Isse unhe idea mil jata hai ke future mein kis level tak price ja sakti hai.


            Bullish flag pattern ka istemal traders aur investors market ke future trends ko samajhne aur profitable trading decisions lene mein karte hain. Is pattern ki samajh se, unhe market mein hone wale potential upar ki ore ki movements ka pata chalta hai. Yeh ek tarah ka technical analysis tool hai jo market participants ko market ke intricacies ko samajhne mein madad karta hai.
            • #7 Collapse

              Bullish Flag Pattern

              Click image for larger version

Name:	download - 2024-01-20T110641.137.png
Views:	36
Size:	8.2 کلوبائٹ
ID:	12811145


              The Bullish Flag pattern is a technical analysis chart pattern that often occurs in financial markets, signaling a potential continuation of an existing uptrend. It is considered a bullish continuation pattern, suggesting that after a brief consolidation period, the previous upward price movement is likely to resume. Here's a detailed explanation of the Bullish Flag pattern:
              1. Identification of the Bullish Flag:
              • Pole (Flagpole): The pattern begins with a strong, upward price movement called the "flagpole." This initial rally represents a sharp and often rapid increase in price.
              • Flag: Following the flagpole, a rectangular or parallelogram-shaped consolidation period forms. This consolidation is referred to as the "flag" and is characterized by lower volatility compared to the initial rally.
              2. Characteristics of the Bullish Flag Pattern:
              • Flag Shape: The flag component typically slopes against the prevailing trend, forming a rectangular shape. This shape signifies a temporary pause or consolidation in the market.
              • Volume Analysis: During the flag formation, trading volumes often decrease, indicating a reduction in market activity. This is a key characteristic of a consolidation phase.
              3. Breakout Confirmation:
              • Breakout Direction: The Bullish Flag pattern is confirmed when the price breaks out of the upper boundary of the flag in the direction of the initial trend (upward).
              • Volume Expansion: An ideal breakout is accompanied by an expansion in trading volume, indicating renewed market interest.
              4. Measuring Price Targets:
              • Flagpole Length: Traders often use the length of the flagpole to estimate potential price targets after the breakout.
              • Projection: The projection is applied from the breakout point to estimate how far the price may move in the continuation of the initial trend.
              5. Trading Strategies with Bullish Flags:
              • Entry: Traders may consider entering a long (buy) position when the price breaks above the upper boundary of the flag.
              • Stop-Loss: Stop-loss orders are typically placed just below the lower boundary of the flag to manage risk.
              • Take-Profit: Potential take-profit levels are often set based on the projected price targets from the flagpole length.
              6. Considerations and Limitations:
              • False Breakouts: As with any chart pattern, false breakouts can occur. Traders should wait for confirmation and consider additional technical analysis tools.
              • Market Conditions: External factors, such as unexpected news events, can influence the reliability of the pattern.
              7. Variations:
              • Pennant Pattern: Similar to the Bullish Flag, the pennant is a small symmetrical triangle that forms after a strong price movement.
              8. Conclusion:
              • The Bullish Flag pattern is a visual representation of a brief consolidation before the resumption of an uptrend.
              • Traders use technical analysis tools and volume indicators to confirm the pattern and make informed trading decisions.

              In summary, the Bullish Flag pattern is a powerful tool for traders who want to identify potential buying opportunities within an existing upward trend. However, like any technical analysis pattern, it should be used in conjunction with other indicators and risk management strategies for more accurate decision-making.


              • #8 Collapse

                Bullish Flag Pattern

                Click image for larger version

Name:	images (1).png
Views:	28
Size:	7.8 کلوبائٹ
ID:	12811152


                The Bullish Flag Pattern is a technical analysis chart pattern that can indicate a continuation of an existing uptrend. It is considered a bullish pattern and is often observed during periods of consolidation within a strong upward price movement. Here's a detailed explanation:

                Bullish Flag Pattern:
                1. Identification:
                  • The Bullish Flag pattern is identified by two main components: a strong and sharp upward price movement (the flagpole) followed by a rectangular-shaped consolidation pattern (the flag).
                2. Flagpole:
                  • The flagpole is the initial part of the pattern and represents a rapid and significant upward price movement. This could be the result of a strong buying interest or positive news affecting the asset.
                3. Flag Formation:
                  • After the sharp rise in prices, the market enters a period of consolidation, forming a rectangular or parallelogram-shaped flag. During this phase, the price may move in a sideways or slightly downward direction, creating a flag-like appearance on the chart.
                4. Volume Analysis:
                  • Typically, during the formation of the flag, trading volume tends to decrease. This signals a temporary pause in the strong buying activity seen during the flagpole phase.
                5. Breakout:
                  • The Bullish Flag pattern is considered complete when the price breaks out of the consolidation phase in the same direction as the original uptrend (to the upside). The breakout is often accompanied by an increase in trading volume, indicating renewed buying interest.
                6. Price Target:
                  • Traders often estimate a price target for the potential upward movement after the breakout. This is calculated by measuring the length of the flagpole and extrapolating that distance from the point of the breakout.
                7. Confirmation:
                  • To confirm the Bullish Flag pattern, traders may look for additional technical indicators or chart patterns, such as positive momentum indicators or bullish candlestick patterns.
                8. Risk Management:
                  • It's crucial for traders to use risk management tools, such as stop-loss orders, to protect against potential false breakouts or sudden reversals.

                The Bullish Flag pattern is considered a continuation pattern, suggesting that after the brief consolidation, the previous uptrend is likely to resume. As with any technical analysis pattern, it's important to consider other factors and use additional analysis tools to make well-informed trading decisions.
                • #9 Collapse


                  1. Bullish Flag Pattern: Ta'aruf (Introduction)


                  Bullish Flag Pattern, forex trading mein aik ahem technical analysis tool hai jo market trends aur reversals ko samajhne mein madadgar sabit ho sakta hai. Yeh pattern market mein aik bullish trend ke doran ban sakta hai aur traders ko indicate karta hai ke market mein mazeed upar ki taraf rawani aane wali hai. Is note mein, hum bullish flag pattern ke ta'aruf aur iska forex trading mein istemal par ghor karenge.
                  1.1 Bullish Flag Pattern Kya Hai?


                  Bullish Flag Pattern ek continuation pattern hai jo market mein aik pre-existing bullish trend ke baad banta hai. Yeh pattern ek rectangle ya flag ki tarah hota hai jise traders market charts par dekhte hain. Flag pole, yaani ke pehli part jo bullish trend ko represent karti hai, ke baad aata hai yeh flag portion. Flag ki formation market ke brief consolidation ya retracement ko darust karti hai.

                  2. Bullish Flag Pattern Ka Tijarat Mein Istemal (Application in Forex Trading):

                  2.1 Bullish Flag Pattern Kaise Kaam Karta Hai?


                  Bullish Flag Pattern ka kaam kuch is tarah hota hai ke jab market mein aik strong bullish trend hoti hai, to uske baad ek brief consolidation period aata hai jise flag kehte hain. Is consolidation ke doran, prices mein kuch girawat hoti hai lekin overall trend bullish rehta hai. Flag pattern ka upper boundary ko resistance aur lower boundary ko support ke tor par istemal kia jata hai.
                  2.2 Trading Strategies with Bullish Flag Pattern:


                  Bullish Flag Pattern ke sath trading karte waqt, traders ko kuch zaruri points ka khayal rakhna chahiye. Pehle toh, jab flag formation hoti hai, traders ko dekhnay chahiye ke volume kitna hai. Agar volume kam hai toh yeh indicate kar sakta hai ke market mein interest kam ho sakta hai. Dusre, traders ko breakout ka wait karna chahiye, yaani ke jab prices upper boundary ko cross karte hain, tab woh long positions le sakte hain. Stop-loss orders ko sahi taur par set karna bhi ahem hai.


                  3. Bullish Flag Pattern Ka Fayda (Benefits of Bullish Flag Pattern):

                  3.1 Trend Continuation Ka Ishara (Signal of Trend Continuation):


                  Bullish Flag Pattern, trend continuation ka acha indicator hai. Yeh pattern dikhata hai ke market mein consolidation ke baad bhi bullish trend jari hai aur traders ko iske mutabiq amal karna chahiye.
                  3.2 Short-Term Trading Opportunities:


                  Bullish Flag Pattern short-term trading opportunities provide karta hai. Traders is pattern ka istemal karke chand dinon ya hafton mein faida utha sakte hain.
                  3.3 Risk Management Ke Sath Istemal (Use with Risk Management):


                  Bullish Flag Pattern ko istemal karte waqt, risk management ka bhi khayal rakhna zaroori hai. Stop-loss orders aur take-profit levels sahi taur par set karna hoshiyari aur suraksha ka zariya hai.


                  4. Bullish Flag Pattern Ke Tijarat Mein Istemal Ke Tips (Tips for Trading with Bullish Flag Pattern):

                  4.1 Confirm with Other Indicators:


                  Bullish Flag Pattern ko confirm karne ke liye, traders ko doosre technical indicators ka bhi istemal karna chahiye. For example, RSI (Relative Strength Index) ya MACD (Moving Average Convergence Divergence) ka istemal karke pattern ki authenticity ko confirm kiya ja sakta hai.
                  4.2 Keep an Eye on Market News:


                  Market mein kisi bhi unexpected news ke aane par, bullish flag pattern ka asar kam ho sakta hai. Isliye, traders ko market news aur economic indicators par bhi tawajjuh dena chahiye.
                  4.3 Demo Trading Mein Practice:


                  New traders ko chahiye ke pehle bullish flag pattern ko demo trading accounts mein practice karein. Isse unko pattern ko samajhne mein aur sahi taur par istemal karne mein madad milegi.


                  5. Ikhtitam (Conclusion):


                  Bullish Flag Pattern, forex trading mein ek aham technical analysis tool hai jo traders ko market trends ke bare mein malumat farahem karta hai. Is pattern ka sahi taur par istemal karke, traders short-term gains haasil kar sakte hain. Lekin, hamesha yaad rahe ke har tijarat mein khatra hota hai, isliye hoshiyari aur risk management ko baratna chahiye. Bullish flag pattern ke sath saavdhanai aur tawajjuh se trading karne se traders apni tijarat mein behtari haasil kar sakte hain.


                  • <a href="https://www.instaforex.org/ru/?x=ruforum">InstaForex</a>
                  • #10 Collapse

                    Bullish flag pattern ko samajhne ke liye pehle hume stock market aur technical analysis ke basic concepts ko samajhna zaroori hai. Stock market mein, bullish flag pattern ek trend continuation pattern hota hai jo ke uptrend ke doran aksar dekha jata hai. Is pattern ko samajhne ke liye, hume pehle price action aur chart analysis ke mool tajurbe ki samajh honi chahiye.
                    Click image for larger version

Name:	bullish-flag-pattern_body_2019_10_28_10_31_00_John_J_Murphy_Technical_An.png
Views:	15
Size:	11.1 کلوبائٹ
ID:	12824694


                    Bullish Flag Pattern
                    Bullish flag pattern ek bullish trend ke doran ek short-term consolidation phase ko darust karta hai. Ye pattern typically ek flag jaisa dikhta hai jisme price ek chhoti si range mein move karta hai, jo ke ek bullish move ke baad hota hai. Is pattern ko dekhte hue, traders ki ummed hoti hai ke price phir se upar ki taraf move karega.

                    Components of Bullish Flag Pattern
                    Bullish flag pattern ko samajhne ke liye kuch mukhya components hote hain:
                    • Uptrend: Bullish flag pattern ek uptrend ke doran develop hota hai. Yeh ek bullish move ko reflect karta hai jisme price higher highs aur higher lows banata hai.
                    • Flagpole:Flagpole ek long, steep move hota hai jo ki uptrend ke doran ban jata hai. Yeh flag pattern ki starting point hoti hai aur isme price mein tezi se izafa hota hai.
                    • Flag:Flagpole ke baad, ek chhoti si consolidation phase hoti hai jise flag kehte hain. Is phase mein price usually sideways move karta hai ya phir thoda sa neeche ja sakta hai, lekin overall trend bullish rehta hai.
                    • Volume: Volume bhi ek important factor hai bullish flag pattern ke analysis mein. Typically, jab price flagpole banata hai, toh volume bhi zyada hota hai. Jab flag formation hoti hai, volume usually kam hota hai, indicating consolidation.

                    Bullish Flag Pattern ka Formation
                    Bullish flag pattern formation ke dauran, price ek sharp move ke baad consolidate hota hai, jo ek flag shape banata hai chart par. Yeh consolidation phase price mein sideways movement ko aur kisi tarah ki direction ko indicate karta hai. Is phase ke doran, volume usually kam hota hai aur traders wait karte hain ke price phir se upar ki taraf move karega.
                    Click image for larger version

Name:	images (28).png
Views:	17
Size:	4.5 کلوبائٹ
ID:	12824695


                    Entry aur Exit Points
                    Bullish flag pattern ko trade karne ke liye, traders ko entry aur exit points ko identify karna zaroori hai. Entry point typically flag breakout ke baad hota hai. Jab price flag ke upper trendline ko break karta hai aur volume bhi badh jata hai, tab traders long positions enter karte hain. Stop-loss orders usually flag pattern ke lower trendline ke neeche lagaye jate hain taake agar price opposite direction mein move karta hai, toh trader ki loss minimize ho sake.

                    Exit point typically determined hota hai by measuring flagpole's length aur usko flag breakout point par add karke. Yeh target price hota hai jise traders expect karte hain ke price achieve karega.

                    Example of Bullish Flag Pattern
                    Maan lijiye, ek stock XYZ $50 se $70 tak ka move karta hai, phir ek flag pattern form karta hai jisme price $65 par consolidate hota hai. Jab price $65 ke upar break karta hai aur volume bhi increase hota hai, traders long positions enter karte hain. Agar flagpole ka length $20 tha, toh traders expect karenge ke price $85 tak move karega.

                    اب آن لائن

                    Working...
                    X