Dark cloud candlestick chart Pattern
X
  • وقت
  • دکھائیں
Clear All
new posts
  • #1 Collapse

    Dark cloud candlestick chart Pattern


    Dark Cloud Candlestick Chart Pattern ki Wazahat:

    1. Mabadi (Basics):


    Dark Cloud Cover, ya aam taur par "Dark Cloud" ke naam se jana jane wala pattern, ek bearish reversal signal hai jo candlestick charts mein paaya jaata hai.

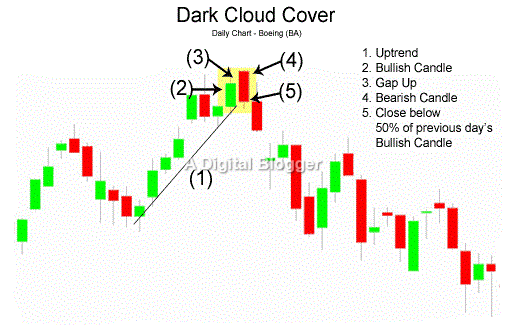
    2. Components (Hissaat) of the Pattern:
    • Pehli Candle: Yeh ek uptrend mein dikhai deti hai aur typically bullish (green ya white) hoti hai. Iski close price pe ooncha hota hai.
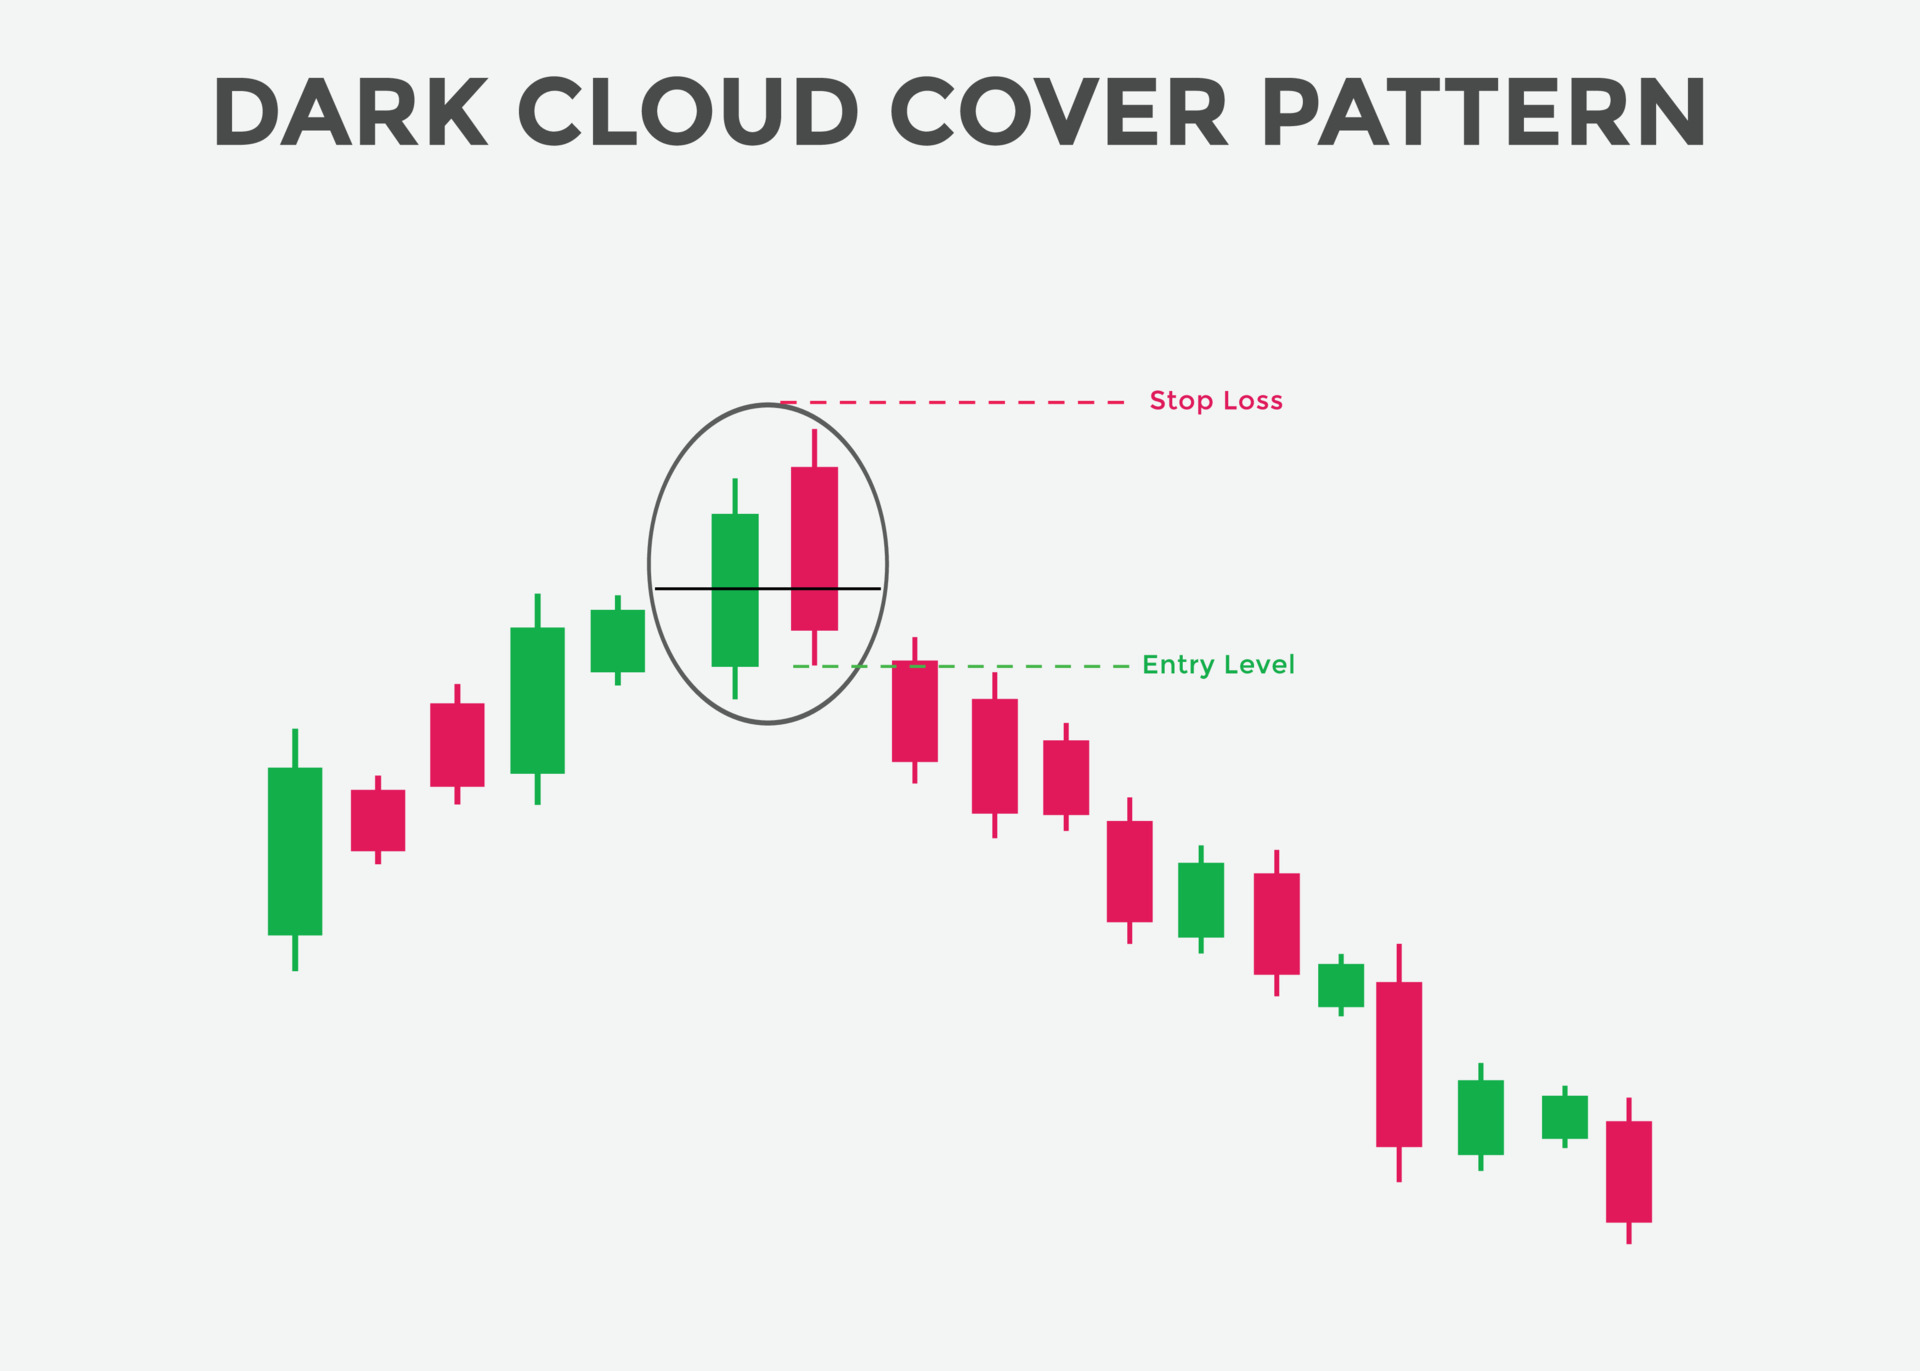
    • Dusri Candle: Ismein price gap up ke baad open hoti hai, lekin day ke dauran price neeche ki taraf move karti hai. Dusra candle pehle wale bullish candle ko partially ya poora cover karti hai.

    3. Interpretation (Tawil):

    Dark Cloud Cover pattern ka matlab hota hai ke current uptrend mein exhaustion (thakan) dikh rahi hai aur bearish trend ka chance hai. Is pattern ko dekh kar traders bearish positions consider kar sakte hain.

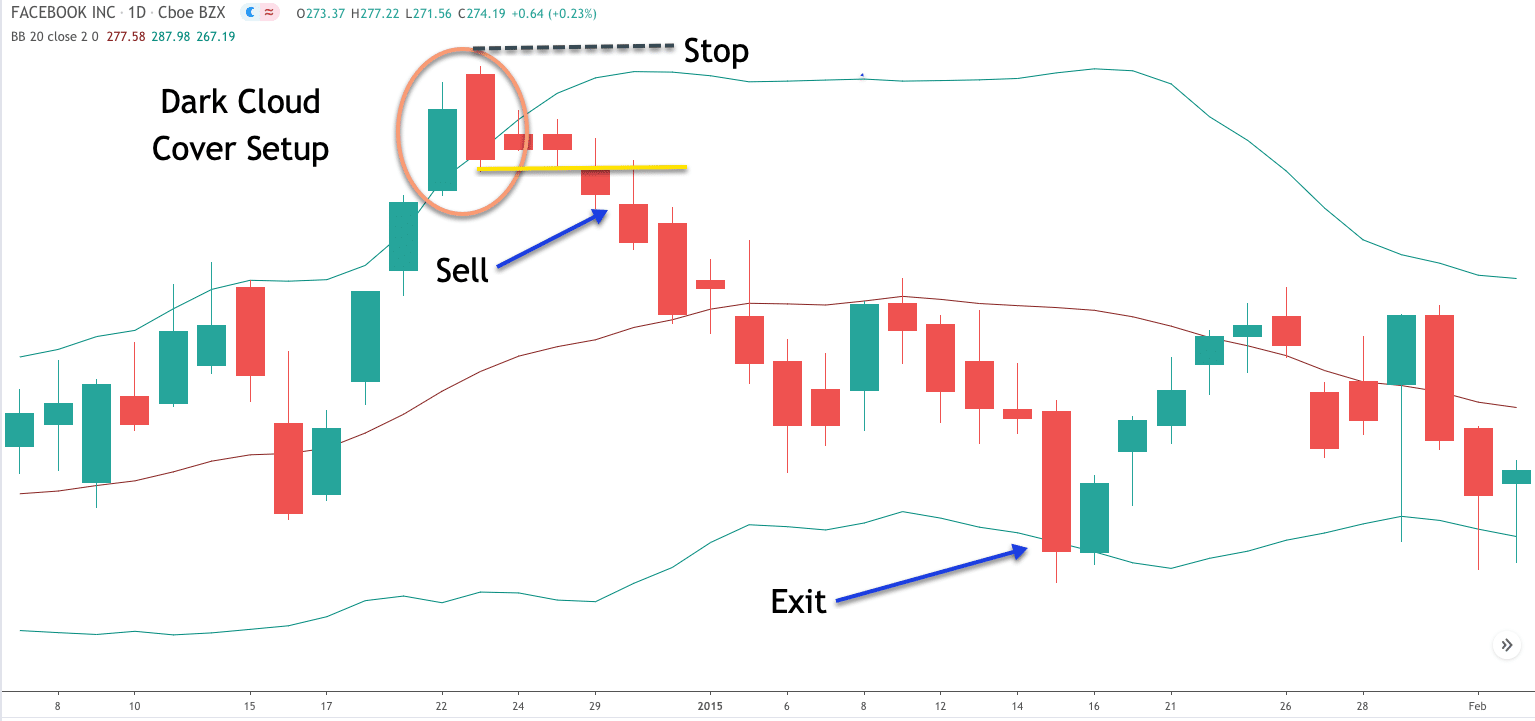
    4. Trading Implications (Karobar Ke Asraat):
    • Entry: Agar aap Dark Cloud pattern ko identify karte hain, toh aapko selling ya short positions enter karne ka signal milta hai.
    • Stop Loss: Protective stop loss ko set karne ke liye aap dusri candle ki high ya pattern ke end ki taraf ek level decide kar sakte hain.
    • Target Price: Aap target price ke liye pehle support level ya recent lows ko dekh sakte hain.

    5. Precautions (Ehtiyaat):
    • Hamesha ek confirmatory signal ka wait karein, jaise ki ek aur bearish candle ya kisi aur technical indicator ka confirmation.
    • Always risk management ke principles ko follow karein.

    6. Conclusion (Ikhtetaam):

    Dark Cloud Cover pattern, agar sahi dhang se identify kiya jaye, ek mazboot bearish reversal signal provide karta hai. Lekin, jaise ki har trading strategy ya pattern ke saath hota hai, iska bhi sahi dhang se istemal aur risk management ke saath trading karna zaroori hai.


    https://www.google.com/imgres?imgurl...sQMygCegQIARBV
    Last edited by ; 28-12-2023, 05:55 PM.
  • <a href="https://www.instaforex.org/ru/?x=ruforum">InstaForex</a>
  • #2 Collapse

    Assalamu Alaikum Dosto!

    Dark Cloud Cover Pattern


    Dark cloud cover pattern aik Japanese candlestick pattern hai jo forex traders istemal karte hain taak bearish reversals market mein pehchan saken. Ye pattern kaafi aasan hai pehchanna aur samajhna. Jab traders ise dekhte hain, to wo is pattern ko ek signal ke taur par istemal karte hain taak short positions mein dakhil ho saken ya shayad long positions se nikal saken. Lekin is pattern ko akela dekhna behtar nahi hota. Is se pehle doosre technical signals, jaise oscillators par divergence, ya pattern ko resistance area mein ban rahe dekha jaye to tab action lene se pehle confirmation lena behtar hai. Jab kaafi saboot mojud hota hai, to is pattern se bearish trade karna aasaan ho jata hai.

    Pattern Identification


    Dark Cloud Cover ek bearish two-candlestick pattern hai jisme pehli candle ek badi bullish range hoti hai. Uske baad ek bearish dusri candle aati hai jo apni opening par upar ki taraf gap karti hai, lekin pehli candle ki price range ke lower half mein band hoti hai.
    Technical traders Dark Cloud Cover pattern ka istemal ek potential correction ki shuruaat ki taraf ishara dene ke liye karte hain. Agar ise sahi se pehchana jaye to crypto traders long trades se bahar nikalne ya short positions mein dakhil hone ke liye is signal ka istemal kar sakte hain.
    Dark Cloud Cover pattern do opposite candlesticks ki tarah dikhta hai, ek bada green bullish candle pehle aata hai phir ek bada red candle aata hai. Green candle dwara ki gayi zyada price action ko poori tarah se kam kar diya jata hai.
    Is price action se yeh pata chalta hai ki pehle to buyers control me hain, lekin phir sellers interfere karte hain aur ki gayi progress ko kafi had tak wapas le lete hain.
    In do candlesticks ka net asar hota hai ki kafi buying power istemal hoti hai, lekin sirf price ko thoda upar le jane ke liye. Buyers momentum khote ja rahe hain, aur market aur consolidation ya phir outright reversal ke khatre mein hota hai.
    Dark Cloud Cover candlestick pattern sabhi markets mein paya ja sakta hai, lekin ye crypto charts par reversals pe pehchanne mein khasi madadgar hota hai. Iske alawa, is candlestick formation ko sabhi chart time frames par dekha ja sakta hai.

    Pattern Formation


    Do-candle Dark Cloud Cover pattern ka structure kaafi simple hai.
    • Average bullish green candle se bada hona chahiye.
    • Dusri candle ke open par upar ki taraf gap hona chahiye.
    • Dusri candle ek large bearish red candle hona chahiye jo pehli candle ki kam se kam 50% price range ko wapas le.


    Pehli candle ek bullish green candle hoti hai jiski price range chart par average candle se zyada hoti hai. Iska setup is pattern ke liye ahem hai, kyun ki ye market mein zyada buying interest ko darust karti hai.
    Dusri candle apni opening par upar ki taraf gap karti hai, phir kam karke pehli candle ke body (previous candle) ke lower half mein band hoti hai. Is price action se ye sanket milta hai ki ek exhaustive bullish move hai, kyun ki price jaldi wapas le jati hai.
    Adhik aggressive traders agli candle ke open par short trade kholne ka vichar kar sakte hain. Traders jo market mein existing long position khole hain, unke liye ye bearish Dark Cloud Cover pattern long trade ko poori ya partly band karne ki sambhavna ko darust karta hai.
    Dark Cloud Cover pattern ko forex charts par dhundte waqt dhyan dene ki jarurat hai ki candlestick charts mein gaps ek rare ghatna hain. Iska karan hai crypto ke liye 24-hour trading uplabdh hai. Sanket darust karne ke liye aapko dekhna hai ki ek large-bodied red candle hai jo ek large-bodied green candle ki 50% se zyada ko wapas le.

    Pattern Criteria


    Dark Cloud Cover pattern ke teen ahem elements ke alawa, dusre criteria bhi signal ko majbooti dete hain.
    Pehle to candlestick pattern bearish hota hai, isliye ye uptrend ke ant mein behtar kaam karta hai. Agar market ne niche ki taraf move kiya hai, to ye pattern ek acchi risk-to-reward ratio opportunity nahi deta.
    Dusri baat, aap oscillators aur doosre technical indicators mein overbought values dikh sakte hain, kyun ki trend ne tezi se upar ki taraf plant kiya gaya hai. Jab ye oscillators niche ki taraf murne lagte hain, to price action se alag hoti hain, jiske parinamswarup oscillator par lower high hota hai lekin price par higher high hota hai.
    Is stage par uptrend abhi bhi shakti se jari hai lekin kafi kamjor ho gayi hai. Iska karan wave relationship ho sakta hai ya fir resistance level upar ho sakta hai. Chahe kuch bhi ho, market ek aakhri bar rally karne ki koshish karti hai, lekin us rally ko majboot resistance milta hai — aur ek bada red candle Dark Cloud Cover pattern ko carve karta hai.
    Upar diya gaya Dark Cloud Cover pattern dikhata hai ki market uptrend se downtrend mein badal raha hai. Support ke tootne se trend badal gaya hai, jisse ek gehri correction ke liye darwaza khul jata hai.
    Forex traders pattern ko doosre technical signals ke sath istemal karke naye short positions mein dakhil hone ya long positions ko band karne ke liye istemal karte hain.

    Price Action/Context

    Dark Cloud Cover pattern akela ek do-candle pattern hai. Lekin ise sahi se crypto chart par pehchanne ke liye doosre maanadhaar ka dhyan dena jaruri hai.
    Is uptrend ke dauran, Relative Strength Index (RSI) oscillator hamesha overbought territory mein rehta tha. Lekin jab assets price all-time highs tak badhti rahi aur RSI lower highs dikhane lag gaya, to Dark Cloud Cover candlestick pattern dikhayi dene lagta hai. Pehla green candle naye all-time highs tak ja pahunchta hai. Phir pattern ka doosra candle, red candle, pehli green candle ke range ke lower half mein band hota hai.
    Isse ye darust hota hai ki uptrend apni momentum kho raha hai, aur ek downtrend ki taraf ishara ho raha hai. Lekin market all-time highs par hai, isliye ye mushkil hai ki bearish reversal pattern dikhaye ya trend reversal ho raha hai.
    Ek trader ko trend ki taraf badalne ki ek aur indication pane ke liye uptrend ko encompass karne wali ek trend line add karni chahiye. Jahaan trend line toot jati hai, wahaan trader ko confirmation mil jata hai ki ek correction shuru ho raha hai. Aap horizontal support levels par bhi dekhsakte hain aur wait kar sakte hain ki price action use tode. Phir aap short position shuru kar sakte hain ya long positions ko band karne ka mauka istemal kar sakte hain.

    Trading


    Jab aapne ek Dark Cloud Cover pattern pehchan liya hai, to usse trade karna kaafi aasan hai. Yeh kai tariko par trade karne ki anumati deta hai, kuch conservative traders ke liye aur kuch aggressive traders ke liye.
    Zyada conservative approach aapko short me dakhil hone se pehle aur adhik trend confirmations dekhne ki anumati deta hai. Zyada aggressive approach aapko jaldi short trade me dalta hai lekin false signal par amal karne aur trade se bahar nikal dene ki zyada sambhavna hoti hai.
    Is pattern ke prakat hone se pehle ek pehle uptrend dekhna zaroori hai. Uske baad ek average bullish candle dekhna zaroori hai jo pehli candle banane ke liye higher ja rahi hai. Pattern ke dusre candle ki price range ki kam se kam 50% ko wapas kar dena chahiye.
    Stop loss abhi haal hil ke recent swing high ke upar lagaya jata hai, jo pattern ka high hone ke sambhavna hai. Traders kam se kam apne stop loss ke distance ka do guna target dekhna chahenge. Isse trader ko ek 1:2 risk-to-reward ratio milta hai.
    Kabhi-kabhi turn lower ke liye sanket itne majboot nahi hote aur trader setup mein conservative hona chahte hain. Conservative traders support trend line ko tootne ka confirmation dene ke liye dekh sakte hain. Trade setup aggressive approach ki tarah hota hai, jahan stop loss bhi wahi jagah par lagaya jata hai, lekin entry price kam hoti hai kyun ki hum aur confirmation levels ka intezar kar rahe hain. Iska matlab hai ki humara target price bhi 1:2 risk-to-reward ratio maintain karne ke liye kam ho jayega.

    Dark Cloud Cover vs. Bearish Engulfing: lekin
    Ek naye trader ke liye, Dark Cloud Cover Bearish Engulfing candlestick pattern se milta julta lag sakta hai. Yakeen karne ke liye, dono mein kuch similarities hain, lekin kuch antar hain.
    Samantarata hai ki dono candlestick patterns ek uptrend ke baad bane hain. Lekin in dono mein do bade antar hain. Pehla, Dark Cloud Cover mein candle price ranges average se badi honi chahiye. Bearish Engulfing pattern mein pehli candle ki koi size specifications nahi hoti.
    Iske alawa, Dark Cloud Cover pattern ke doosre candle ko sirf pehle candle ki 50% ko cover karna chahiye. Bearish Engulfing mein doosra candle pehle candle ki poori body ko cover karna chahiye. Isliye, Bearish Engulfing pattern pehle candle ki poori body ko cover karna chahiye, jo choti ho sakti hai, lekin Dark Cloud Cover ke candles average se bade hote hain.

    Reliability


    Akela, Dark Cloud Cover pattern sirf consolidation ya ek lower turn ki sambhavna dikhata hai. Isliye trader ko doosre technical analysis tools se confirmation signals dhoondhne ki jarurat hoti hai.
    Udaharan ke liye, sabhi Dark Cloud Cover patterns resistance ke pas nahi banenge. Lekin agar woh wahaan bante hain, to ye ek majboot signal pradan karte hain. Resistance ke saare prakar, chahe wo trend line resistance ho, horizontal resistance ho, ya Fibonacci retracement level ho, apply hote hain.
    Is pattern ka prakat hone ka tend hamesha uptrend ke baad hota hai. Isliye indicators aur oscillators overbought dikhate hain. Agar aapke indicators sell signal dene lagte hain tab jab pattern dikhata hai, to ye confirmation signals ka combination signal ko majboot karta hai.
    Phir se, dark cloud cover pattern forex charts ke sabhi time frames par dikh sakta hai. Lambi time frame charts chhote minute charts ke mukable adhik bharosa dete hain kyun ki risk-to-reward ratios aksar behtar hote hain.

    Conclusion


    Dark Cloud Cover ek Japanese candlestick pattern hai jo sabhi forex price charts ke sabhi time frames par pehchana ja sakta hai. Is pattern ko sahi se pehchane par aap asani se apne entry aur exit signals set up kar sakte hain. Lekin akela is pattern se false signals bhi aaye sakte hain. Isliye behtar hai ki aap is signals ko technical indicators se confirm karen aur moolbhoot analysis se trend ko aur bhi confirm karen. Chahe aap ek naye trader ho ya purane trader, hamesha samajhdar tarah se trade karen aur maforexrket mein daakhil hone se pehle market sentiment ka moolyaankan karen. Khaaskar extreme price fluctuations crypto market mein ho sakte hain.


    • #3 Collapse

      Dark cloud candlestick chart Pattern kai hy


      Dark Cloud Cover Candlestick Pattern (ڈارک کلاؤڈ کوور کینڈلسٹک پیٹرن):

      Dark Cloud Cover Candlestick Pattern ek bearish reversal pattern hai jo market charts par dikhai deta hai. Ye pattern typically uptrend ke baad aata hai aur indicate karta hai ke bullish momentum kamzor ho sakta hai aur bearish reversal hone ke chances hain.

      Formation:
      1. Uptrend: Pehle, market mein ek strong uptrend hota hai jisme prices consistently upar jaati hain.
      2. Bullish Candle: Uptrend ke baad ek large bullish candle aati hai, jo indicate karta hai ke buyers control mein hain.
      3. Bearish Candle: Doosre candle mein price neeche jaane lagta hai aur bearish candle form hoti hai. Is bearish candle ki opening price upper side par hoti hai, lekin closing price pehli candle ke upper side ke bohat kareeb ya usse neeche hoti hai.

      Characteristics:
      • Dark Cloud Cover pattern ka crucial element hai doosri candle ki closing price, jo pehli candle ke upper side ke kareeb hoti hai, indicating potential bearish reversal.
      • Is pattern ko dekh kar traders ko lagta hai ke uptrend ke baad market mein bearish pressure aa rahi hai.

      Interpretation: Dark Cloud Cover pattern ka interpretation ye hai ke uptrend ke baad market mein bearish reversal hone ke chances hain. Ye pattern bullish momentum kamzor hone aur sellers ke active hone ko darust karta hai.

      Trading Strategy:
      • Traders is pattern ko dekh kar cautious ho jaate hain aur potential trend reversal ko confirm karne ke liye next candle ka wait karte hain.
      • Agar next candle bhi bearish hai aur downtrend confirm hoti hai, to traders short positions (sell positions) par focus karte hain.
      • Stop-loss orders ka istemal important hai taki agar market mein kisi anjaane ghatna ke asar se koi tezi aati hai toh trader bacha ja sake.

      Conclusion: Dark Cloud Cover Candlestick Pattern market mein potential trend reversal ko indicate karta hai. Lekin, hamesha ek aurat karke trading decisions lene se pehle thorough market analysis aur risk management ka istemal karna important hai.


      • #4 Collapse

        Dark Cloud Cover Pattern

        Dark Cloud Cover ek candlestick pattern hai jo market trend reversal ko indicate karta hai. Yeh pattern do candles se banta hai aur mostly uptrend ke baad aata hai. Main Dark Cloud Cover candlestick pattern ki tafseelat explain kar raha hoon.

        Dark Cloud Cover Kya Hai?

        Dark Cloud Cover ek bearish reversal pattern hai, jo bullish trend ke baad aata hai. Ismein do candles shamil hote hain – pehla candle positive (bullish) hota hai aur doosra candle negative (bearish) hota hai. Yeh pattern market mein selling pressure ko darust karti hai, isay trend reversal ka indication samjha jata hai.

        Click image for larger version

Name:	dark-cloud-cover-candlestick.png
Views:	43
Size:	33.8 کلوبائٹ
ID:	12852870

        Dark Cloud Cover Formation:

        Dark Cloud Cover formation ke liye niche diye gaye steps ko follow kiya jata hai:
        1. Pehla Candle (Bullish): Trend initially bullish hota hai aur pehla candle bada aur positive (green) hota hai. Yeh candle uptrend ko represent karta hai.
        2. Dusra Candle (Bearish): Doosra candle pehle ke candle ke oopar open hota hai, lekin throughout the day price girte hue close hoti hai. Yeh candle pehle ke candle ke aadhe se zyada area ko cover karta hai aur iski body positive candle ke andar ghus jati hai.

        Dark Cloud Cover Ki Tafseelat:

        Dark Cloud Cover pattern ki pehchan karne ke liye kuch important points hain:
        • Pehle Candle ka Size: Pehla candle zyada bada aur bullish hota hai, indicating a strong uptrend.
        • Dusra Candle ka Size: Doosra candle pehle ke candle ko cover karta hai, aur iski close price pehle ke candle ke aadhe se zyada niche hoti hai.
        • Gap Up Opening: Doosra candle pehle ke candle ke oopar open hota hai, showing initial optimism.
        • Close Price: Doosra candle ka close price pehle ke candle ke aadhe se zyada niche hota hai, reflecting a shift in sentiment towards selling.

        Dark Cloud Cover Trading Strategy:

        Dark Cloud Cover pattern ka istemal trading strategy banane mein hota hai. Yeh bearish reversal pattern hone ke nateejay mein trader ko caution aur selling opportunities provide karta hai.
        1. Confirmation:
          • Dark Cloud Cover pattern ko confirm karne ke liye, trader ko doosre din ke open par dhyan dena chahiye. Agar price doosre din bhi down ja raha hai, toh ye pattern confirm hota hai.
        2. Short Position:
          • Dark Cloud Cover pattern ke baad trader short position le sakta hai, yaani ke sell kar sakta hai. Yeh indicate karta hai ke bearish momentum shuru ho gaya hai.
        3. Stop Loss:
          • Stop loss ko set karna zaroori hai, taaki trader ko excessive loss se bacha ja sake.
        4. Target Price:
          • Target price ko set karna bhi important hai. Trader ko decide karna chahiye ke woh kis level tak price girne ki expectation rakhta hai.

        Dark Cloud Cover Ka Istemal Kaise Karein:

        Dark Cloud Cover pattern ka istemal market analysis mein shaamil karne ke liye, trader ko price action aur overall market conditions par dhyan dena hoga. Kabhi-kabhi false signals bhi aa sakte hain, isliye proper risk management bhi zaroori hai.
        Click image for larger version

Name:	dark-cloud-cover_body_how_to_trade_using_dark_cloud_cover_pattern_gbpusd.png.full.png
Views:	39
Size:	21.6 کلوبائٹ
ID:	12852871

        Final Thoughts:

        Dark Cloud Cover pattern ek powerful tool hai market trend reversal ko anticipate karne ke liye. Lekin, har pattern ki tarah, iska bhi istemal cautious approach ke sath karna chahiye aur doosre technical indicators ke sath combine karna behtar hota hai. Trading mein success ke liye discipline, risk management aur continuous learning ka bhi bahut important role hota hai.


        • #5 Collapse


          Click image for larger version

Name:	dark.png
Views:	42
Size:	4.4 کلوبائٹ
ID:	12852915

          Dark Cloud Cover candlestick pattern bearish reversal ko indicate karta hai, aur iski ahmiyat traders ke liye is tarah hai:

          Trend Reversal Signal:

          Dark Cloud Cover pattern market mein potential trend reversal ka signal provide karta hai. Jab ye pattern form hota hai, especially uptrend ke baad, to ye ek potential downtrend ke aghaz ka sign hai. Traders is pattern ko dekh kar samajh sakte hain ke buying pressure kam ho rahi hai aur selling pressure barh gayi hai.

          Selling Pressure:

          Dusri candle pehli candle ko cover karti hai, lekin iska closing price pehli candle ki closing price se neeche hota hai. Isse darust hota hai ke sellers ne control haasil kiya hai aur market mein selling pressure dominate kar rahi hai. Traders ko alert karta hai ke ab positions ko review karna zaroori hai.

          Confirmation with Other Indicators:

          Dark Cloud Cover ko doosre technical indicators ke saath combine karke traders apne analysis ko confirm kar sakte hain. Iske saath hi, volume analysis aur trend lines ka istemal karke bhi is signal ki authenticity ko verify kiya ja sakta hai.

          Entry and Exit Points:

          Traders is pattern ko apne trading strategy mein integrate kar ke entry aur exit points tay kar sakte hain. Agar Dark Cloud Cover sahi tarah se identify hota hai, to traders isko use kar ke short positions lete hain, jisse unhe potential downtrend ka faida ho sakta hai.

          Risk Management:

          Dark Cloud Cover pattern ki madad se traders apne risk management strategies ko improve kar sakte hain. Agar ye pattern sahi tarah se confirm hota hai, to traders apne stop-loss orders aur risk levels ko adjust kar sakte hain.Hamesha yaad rahe ke kisi bhi single indicator par pura bharosa na karein aur market analysis ko comprehensive taur par karein. Dark Cloud Cover ek tool hai jo traders ko market conditions ke changes ka pata lagane mein madad karta hai, lekin doosre factors ko bhi consider karna zaruri hai.


          • #6 Collapse

            Andheray Badal Candlestick Chart Pattern: Market Ka Ek Aham Tareeqa

            Markets mein investment karne ka tareeqa bohot ahem hota hai aur ek successful trader ke liye technical analysis ka ilm bhi zaroori hota hai. Ek aham technical analysis tool hai "Candlestick Chart Pattern". Yeh article andheray badal candlestick chart pattern par hai jo traders ko market ke movements ko samajhne mein madad deta hai.

            1. Andheray Badal Candlestick Chart Pattern Kya Hai?

            Andheray badal candlestick chart pattern ek technical analysis ka tareeqa hai jismein traders market ke movements ko samajhte hain. Yeh patterns price action ko visualize karne mein madad karte hain aur traders ko future price movements ka andaza lagane mein help karte hain.

            2. Andheray Badal Candlestick Chart Pattern Ki Tareef

            Candlestick chart patterns kisi bhi financial instrument ke price movements ko represent karte hain. Har candlestick ek specific time period ko represent karta hai aur uski upper aur lower wicks high aur low prices ko dikhate hain. Candlestick ke colors aur shapes traders ko market sentiment ke bare mein bata sakte hain.

            3. Mukhtalif Andheray Badal Candlestick Chart Patterns
            1. Hammer: Yeh ek bullish reversal pattern hai jo downtrend ke baad aata hai. Iska matlab hai ke market ke buyers price ko upar le ja rahe hain.
            2. Shooting Star: Yeh ek bearish reversal pattern hai jo uptrend ke baad aata hai. Iska matlab hai ke market ke sellers price ko neeche le ja rahe hain.
            3. Doji: Yeh ek indecision pattern hai jo bullish ya bearish trend ke beech mein aata hai. Iska matlab hai ke market mein buyers aur sellers ke darmiyan koi clear direction nahi hai.
            4. Engulfing Pattern: Yeh ek reversal pattern hai jo do candlesticks se banta hai. Pehla candlestick small hai aur doosra candlestick pehle wale ko engulf karta hai.
            5. Dark Cloud Cover: Yeh ek bearish reversal pattern hai jo uptrend ke baad aata hai. Iska matlab hai ke market ke sellers price ko neeche le ja rahe hain.

            4. Dark Cloud Candlestick Pattern Ka Istemal Kaise Kiya Jata Hai?

            Dark cloud candlestick pattern ko market analysis mein istemal karne ke liye traders ko kuch steps follow karne hote hain:
            1. Identify: Pehle traders ko current uptrend ke baad dark cloud cover pattern ko identify karna hota hai.
            2. Confirmation: Phir traders ko wait karna hota hai ke next candlestick kya karta hai. Agar next candlestick neeche girta hai aur dark cloud pattern ko confirm karta hai to traders ko sell signal milta hai.
            3. Stop Loss: Har trade mein stop loss ka istemal zaroori hota hai taake nuksan se bacha ja sake.
            4. Target: Traders ko apna target set karna hota hai jahan wo apne positions ko close karna chahte hain.

            5. Dark Cloud Candlestick Pattern Ka Mahatva

            Dark cloud candlestick pattern market mein bearish reversal ko indicate karta hai aur traders ko potential downtrend ke bare mein alert karta hai. Is pattern ka istemal karke traders apne trading strategies ko improve kar sakte hain aur better trading decisions le sakte hain.

            Andheray badal candlestick chart pattern ek powerful tool hai jo traders ko market ke movements ko samajhne mein madad karta hai. Traders ko is pattern ka istemal karke market ke reversals ko pehchanne mein madad milti hai aur unhe better trading opportunities milte hain. Magar yaad rahe ke kisi bhi technical analysis tool ki tarah, andheray badal candlestick chart pattern bhi kabhi-kabhi galat signal de sakta hai, isliye traders ko apne analysis ko confirm karne ke liye aur risk management ka istemal karne ke liye hamesha cautious rehna chahiye.

            • #7 Collapse

              dark cloud candlestick chart pattern


              Click image for larger version

Name:	download (28).png
Views:	42
Size:	3.9 کلوبائٹ
ID:	12852943

              Dark Cloud Candlestick Chart Pattern:

              Dark Cloud Candlestick Pattern Kya Hai?

              Dark Cloud candlestick pattern ek bearish reversal signal hai jo ke market trends mein change ko indicate karta hai. Is pattern mein do consecutive candles shamil hote hain, jo bearish trend ke possible shuruwat ko signal karte hain.

              Formation:
              1. Pehli Candle (Bullish):
                • Pehli candle ek uptrend ke doran aati hai aur bullish hoti hai.
                • Is candle ki opening price pehle ke session ke closing price ke barabar ya usse zyada hoti hai.
              2. Dusri Candle (Bearish):
                • Dusri candle pehli candle ki upper half mein open hoti hai.
                • Candle ka closing price pehli candle ke body ke andar, lekin usse neeche hota hai.
                • Dusri candle ka body pehli candle ke body ko partially cover karti hai, isay "engulfing" kehte hain.

              Tafseel:
              • Dark Cloud pattern ko dekhte hue traders ko ye lagta hai ke bullish trend weak ho sakta hai aur bearish movement shuru ho sakti hai.
              • Dusri candle ki color pehli candle ki color ko override karti hai, indicating a potential shift in market sentiment.
              • Is pattern ka effect zyada hota hai jab ye higher timeframes par dikhe.

              Istemal aur Hidayat:
              • Jab Dark Cloud pattern dikhe, traders ko ye samajhna chahiye ke bearish reversal hone ke chances hain.
              • Traders apne existing long positions ko close karke ya short positions enter karke is bearish movement ka faida utha sakte hain.
              • Is pattern ka istemal doosre technical indicators ke saath karne se behtar hota hai taki false signals ko identify kiya ja sake.

              Naseehat:
              • Har ek trading decision se pehle market conditions ka pura jayezah lena zaroori hai.
              • Dark Cloud pattern bhi, jese ke kisi aur technical indicator ki tarah, kabhi-kabhi false signals bhi de sakta hai.

              Conclusion:

              Dark Cloud candlestick pattern, traders ko bearish reversal ke possible signs dikhata hai. Lekin, prudent trading ke liye, isay doosre indicators aur market analysis ke saath milake istemal karna zaroori hai.
              • #8 Collapse


                Introduction:


                Dark Cloud Candlestick Pattern, ya Gehrai Ghata Candlestick Pattern, ek technical analysis tool hai jo stock market mein istemal hota hai. Ye pattern do candlesticks se bana hota hai. Pehla candlestick uptrend mein hota hai aur doosra candlestick neeche ki taraf move karta hai, pehle candlestick ke upper se shuru hota hai. Doosra candlestick pehle ke approximately half tak jaata hai. Ye pattern bullish trend ki indication ko negate karta hai aur potential reversal ka signal deta hai.


                Gehrai Ghata Candlestick Pattern Ki Tafseelat:


                Pehla Candlestick (Bullish):

                Gehrai Ghata Candlestick Pattern ka pehla candlestick ek bullish candle hota hai jo uptrend mein shuru hota hai. Iski lambai aur volume zyada hoti hai, jo ke uptrend ki strength ko dikhata hai. Yeh candlestick aksar zyada positive sentiment ko indicate karta hai.

                Dusra Candlestick (Bearish):

                Dusra candlestick, yaani Gehrai Ghata Candlestick Pattern ka dark cloud, bullish candlestick ke upper se shuru hota hai. Iski lambai pehle candlestick ke approximately half tak hoti hai. Is candlestick ki color red hoti hai, jo ke selling pressure ya bearish sentiment ko represent karta hai.


                Dark Cloud Candlestick Pattern Ka Tafsili Tazurba:


                Dark Cloud Candlestick Pattern ka asal maqsad trend reversal ka pata lagana hai. Jab pehla bullish candlestick ke baad doosra bearish candlestick aata hai, to ye indicate karta hai ke buyers ki power khatam ho rahi hai aur sellers dominate kar rahe hain. Is situation mein traders ko cautious hona chahiye aur further confirmation ke liye wait karna chahiye.


                Dark Cloud Candlestick Pattern Ka Istemal:


                Entry Point Identify Karna:

                Gehrai Ghata Candlestick Pattern ko dekh kar traders entry point identify kar sakte hain. Agar dark cloud candlestick ke baad price ne neeche ki taraf move kiya hai, to yeh entry point ki indication hai.

                Stop Loss Aur Target Determine Karna:

                Dark Cloud Candlestick Pattern ko istemal karke traders apne stop loss aur target levels determine kar sakte hain. Agar pattern confirm hota hai, to stop loss ko pehle candlestick ke high ke thode se above rakha ja sakta hai, aur target price ko previous support level ke aas paas rakha ja sakta hai.

                Confirmatory Signals Ke Intezar Karna:

                Dark Cloud Candlestick Pattern ko confirm karne ke liye traders ko aur confirmatory signals ka intezar karna chahiye. Ye signals include kisi aur technical indicator ka istemal, ya phir doosre candlestick patterns ki confirmation.


                Conclusion:


                Dark Cloud Candlestick Pattern, ya Gehrai Ghata Candlestick Pattern, ek powerful tool hai jo traders ko trend reversal ka indication deta hai. Is pattern ko samajh kar, traders apne trading strategies ko improve kar sakte hain aur better entry aur exit points identify kar sakte hain. Magar yaad rahe ke har ek pattern ki tarah, is pattern ko bhi sahi tarike se samajhna aur confirm karna zaroori hai, taki trading decisions sahi aur profitable ho sakein.


                There is a time to go long, a time to go short and a time to go fishing.
                ​​​​​​​

                ​​​​​​​
                • #9 Collapse

                  CONCEPT DEVELOPMENT

                  Dosto! Forex business mein dark cloud cover pattern aik price action ka pattern hay jo kay bullish aur bearish dono condition main form hota hay, jo bullish trend kay baad ata hai aur downside move ki starting indicate karta hai. Ess pattern ki formation ke baad traders selling chances dekhte hain, ya present long positions ko close karte hain. Dark cloud cover pattern aik strong pattern hai jis ma just bearish opportunity ko he avail kia jata hai laikn is main management bhi achi leni hoti hay, dark cloud cover candlestick pattern aik perfect bearish pattern hai jis ma apko market ky bullish trend ki bearish turning ky bary ma confirmation milti hai is ma jab bhi aik bullish candle ky bad aik black ya red bearish candle jo bullish candle ki upper side sy start hoti hai laikn close us candle kay lower side pay hoti hai aur next aik spinning candle banti hai wo bhi bearish hi hoti hai jis say bearish trend ki confirmation mil jati hay. thanks

                  Click image for larger version

Name:	ppp.png
Views:	35
Size:	48.9 کلوبائٹ
ID:	12859954


                  CHARACTERISTICS

                  My fellow traders ess pattern mein first candle long bullish banti hai esi tarah day close tak bullish ho ker close ho jati hy. Pattern ki 2nd black candle 1st white candle se above thore se gap open me hoti hen, lekin baad me qeematon pe selling pressure ki waja se candle down and kar white me dakhil ho kar close ho jati hai. Dark cloud cover pattern ki dependability ko increase kerny kay liye traders doji ya bearish confirmation candles jaise aur confirmatory signals ka use karte hain. Ess pattern ko confirm karne ke liye traders volume ki bhi details dekhte hain. Agar volume bhi increase ho raha ho tou pattern ki dependability aur mazboot hoti hai. Dark cloud cover pattern ki identity, second bearish candle sey hoti hai, jo first day ki bullish candle ki upper range mein hoti hai. Is bearish candle ki position pattern ki correction karti hai. Jiss kay baad yeh pattern complete hony ka signal deta hy.

                  Click image for larger version

Name:	qqq.jpg
Views:	30
Size:	96.6 کلوبائٹ
ID:	12859955


                  TECHNICALITIES

                  Trading ky duran traders ko confirmatory signals ka wait karna chahiye. Pattern ki banne ki psychology kuch iss tarah se hai, jiss main buyer price ko pehle ooper push karte hein jiss sey bearish candle bullish candle sey up gap meinin open hoti hai. But baad main buyer ki prices kay top mein interest nahi rehti hai jiss ki waja sey ussi waqat sellers market main mostly active ho jate hein. Traders ki zyada aggressive approach jaldi short trade me dalta hai lekin false signal application sey bahar nikal dene ki zyada zaroorat hoti hai. En perimerters ko mind mein rakh ker jo trading perform ki jati traders oss sey profit hasil kerny mein most of the time kamyab ho jaty hein.

                  Click image for larger version

Name:	rrr.jpg
Views:	30
Size:	177.8 کلوبائٹ
ID:	12859956

                  • #10 Collapse

                    Dark cloud candlestick chart Pattern


                    Click image for larger version

Name:	dark-cloud-candlestick-chart-pattern-japanese-candlesticks-pattern-powerful-bearish-candlestick-chart-for-forex-stock-cryptocurrency-trading-signal-vector.jpg
Views:	34
Size:	141.0 کلوبائٹ
ID:	12859970


                    Dark Cloud Cover Candlestick Pattern ek bearish reversal pattern hai jo typically uptrend ke baad dikhta hai.


                    Yeh do candlesticks se bana hota hai. Pehla candlestick green (bullish) hota hai aur doosra candlestick red (bearish) hota hai. Neeche "Dark Cloud Cover Candlestick Pattern" ke mukhtasir tafseelat mein di gayi hai:


                    Dark Cloud Cover Candlestick Pattern - Dark Cloud Cover Candlestick Pattern ek bearish reversal pattern hai jo market mein ek possible trend change ko indicate karta hai. Yeh typically uptrend ke baad dikhai deta hai.

                    Dharohar:

                    Dark Cloud Cover pattern do candlesticks se bana hota hai.


                    Pehla candlestick green (bullish) hota hai aur doosra candlestick red (bearish) hota hai.
                    Doosre candlestick ka open price pehle candlestick ke close price se oopar hota hai, lekin iska close price pehle candlestick ke center ya uske neeche hota hai.


                    Shape (Shakal):


                    Dark Cloud Cover pattern ka shape ek dark cloud ki tarah hota hai, jismein doosra bearish candlestick pehle bullish candlestick ko partially cover karta hai.


                    Tafsiliat:


                    Dark Cloud Cover pattern uptrend ke baad dikhai deta hai aur bearish reversal ko indicate karta hai.


                    Yeh pattern traders ko yeh indicate karta hai ke uptrend ka momentum kamzor ho raha hai aur bearish price action shuru ho sakta hai.


                    Tijarati Tareeqa:


                    Dark Cloud Cover pattern ke appearance ke baad, traders short positions lete hain ya phir existing long positions ko close karte hain, expecting a bearish price reversal.


                    Stop loss aur take profit levels ka istemal karte hue, traders apni positions ko manage karte hain.


                    Dark Cloud Cover Candlestick Pattern traders ko market mein potential trend reversals ki sambhavnao ko identify karne mein madad karta hai. Lekin, har trading decision ke liye mukammal analysis aur risk management zaroori hai.
                    • #11 Collapse

                      Dark Cloud Cover Candlestick Pattern:
                      Dark cloud cover candle stuck patteren aik do candle bearish ریورسل patteren hai jo aik taweel up trained ke ekhtataam par hota hai. pehli mom batii aik lambi blush candle hai, jis se zahir hota hai ke market kharidaron ke haath mein thi.

                      doosri mom batii aik lambi bearish candle hai jo pichli mom batii ki oonchai ke oopar khulti hai lekin pichli mom batii ke wast se neechay band hoti hai, is baat ka ishara hai ke baichnay walon ne market ka control sambhaal liya hai.
                      zail mein mom batii ki tasweerai numaindagi hai .


                      dark cloud cover candle stuck patteren hai jo bearish ki taraf momentum shift ka ishara deta hai. gehray baadalon ka ihata ziyada tar aik taweel up trained ke baad zahir hota hai jo rujhan ko neechay ke rujhan mein tabdeel karne ki nishandahi karta hai. woh waqt ke sath sath kisi khaas security ke khilnay, band honay, aur ziyada aur kam qeematein dikhata hain .

                      black cloud cover candle stick ka bunyadi faida yeh hai ke taajiron ko taweel holdngz ko tark karne ya mukhtasir pozishnon mein daakhil honay ka ibtidayi ishara faraham karna hai, jis se woh mumkina qeematon mein kami ka faida utha satke hain. dark cloud cover candlestick ka aik ahem nuqsaan yeh hai ke yeh kabhi kabhar ghalat signals peda kar sakta hai, jis ki wajah se tajir kharab tijarti faislay kar satke hain .

                      gehray baadalon ka ihata is waqt hota hai jab aik lambi blush candle ke baad aik lambi bearish candle aati hai jis ke sath pichli candle ke wast point ke neechay band hoti hai. yeh patteren is baat ki nishandahi karta hai ke khredar market ki taaqat ko barqarar rakhnay se qassar thay aur farokht knndgan ne is par qabza kar liya hai, jis ke nateejay mein mumkina tor par kami ka rujhan hai. yeh patteren aksar taajiron ki taraf se mukhtasir pozishnon ko baichnay ya daakhil karne ke liye aik signal ke tor par istemaal kya jata hai .

                      Dark cloud candlestick ki pehchan:

                      tajir takneeki tajzia mein dark cloud cover candle stuck patteren ki shanakht ke liye makhsoos iqdamaat istemaal karte hain. traders pehlay patteren ko talaash karne ke liye market mein up trained talaash karte hain. is ke baad woh pehli mom batii ki jaanch karte hain, jo ke aik lambi blush candle honi chahiye jo kharidari ke dabao ki nishandahi karti hai.
                      is ke baad woh doosri mom batii ka muaina karte hain, jo aik lambi bearish candle honi chahiye jo pichli mom batii ke ounchay oopar khulti hai aur pehli mom batii ke wast point ke neechay band hoti hai. patteren ki tasdeeq ho jati hai agar bearish candle pichlle din ke band se neechay band ho jati hai. neechay di gayi tasweer ka hawala den .
                      Dark cloud cover candlestick kam kaisy krta hy:
                      taajiron ko mom btyon ki lambai aur patteren ke peechay volume par bhi ghhor karna chahiye, kyunkay ziyada tijarti hajam wali lambi aur ziyada ahem mom batian mumkina rujhan ke ulat jane ki tasdeeq kar sakti hain.

                      dark cloud cover patteren ko mazeed safaid aur siyah mom btyon ki taraf se khasusiyat di jati hai jin ke haqeeqi jism lambay hotay hain aur nisbatan mukhtasir ya ghair mojood saaye hotay hain. yeh Awsaf batatay hain ke nichli harkat qeemat ki harkat ke lehaaz se intehai faisla kin aur ahem thi. traders patteren ke baad bearish candle ki shakal mein tasdeeq bhi talaash kar satke hain.
                      dark cloud cover ke baad qeemat mein kami ki tawaqqa hai, lehaza agar aisa nahi hota hai to patteren nakaam ho sakta hai .

                      bearish candle ke band ko lambi pozishnon se bahar niklny ke liye istemaal kya ja sakta hai. mutabadil tor par, agar qeemat musalsal girty rehti hai to tajir aglay din bahar nikal satke hain ( patteren ki tasdeeq ho gayi ). agar bearish candle ke band honay par ya aglay period mein short daakhil hota hai to, bearish candle ki oonchai ke oopar aik stap nuqsaan rakha ja sakta hai .
                      • #12 Collapse

                        Dark Cloud Cover Candlestick Pattern: Ek Ahem Technical Analysis Patran


                        Dark Cloud Cover Kya Hai? Dark Cloud Cover ek bearish reversal candlestick pattern hai jo financial markets mein istemal hota hai. Yeh pattern bullish trend ke baad aata hai aur indicate karta hai ke bearish trend hone ke chances hain.


                        Dark Cloud Cover Ki Tashkeel:
                        1. Bullish Candle: Dark Cloud Cover ka pehla part ek lambi bullish (upward) candle hoti hai, jo market mein strong buying pressure ko darust karti hai.
                        2. Gap Up: Dusre part mein, ek gap up hota hai, jise market higher open par shuru hoti hai.
                        3. Bearish Candle: Teesra part ek bearish (downward) candle hoti hai, jo pehli candle ke upar tak pohoch kar iska adha ya zyada hissa cover karti hai.

                        Dark Cloud Cover Ka Matlab:


                        Dark Cloud Cover ka aana darust karta hai ke bullish trend khatam ho sakta hai aur bearish trend shuru hone wala hai. Iska interpretation yeh hota hai ke buyers ne control lose kiya hai aur sellers market mein aana shuru kar rahe hain.

                        Dark Cloud Cover Ka Istemal Kaise Karein:
                        1. Confirmation Ke Liye Intezar: Dark Cloud Cover ke signals ko confirm karne ke liye traders ko dobara se price action aur market conditions ka intezar karna chahiye. Agar next candle bearish hai aur price down hoti hai, toh yeh confirmatory signal hai.
                        2. Volume Analysis: Dark Cloud Cover ke saath volume analysis ka bhi istemal karna zaroori hai. Agar bearish candle ke sath izafa ho raha hai, toh yeh confirm karta hai ke sellers control mein hain.

                        Trading Strategies with Dark Cloud Cover:
                        1. Short Position: Dark Cloud Cover ke signals par traders short position le sakte hain, expecting a bearish trend.
                        2. Stop Loss Aur Target Levels: Stop loss aur target levels ko tay karte waqt, traders ko risk management ka bhi khayal rakhna chahiye.

                        Dark Cloud Cover Ki Limitations:
                        1. False Signals: Kabhi-kabhi choppy markets mein ya unexpected events ke baad false signals bhi ho sakte hain, isliye confirmatory indicators ka istemal karna zaroori hai.
                        2. Market Conditions Ka Asar: Market conditions ka bhi asar hota hai, aur kuch traders is pattern ko confirm hone ke liye doosre indicators ke saath istemal karte hain.


                        Conclusion:


                        Dark Cloud Cover ek bearish reversal pattern hai jo traders ko potential trend reversal ka signal deta hai. Hamesha saavdhaan aur confirmatory indicators ke saath is patran ka istemal karna chahiye. Risk management aur market conditions ko madde nazar rakhte hue smart trading ki jaye.
                        • #13 Collapse

                          Dark cloud candlestick chart Pattern
                          Click image for larger version

Name:	dark-cloud-cover_body_zoomedindarkcloudcoverGBPUSD.png
Views:	33
Size:	7.8 کلوبائٹ
ID:	12860040
                          I. Introduction

                          A. Dark Cloud Candlestick Chart Pattern Ki Tashreeh - Dark Cloud Candlestick Chart Pattern ek reversal pattern hai jo uptrend ke baad aata hai aur bearish reversal ka signal deta hai. - Ye pattern do candlesticks se bana hota hai aur bearish sentiment ka indication deta hai.

                          II. Dark Cloud Candlestick Chart Pattern Ka Tafseel

                          A. Dark Cloud Pattern Ki Structure - Pehla candlestick ek bullish trend ke baad aata hai aur upar close karta hai. - Dosra candlestick pehle ke upar open hota hai lekin pehle ke close ke neeche close karta hai.

                          III. Dark Cloud Candlestick Chart Pattern Ke Key Features

                          A. Bearish Reversal Signal - Dark Cloud Candlestick Chart Pattern ek strong bearish reversal signal hai. - Pehle ke uptrend ke baad is pattern ka appearance bearish trend ke aaney ka indication deta hai.

                          B. Confirmation Factors - Dark Cloud pattern ko confirm karne ke liye traders doosre technical indicators ka bhi istemal karte hain jaise ke RSI, MACD, ya moving averages. - In indicators ki madad se traders ko confirm karna hota hai ke market mein actual reversal hone ki kya possibility hai.

                          IV. Dark Cloud Candlestick Chart Pattern Ka Amal

                          A. Entry aur Exit Points Ki Tayyari - Dark Cloud Candlestick Chart Pattern ke istemal se traders apne trading strategy ke liye sahi entry aur exit points tay karte hain. - Is pattern ke signals ko samajh kar traders apne trades ko manage karte hain.

                          B. Trend Reversals Ka Pata Lagana - Dark Cloud Candlestick Chart Pattern trend reversals ko identify karne mein madadgar hota hai. - Jab yeh pattern market mein ban jata hai, to traders ko trend reversal hone ki nishani milti hai.

                          V. Dark Cloud Candlestick Chart Pattern Ka Istemal: Trading Mein Kamyabi

                          A. Sahi Tareeqe Se Analysis - Dark Cloud Candlestick Chart Pattern ko sahi tareeqe se analyze karke traders apni trading decisions ko mazeed behtar bana sakte hain. - Is pattern ka sahi istemal karke traders market ke reversals ko sahi tareeqe se samajh sakte hain.

                          B. Risk Management - Sahi risk management ke saath, traders Dark Cloud Candlestick Chart Pattern ke signals ko sahi tareeqe se follow karke apne trades ko control mein rakh sakte hain. - Stop-loss aur profit targets ko set karke traders apne trades ko manage karte hain.

                          VI. Conclusion
                          • Dark Cloud Candlestick Chart Pattern ek mukhtalif bearish reversal pattern hai jo traders ko market ke reversals aur price movements ka andaza lagane mein madad deta hai.
                          • Is pattern ka sahi istemal karke traders apni trading strategy ko mazeed behtar bana sakte hain aur trading mein kamyabi haasil kar sakte hain.
                          • Magar, har trading tool ki tarah, Dark Cloud Candlestick Chart Pattern ka bhi sahi tareeqe se istemal karne ke liye sahi analysis aur risk management zaroori hai.
                          • #14 Collapse

                            Dark cloud candlestick chart pattern


                            "Dark Cloud Cover" ek candlestick chart pattern hai jo technical analysis mein istemal hota hai aur yeh bearish reversal signal provide karta hai. Yeh pattern do consecutive candlesticks se bana hota hai aur uptrend ke baad market mein possible trend reversal ko darust karti hai. Dark Cloud Cover pattern ko samajhne ke liye, aapko candlestick chart ke basic concepts aur price action ka dhyan rakhna hoga.

                            Dark Cloud Cover Pattern Kaise Banata Hai:
                            1. Pehla Candle (Bullish): Dark Cloud Cover pattern ka pehla candle uptrend ke dauran dikhai deta hai, jise ek bullish candle kehte hain. Is candle mein market mein tezi hoti hai aur closing price opening price se zyada hoti hai.
                            2. Dusra Candle (Bearish): Dusra candle pehle wale bullish candle ke upar overlap karta hai. Yeh candle bhi opening price se neeche khulta hai aur throughout the session price mein giravat hoti hai. Iska closing price pehle wale bullish candle ke body ke andar ya uske kareeb hota hai.

                            Dark Cloud Cover Ka Interpretation:

                            Dark Cloud Cover pattern ka interpretation bearish trend reversal ko darust karta hai. Is pattern ka matlb hota hai ki uptrend ke baad market mein selling pressure badh gaya hai aur bears control mein aaye hain. Dusra candle, jo bearish hota hai, pehle candle ke strength ko kam kar deta hai, aur jab yeh first candle ke upar overlap karta hai, toh yeh indication hoti hai ki buyers ka control kamzor ho gaya hai.

                            Key Points to Remember:
                            1. Dark Cloud Cover pattern ko confirm karne ke liye, traders ko doosre din ki price action ko bhi dekhna chahiye. Agar doosre din bhi selling pressure maintain hoti hai, toh yeh confirmation hoti hai ki trend reversal hone ke chances hain.
                            2. Is pattern ki strength ko badhane ke liye, traders doosre technical indicators jaise ki volume analysis, support/resistance levels, ya trend lines ka istemal karte hain.
                            3. Dark Cloud Cover ke reversal signal par depend karke traders apne existing long positions ko close kar sakte hain ya short positions enter kar sakte hain.

                            Ehtiyaat aur Naseehat:
                            1. Dark Cloud Cover pattern ke istemal mein, market conditions aur overall trend ko dhyan se dekhna zaroori hai.
                            2. Confirmatory signals ke liye doosre technical tools ka istemal karna hamesha behtar hota hai.
                            3. Risk management ka khayal rakhna bhi mahatvapurna hai, taaki potential losses ko control kiya ja sake.

                            Dark Cloud Cover pattern ek powerful reversal signal ho sakta hai, lekin har trading decision ko carefully analyze karna aur market conditions ke saath sync karke lena chahiye.
                            • <a href="https://www.instaforex.org/ru/?x=ruforum">InstaForex</a>
                            • #15 Collapse

                              Dark cloud candlestick chart pattern

                              Click image for larger version

Name:	tgg.jpg
Views:	26
Size:	141.0 کلوبائٹ
ID:	12860106

                              Dark Cloud Candlestick Chart Pattern, ek technical analysis tool hai jo traders ko market ke potential reversals ki indication deta hai. Yeh pattern ek bearish reversal pattern hai, jo uptrend ke baad aane wale possible downtrend ko darust karti hai. Is pattern mein do consecutive candles shamil hote hain, jo market sentiment ko reflect karte hain.

                              Dark Cloud Candlestick Pattern Kaise Kaam Karta Hai?

                              Dark Cloud Candlestick Pattern mein pehli candle bullish hoti hai, jo ke uptrend ko darust karti hai. Lekin, dusri candle bearish hoti hai aur uski opening price pehli candle ki upper half mein hoti hai. Dusri candle ki closing price pehli candle ki body ke andar ya uske kareeb hoti hai. Yeh overlap, bearish reversal ki possibility ko highlight karta hai, kyun ki bullish momentum ko kamzor karne ka indication hota hai.

                              Key Features:
                              1. Bullish Trend Indicator: Dark Cloud Candlestick Pattern ka formation uptrend ke baad hota hai, jise pehli candle indicate karta hai.
                              2. Bearish Reversal Signal: Dusri candle ki opening price pehli candle ki upper half mein hoti hai, aur closing price uske andar ya uske kareeb hoti hai, jo bearish reversal ko darust karti hai.
                              3. Overlap of Candles: Dusri candle pehli candle ke upper range mein overlap karta hai, indicating a potential shift in market sentiment.

                              Trading Strategies Using Dark Cloud Pattern:
                              1. Confirmation Ke Liye Wait Karein: Dark Cloud pattern ko confirm karne ke liye, traders ko wait karna chahiye ke agle kuch candles bhi bearish trend ko confirm karte hain.
                              2. Support Aur Resistance Ke Saath Combine Karein: Dark Cloud pattern ko identify karte waqt, traders ko market ke important support aur resistance levels ke saath combine karna chahiye for additional confirmation.
                              3. Volume Ke Saath Dekhein: Pattern ko validate karne ke liye, traders ko volume bhi dekhna chahiye. Agar pattern ke sath high volume ho, toh yeh uski authenticity ko badha deta hai.

                              Conclusion:

                              Dark Cloud Candlestick Pattern ek important tool hai jo traders ko market trends aur reversals ko identify karne mein madad karta hai. Lekin, is pattern ko sahi taur par samajhna aur confirm karna traders ke liye zaroori hai, taki woh sahi trading decisions le sakein. Ismein market conditions, trend strength, aur dusre technical indicators ke saath milake analyze karna bhi important hai.

                              اب آن لائن

                              Working...
                              X