Dark Cloud Candlestick Chart Pattern ki Wazahat:
1. Mabadi (Basics):
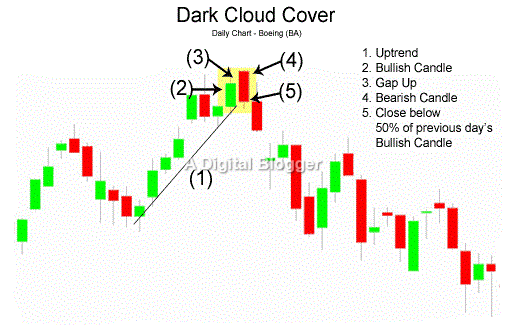
Dark Cloud Cover, ya aam taur par "Dark Cloud" ke naam se jana jane wala pattern, ek bearish reversal signal hai jo candlestick charts mein paaya jaata hai.
2. Components (Hissaat) of the Pattern:
- Pehli Candle: Yeh ek uptrend mein dikhai deti hai aur typically bullish (green ya white) hoti hai. Iski close price pe ooncha hota hai.
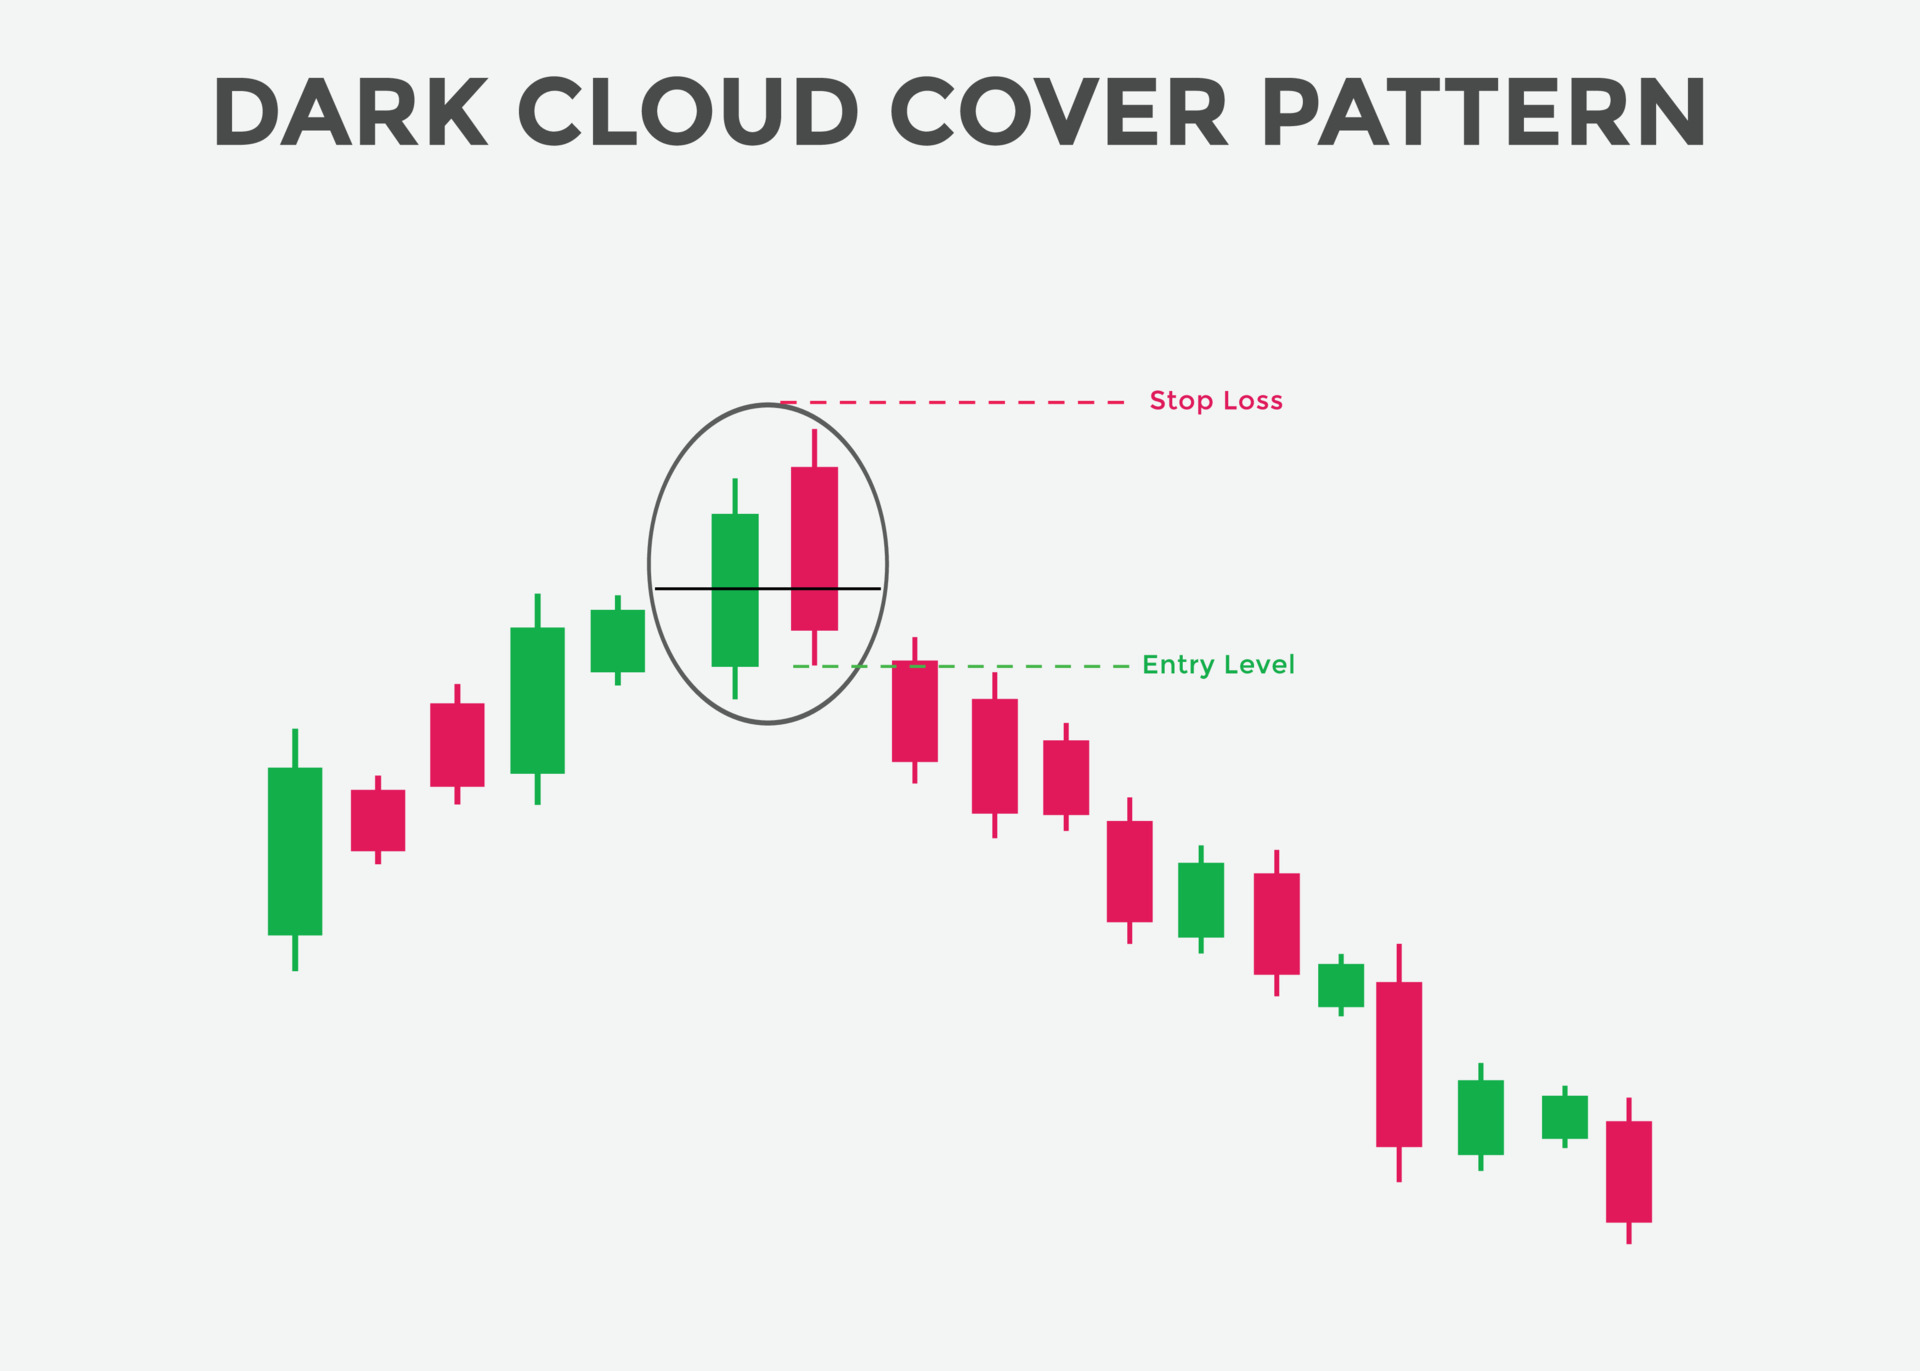
- Dusri Candle: Ismein price gap up ke baad open hoti hai, lekin day ke dauran price neeche ki taraf move karti hai. Dusra candle pehle wale bullish candle ko partially ya poora cover karti hai.
3. Interpretation (Tawil):
Dark Cloud Cover pattern ka matlab hota hai ke current uptrend mein exhaustion (thakan) dikh rahi hai aur bearish trend ka chance hai. Is pattern ko dekh kar traders bearish positions consider kar sakte hain.
4. Trading Implications (Karobar Ke Asraat):
- Entry: Agar aap Dark Cloud pattern ko identify karte hain, toh aapko selling ya short positions enter karne ka signal milta hai.
- Stop Loss: Protective stop loss ko set karne ke liye aap dusri candle ki high ya pattern ke end ki taraf ek level decide kar sakte hain.
- Target Price: Aap target price ke liye pehle support level ya recent lows ko dekh sakte hain.
5. Precautions (Ehtiyaat):
- Hamesha ek confirmatory signal ka wait karein, jaise ki ek aur bearish candle ya kisi aur technical indicator ka confirmation.
- Always risk management ke principles ko follow karein.
6. Conclusion (Ikhtetaam):
Dark Cloud Cover pattern, agar sahi dhang se identify kiya jaye, ek mazboot bearish reversal signal provide karta hai. Lekin, jaise ki har trading strategy ya pattern ke saath hota hai, iska bhi sahi dhang se istemal aur risk management ke saath trading karna zaroori hai.
https://www.google.com/imgres?imgurl...sQMygCegQIARBV


تبصرہ
Расширенный режим Обычный режим