KDJ Indicator ke Basic Components:
X
  • وقت
  • دکھائیں
Clear All
new posts
  • #1 Collapse

    KDJ Indicator ke Basic Components:
    KDJ Indicator ke Basic Components:Tawajju aur Tafseelat:

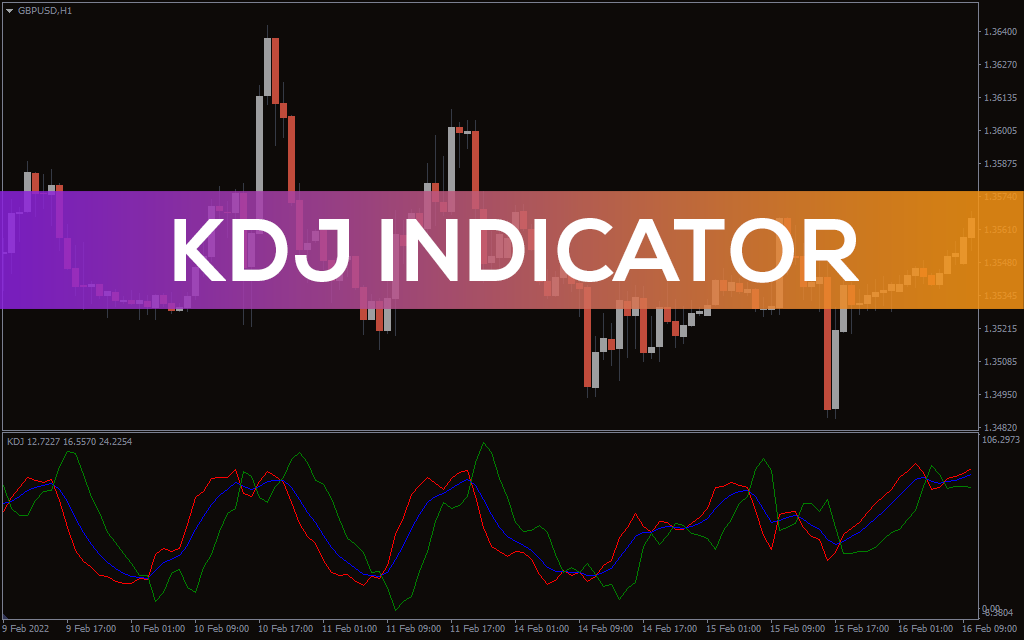
    KDJ Indicator, Stochastic Oscillator ki ek modification hai, jo price momentum aur trend ko evaluate karne ke liye istemal hoti hai. Iska basic structure Stochastic Oscillator ke hi jaisa hota hai lekin isme kuch changes hote hain.

    Iska naam "KDJ" hai jahan K 'fast' line ko represent karta hai, D 'slow' line ko aur J ko 'random' line ko. Yeh indicator price ki volatility aur trend ke sath sath overbought aur oversold conditions ko bhi measure karta hai.

    Iske components hain:
    1. K Line (Fast Line): Yeh Stochastic Oscillator ke fast line ke tarah hoti hai jo current price ko previous price range ke sath compare karta hai. Yeh jaldi change hoti hai, isliye 'fast' line kehte hain.
    2. D Line (Slow Line): Yeh 'slow' line hoti hai jo K line ko smooth karti hai aur ek moving average ka role ada karti hai. Isme previous k periods ke K line ka simple moving average hota hai.
    3. J Line (Random Line): Yeh K line aur D line ke difference ka measure karta hai aur volatility ko represent karta hai. Isme kuch variations hote hain lekin zyadatar traders isko ignore karte hain aur sirf K aur D lines par focus karte hain.

    KDJ Indicator traders ko overbought ya oversold market conditions ko detect karne mein madad karta hai. Overbought condition mein, jab K line D line ko upar se cross karta hai, yeh ek selling signal ho sakta hai. Aur oversold condition mein, jab K line neeche se D line ko cross karta hai, yeh ek buying signal ho sakta hai.

    Is indicator ko samajhne ke liye, traders ko price movements aur iske saath KDJ lines ke movements par nazar rakhni hoti hai taki trend ke changes ko samajh sake aur trading decisions le sake.

    https://www.google.com/imgres?imgurl...oQMygDegQIARBU
    Last edited by ; 20-12-2023, 12:22 PM.
  • <a href="https://www.instaforex.org/ru/?x=ruforum">InstaForex</a>
  • #2 Collapse

    KDJ Indicator ke Basic Components:


    Click image for larger version

Name:	download (22).jpg
Views:	38
Size:	14.3 کلوبائٹ
ID:	12794515
    The KDJ indicator, also known as the Stochastic Oscillator, is a popular technical analysis tool used by traders to identify potential trend reversals and overbought or oversold conditions in the financial markets. Developed by George Lane in the 1950s, the KDJ indicator is based on the premise that as an uptrend progresses, closing prices tend to accumulate near the high end of the trading range, while in a downtrend, closing prices tend to cluster near the low end of the range. The KDJ indicator consists of three main components: the %K line, the %D line, and the signal line.
    1. %K Line (Fast Stochastic): The %K line is the primary component of the KDJ indicator and is sometimes referred to as the Fast Stochastic line. It represents the current closing price relative to the high-low range over a specified period. The formula for calculating the %K line is as follows:

      %�=(Closing Price−Lowest LowHighest High−Lowest Low)×100%K=(Highest High−Lowest LowClosing Price−Lowest Low​)×100

      Typically, the period used for these calculations is set to 14 days, but traders may adjust this value based on their preferences and trading timeframes. A higher %K value indicates that the closing price is closer to the highest high, suggesting upward momentum, while a lower %K value implies proximity to the lowest low, indicating potential downward momentum.
    2. %D Line (Slow Stochastic): The %D line, or Slow Stochastic line, is a three-period simple moving average (SMA) of the %K line. It helps smooth out the %K line's fluctuations, providing a more stable representation of the underlying trend. The formula for calculating the %D line is as follows:

      %�=Simple Moving Average of %K over 3 periods%D=Simple Moving Average of %K over 3 periods

      The %D line is crucial for traders as it acts as a signal line, helping to identify potential crossovers and divergence between %K and %D. Crossovers between these two lines can signal the beginning of a new trend or a reversal in the current trend.
    3. Signal Line: The signal line, often represented as a dashed line on charts, is a three-period simple moving average of the %D line. It provides additional smoothing to the %D line, helping traders identify trends and potential reversals more clearly. The formula for the signal line is as follows:

      Signal Line=Simple Moving Average of %D over 3 periodsSignal Line=Simple Moving Average of %D over 3 periods

      Traders pay close attention to the interactions between the %K line, %D line, and the signal line. Crossovers between %K and %D, as well as their relationship to the signal line, are crucial in generating buy or sell signals.

    In summary, the KDJ indicator is a powerful tool that incorporates the %K line, %D line, and signal line to help traders identify overbought or oversold conditions, potential trend reversals, and the strength of prevailing trends. By analyzing the relationships and movements of these components, traders can make informed decisions about entering or exiting positions in the financial markets. It's important to note that, like any technical indicator, the KDJ should be used in conjunction with other forms of analysis and risk management strategies to maximize its effectiveness in trading decisions.


    • #3 Collapse

      KDJ Indicator forex market mein price trends aur reversals ko identify karne mein istemal hota hai. Ye indicator market ki strength aur weakness ko measure karta hai, is kay kuch main points yeh hain,

      1. KDJ Ki formation:

      KDJ Indicator ka naam Stochastic Oscillator ke three components ko represent karta hai - "K" (Fast Stochastic), "D" (Slow Stochastic), aur "J" (Signal Line). Ye components market trends ko samajhne mein madad karte hain,

      Click image for larger version

Name:	images(52).jpg
Views:	40
Size:	61.5 کلوبائٹ
ID:	12794545

      2. K, D, aur J Components:

      "K" component fast Stochastic ko represent karta hai aur volatility ko measure karta hai, "D" component slow Stochastic ko represent karta hai aur "K" ki smoothing mein madad karta hai aur "J" component ek signal line hoti hai jo "K" aur "D" ke farq se aati hai.

      3. KDJ Ki Calculation:

      KDJ ki calculation price aur time period ke basis par hota hai. Ismein Stochastic Oscillator ka istemal hota hai jise fast aur slow components banate hain,

      4. Significance of KDJ:

      KDJ ka istemal market trends ko confirm karne aur reversals ko predict karne mein hota hai. Is indicator ki madad se traders ko sahi entry aur exit points mil sakte hain,

      5. KDJ Ka Istemal Long-Term Trends Mein:

      KDJ ka istemal long-term trends ko analyze karne mein bhi hota hai. Slow Stochastic component, yaani "D," long-term trends ko better understand karne mein madad karta hai,

      6. Risk Management with KDJ:

      Har trading strategy mein risk management ka istemal karna crucial hota hai. KDJ ke signals ke sath stop-loss orders ka istemal karke traders apne risk ko minimize kar sakte hain,

      7. KDJ Ka Istemal Market Sentiment Ko Samajhne Mein:

      KDJ ka istemal market sentiment ko samajhne mein hota hai. Overbought conditions mei investors optimistic hote hain jabki oversold conditions mei pessimistic hote hain,

      8. KDJ Ke Limitations:

      Jaise har technical indicator ki tarah, KDJ ke bhi kuch limitations hain. Iski sachai aur accuracy depend karti hai ke traders ise sahi taur par interpret karein. Market mein sudden changes aur unexpected events ke bina, KDJ ko galat taur par interpret kiya ja sakta hai.
      • #4 Collapse

        Kdj indicator ke basic components:


        KDJ Indicator ek pramukh technical analysis tool hai, jo financial markets mein istemal hota hai, khaas kar stock aur commodity trading mein. Is indicator ka mool mantra hai market ke momentum aur trend ko samajhna, jisse traders ko sahi waqt par buy ya sell ka faisla karne mein madad milti hai. KDJ ka naam iske mukhya components se aata hai, jo ke %K, %D, aur signal line hote hain.

        %K (Fast Stochastic Oscillator): %K, ya Fast Stochastic Oscillator, market mein hone wale price changes ko measure karta hai. Iska calculation closing price, highest high, aur lowest low ke beech ka ratio hota hai. %K ka formula yeh hai: %K = [(Closing Price - Lowest Low) / (Highest High - Lowest Low)] * 100. %K ka result 0 se 100 ke beech hota hai, jisme se traders market ki strength aur weakness ka andaza laga sakte hain. Higher %K values uptrend ko darust karti hain, jabki lower values downtrend ko indicate karti hain.

        %D (Slow Stochastic Oscillator): %D, ya Slow Stochastic Oscillator, %K ka ek smoothed version hai. Iska calculation 3-day simple moving average (SMA) se hota hai. %D ka formula yeh hota hai: %D = 3-day SMA of %K. %D ka istemal %K ke fluctuations ko kam karke market trends ko saaf dikhane ke liye hota hai. %D, %K ke peeche reh kar ek aur layer of analysis provide karta hai, jisse traders ko aur bhi confident trading decisions lene mein madad milti hai.

        Signal Line: Signal line ek aur important component hai KDJ Indicator ka. Ye %D ka ek aur moving average hota hai, jisse market trends aur reversals ko confirm karna asaan ho jata hai. Aam taur par, signal line ke liye 3-day ka period istemal hota hai. Signal Line ka formula yeh hota hai: Signal Line = 3-day SMA of %D.

        KDJ Indicator ka istemal short-term trading strategies mein hota hai, jisme traders market ke current momentum aur potential reversals ko identify karke apne trading decisions ko optimize karte hain. Yeh ek powerful tool hai jo market analysis mein madadgar hota hai, lekin iska istemal sikhne aur samajhne mein thoda waqt lag sakta hai. Traders ko apne risk tolerance ke hisab se is indicator ko sahi taur par interpret karna chahiye, aur ideally, dusre technical indicators aur market analysis tools ke saath combine karna bhi faydemand ho sakta hai.
        • #5 Collapse

          Introduction,

          Assalamualaikum aj is post me apko me Pakistan Forex Trading ke ak bhot he important topic ke bare me btao ga or me ummed karta ho ke jo information me apse share karo ga wo apke knowledge or experience me zaror izafa kare ge or agar ap mere is post pe amal karte he to ak kamyab trader ban sakte he .

          What is KDJ Indicator,

          KDJ Indicator ek technical analysis tool hai jo market ki volatility aur price movements ko evaluate karne ke liye istemal hota hai. Ismein price ke variations ko measure karne ke liye stochastics ka istemal hota hai. KDJ Indicator mein, K line (fast line), D line (slow line), aur J line (signal line) hote hain jo price ke movements ko represent karte hain. Ye indicator traders ko overbought aur oversold conditions ko identify karne mein madad karta hai aur potential entry ya exit points ko samajhne mein help karta hai.
          Click image for larger version

Name:	QKarLkGj_big.png
Views:	39
Size:	293.2 کلوبائٹ
ID:	12794557

          KGJ indicator,

          KDJ Indicator Forex trading mein istemal hota hai takay traders asset ki overbought ya oversold positions ko identify kar saken. Ye indicator stochastics ki tarah hota hai aur usually price momentum ko evaluate karne ke liye istemal hota hai. KDJ mein three main components hote hain: K line (fast line), D line (slow line), aur J line (signal line). Ye lines price movements ko represent karti hain aur traders ko potential entry aur exit points ke liye guide karti hain.

          KGJ indicator confirmation,

          KDJ Indicator ki confirmation ke liye traders price movements aur indicator ke signals ko combine karte hain. Confirmation ke liye kuch strategies hote hain:
          Click image for larger version

Name:	images (13).jpeg
Views:	32
Size:	55.6 کلوبائٹ
ID:	12794558

          Divergence,

          Price aur KDJ ke signals mein difference ya contradiction dekh kar confirm kiya ja sakta hai. For example, agar price naya high banata hai aur KDJ indicator naya high nahi banata, toh ye divergence ho sakta hai jo trend reversal ko suggest karta hai.

          Overbought &Oversold Conditions ,

          Jab KDJ lines overbought ya oversold zones mein enter karte hain, yani jab K line ya D line specific thresholds ko cross karte hain, toh traders confirmation ke liye price action ko dekhte hain. Agar price action bhi us direction mein confirm karti hai, toh wo ek confirmation signal ho sakta hai.

          Crossover,

          Jab K line D line ko cross karta hai (upward ya downward), ya phir J line D line ko cross karta hai, toh ye bhi confirmation ke liye istemal kiya ja sakta hai. Ismein price action ke saath ye crossovers dekhe jaate hain.

          Volume analysis,

          Some traders KDJ signals ko volume analysis ke saath combine karte hain. Agar price movement ke saath volume bhi increase ho raha hai, toh ye ek additional confirmation provide kar sakta hai.

          Summery,

          Ye confirmation techniques hote hain jo traders KDJ Indicator ke signals ko validate karne ke liye istemal karte hain. Lekin har trader ka approach alag hota hai aur wo apne trading style aur strategy ke hisab se confirmation techniques ko adapt karte hain,Click image for larger version

Name:	images (14).jpeg
Views:	31
Size:	58.6 کلوبائٹ
ID:	12794559
          • #6 Collapse

            KDJ Indicator ke Basic Components:


            KDJ Indicator ek technical analysis tool hai, jo market trends aur momentum ko assess karne ke liye istemal hota hai. Yeh indicator primarily Stochastic Oscillator par based hai, aur iske basic components hain:
            1. %K Line (Fast Stochastic):
              • %K Line ek momentum indicator hoti hai, jo current closing price ko recent trading range ke andar set kiye gaye period ke highest high aur lowest low ke beech express karti hai.
              • Formula: %K = [(Closing Price - Lowest Low) / (Highest High - Lowest Low)] * 100
              • %K line ko fast stochastic bhi kaha jata hai, kyun ki yeh bahut tezi se market changes ko capture karta hai.
            2. %D Line (Signal Line):
              • %D Line %K Line ki moving average hoti hai aur ise signal line bhi kaha jata hai.
              • %D Line ko calculate karne ke liye %K Line ki n-period simple moving average li jati hai.
              • Is line ka istemal trend confirm karne ke liye hota hai.
            3. %J Line:
              • %J Line ek aur derivative hoti hai, jo %K Line aur %D Line ka difference hota hai.
              • Formula: %J = 3 * %D - 2 * %K
              • %J line ko trader momentum ke changes ko identify karne ke liye istemal karte hain.

            KDJ Indicator market mein overbought aur oversold conditions ko bhi highlight karta hai. Traditionally, jab %K Line 80 ke upar jaata hai, toh market overbought maana jata hai, aur jab %K Line 20 ke neeche jaata hai, toh market oversold maana jata hai.

            Traders is indicator ko interpret karke buy ya sell signals generate karte hain. Lekin, jaise ki har technical indicator, KDJ bhi false signals generate kar sakta hai, isliye iska istemal doosre technical analysis tools ke saath kiya jaana chahiye.
            • #7 Collapse

              KDJ Indicator ke Basic Components
              Click image for larger version

Name:	download (1).jpeg
Views:	41
Size:	16.3 کلوبائٹ
ID:	12794576
              KDJ (Keltner Channel, Day Average Price, and Day Exponential Moving Average) Indicator ek technical analysis tool hai jo market trends ko samajhne aur trading decisions banane mein madad karta hai. Is indicator ka naam uske three basic components se aaya hai: Keltner Channel, Day Average Price, aur Day Exponential Moving Average. Yeh indicator primarily stock market aur forex trading mein istemal hota hai.

              1. Keltner Channel (K): Keltner Channel ek volatility-based indicator hai jo price movements ko analyze karta hai. Yeh channel price ke around ek upper band aur ek lower band create karta hai, jisse traders ko market volatility ka andaza ho. Iske calculation ke liye, Average True Range (ATR) ka istemal hota hai. ATR market volatility ko measure karta hai, aur Keltner Channel us information ko incorporate karta hai.

              Keltner Channel ki calculation:
              • Upper Band: Day Average Price + (2 * ATR)
              • Lower Band: Day Average Price - (2 * ATR)

              Yeh bands price ke around ek envelope create karte hain, jo price movements ko analyze karne mein madad karte hain.

              2. Day Average Price (D): Day Average Price simply ek specific time period ke closing prices ka average hota hai. Yeh indicator market ka trend aur direction batane mein madad karta hai. Iske calculation ke liye, aapko ek particular time period ka closing prices add karke uska average nikalna hota hai.

              Day Average Price ki calculation:
              • Sum of closing prices for a specific time period / Number of days in that period

              Day Average Price ko calculate karke, aap market ke recent price movements ko samajh sakte hain.

              3. Day Exponential Moving Average (J): Day Exponential Moving Average (EMA) ek aur important component hai KDJ indicator ka. EMA current price ko emphasize karta hai aur recent price movements ko zyada weightage deta hai. Yeh ek lagging indicator hai, jiska matlab hai ki iska response time slow hota hai lekin yeh reliable hota hai.

              Day Exponential Moving Average ki calculation:
              • EMA = (Closing Price - EMA of Previous Day) * Smoothing Factor + EMA of Previous Day

              Is formula mein, Smoothing Factor ek constant hota hai jo EMA ki sensitivity ko control karta hai. Jitna yeh factor chhota hoga, utni zyada sensitivity hogi.

              KDJ Indicator ka Calculation: Ab, jab hum in teeno components ko samajh gaye hain, to KDJ ka calculation karne mein aasani hogi. Yeh indicator Stochastic Oscillator ki tarah hota hai aur traders ko overbought aur oversold conditions identify karne mein madad karta hai.

              KDJ Calculation:
              • K = 100 * (Closing Price - Lower Band) / (Upper Band - Lower Band)
              • D = 3-day Simple Moving Average of K
              • J = 3 * D - 2 * K

              Is calculation se, KDJ values milte hain jo traders ko market ke momentum aur trend ke bare mein information dete hain. K values 0 se 100 ke beech hote hain aur overbought conditions mein 80 ke upar jate hain, jabki oversold conditions mein 20 ke neeche jate hain.

              KDJ Indicator ka istemal: KDJ indicator ka istemal primarily market trends, reversals, aur potential entry/exit points ko identify karne mein hota hai. Overbought aur oversold conditions ka pata lagana traders ke liye useful hota hai kyunki yeh indicate karta hai ki market mein potential reversal hone ke chances hain.

              Traders KDJ indicator ka istemal karke apne trading strategies ko optimize kar sakte hain aur market ke movements ko better predict kar sakte hain. Yeh ek versatile tool hai jo short-term aur long-term trading mein dono hi istemal ho sakta hai.

              Conclusion: KDJ Indicator ka mool mantra hai market ke trends aur volatility ko samajhna. Iske components – Keltner Channel, Day Average Price, aur Day Exponential Moving Average – saath milke market ke various aspects ko analyze karte hain. KDJ values traders ko overbought aur oversold conditions ka pata lagane mein madad karte hain, jisse unhe better trading decisions lene mein help milti hai. Yeh indicator ek powerful tool hai jo technical analysis mein istemal hone wale kayi tools mein se ek hai. Iske sahi istemal se traders apne trading strategies ko refine kar sakte hain aur market movements ko better understand kar sakte hain.


              • #8 Collapse

                KDJ Indicator ke Basic Components

                Click image for larger version

Name:	download (1).jpeg
Views:	34
Size:	16.3 کلوبائٹ
ID:	12794580
                KDJ (Keltner Channel, Day Average Price, and Day Exponential Moving Average) Indicator ek technical analysis tool hai jo market trends ko samajhne aur trading decisions banane mein madad karta hai. Is indicator ka naam uske three basic components se aaya hai: Keltner Channel, Day Average Price, aur Day Exponential Moving Average. Yeh indicator primarily stock market aur forex trading mein istemal hota hai.

                1. Keltner Channel (K): Keltner Channel ek volatility-based indicator hai jo price movements ko analyze karta hai. Yeh channel price ke around ek upper band aur ek lower band create karta hai, jisse traders ko market volatility ka andaza ho. Iske calculation ke liye, Average True Range (ATR) ka istemal hota hai. ATR market volatility ko measure karta hai, aur Keltner Channel us information ko incorporate karta hai.

                Keltner Channel ki calculation:
                • Upper Band: Day Average Price + (2 * ATR)
                • Lower Band: Day Average Price - (2 * ATR)

                Yeh bands price ke around ek envelope create karte hain, jo price movements ko analyze karne mein madad karte hain.

                2. Day Average Price (D): Day Average Price simply ek specific time period ke closing prices ka average hota hai. Yeh indicator market ka trend aur direction batane mein madad karta hai. Iske calculation ke liye, aapko ek particular time period ka closing prices add karke uska average nikalna hota hai.

                Day Average Price ki calculation:
                • Sum of closing prices for a specific time period / Number of days in that period

                Day Average Price ko calculate karke, aap market ke recent price movements ko samajh sakte hain.

                3. Day Exponential Moving Average (J): Day Exponential Moving Average (EMA) ek aur important component hai KDJ indicator ka. EMA current price ko emphasize karta hai aur recent price movements ko zyada weightage deta hai. Yeh ek lagging indicator hai, jiska matlab hai ki iska response time slow hota hai lekin yeh reliable hota hai.

                Day Exponential Moving Average ki calculation:
                • EMA = (Closing Price - EMA of Previous Day) * Smoothing Factor + EMA of Previous Day

                Is formula mein, Smoothing Factor ek constant hota hai jo EMA ki sensitivity ko control karta hai. Jitna yeh factor chhota hoga, utni zyada sensitivity hogi.

                KDJ Indicator ka Calculation: Ab, jab hum in teeno components ko samajh gaye hain, to KDJ ka calculation karne mein aasani hogi. Yeh indicator Stochastic Oscillator ki tarah hota hai aur traders ko overbought aur oversold conditions identify karne mein madad karta hai.

                KDJ Calculation:
                • K = 100 * (Closing Price - Lower Band) / (Upper Band - Lower Band)
                • D = 3-day Simple Moving Average of K
                • J = 3 * D - 2 * K

                Is calculation se, KDJ values milte hain jo traders ko market ke momentum aur trend ke bare mein information dete hain. K values 0 se 100 ke beech hote hain aur overbought conditions mein 80 ke upar jate hain, jabki oversold conditions mein 20 ke neeche jate hain.

                KDJ Indicator ka istemal: KDJ indicator ka istemal primarily market trends, reversals, aur potential entry/exit points ko identify karne mein hota hai. Overbought aur oversold conditions ka pata lagana traders ke liye useful hota hai kyunki yeh indicate karta hai ki market mein potential reversal hone ke chances hain.

                Traders KDJ indicator ka istemal karke apne trading strategies ko optimize kar sakte hain aur market ke movements ko better predict kar sakte hain. Yeh ek versatile tool hai jo short-term aur long-term trading mein dono hi istemal ho sakta hai.

                Conclusion: KDJ Indicator ka mool mantra hai market ke trends aur volatility ko samajhna. Iske components – Keltner Channel, Day Average Price, aur Day Exponential Moving Average – saath milke market ke various aspects ko analyze karte hain. KDJ values traders ko overbought aur oversold conditions ka pata lagane mein madad karte hain, jisse unhe better trading decisions lene mein help milti hai. Yeh indicator ek powerful tool hai jo technical analysis mein istemal hone wale kayi tools mein se ek hai. Iske sahi istemal se traders apne trading strategies ko refine kar sakte hain aur market movements ko better understand kar sakte hain.


                • #9 Collapse

                  KDJ Indicator ke Basic Components:

                  KDJ Indicator, ek technical analysis tool hai jo market momentum aur trend reversals ko evaluate karne ke liye istemal hota hai. Yeh indicator primarily Stochastic Oscillator ka variation hai, aur iska naam KDJ isliye hai kyunki ismein three components hote hain: K, D, aur J. Yeh hai KDJ indicator ke basic components:
                  1. %K Line (Fast Stochastic):
                    • %K line, ya fast stochastic line, market ke recent closing price ke basis par calculate hoti hai. Ismein current closing price aur predefined lookback period ke highest high aur lowest low shamil hote hain.
                    • %K line market ke momentum ko represent karta hai aur jaldi se badalne wale price movements ko dikhata hai.
                  2. %D Line (Signal Line):
                    • %D line, ya signal line, %K line ka smoothed version hota hai. Ismein %K line ko smooth karne ke liye moving average ka istemal hota hai.
                    • %D line ko slow stochastic bhi kaha jata hai, aur yeh market ke trends ko indicate karta hai. Is line ki help se traders ko confirmations milti hain.
                  3. %J Line (Optional):
                    • %J line ek optional component hota hai aur iska istemal traders ke preference par depend karta hai. %J line ko calculate karne ke liye %K line ka ek specific formula istemal hota hai.
                    • %J line bhi market ke momentum ko dikhata hai, lekin iska istemal kuch traders optional consider karte hain.

                  In teeno components ka ek saath dekha jata hai taake traders ko market ke momentum aur potential reversals ke baare mein information mil sake. Overbought aur oversold conditions ko identify karne mein KDJ indicator ka istemal hota hai, aur iske crossovers se trend changes ko bhi detect kiya ja sakta hai.

                  Yeh zaroori hai ke traders KDJ indicator ka sahi tarah se samajh kar istemal karein aur dusre technical tools aur market analysis ke saath combine karein, taake accurate trading decisions liye ja sakein.
                  • #10 Collapse

                    KDJ Indicator ke Basic Components:

                    Click image for larger version

Name:	download (46).jpeg
Views:	29
Size:	20.6 کلوبائٹ
ID:	12795478


                    "KDJ Indicator," jo ke "Stochastic Oscillator" ka ek variation hai, market trends aur momentum ko evaluate karne ke liye istemal hota hai. Iska naam "K" (stochastic oscillator), "D" (signal line), aur "J" (difference between K and D) ke components se aata hai. Yeh indicator primarily overbought ya oversold market conditions ko detect karta hai.
                    Basic Components of KDJ Indicator:
                    1. %K Line (Stochastic Oscillator):
                      • %K line stochastic oscillator ke taur par hoti hai. Ye measure karta hai ke current closing price kis range mein hai in relation to the high and low prices over a specific period.
                      • Iska formula: %�=Current Close−Lowest LowHighest High−Lowest Low×100%K=Highest High−Lowest LowCurrent Close−Lowest Low​×100
                    2. %D Line (Signal Line):
                      • %D line ko "signal line" bhi kaha jata hai. Ye %K line ka smoothed version hota hai aur market trends ko better visualize karne mein madad karta hai.
                      • Iska formula: %�=3-day Simple Moving Average of %K%D=3-day Simple Moving Average of %K
                    3. %J Line (Difference between %K and %D):
                      • %J line %K aur %D ke darmiyan ka difference ko darust karta hai.
                      • Iska formula: %�=3×%�−2×%�%J=3×%K−2×%D
                    Interpreting KDJ Indicator:
                    • Overbought Conditions:
                      • Jab %K line 80 se zyada ho jata hai, aur %D line bhi usse upar hai, to market overbought condition mein hai. Yeh bearish reversal ko indicate kar sakta hai.
                    • Oversold Conditions:
                      • Jab %K line 20 se kam ho jata hai, aur %D line bhi usse neeche hai, to market oversold condition mein hai. Yeh bullish reversal ko indicate kar sakta hai.
                    • Crossovers:
                      • Jab %K line %D line ko neeche se upar cross karta hai, to yeh ek bullish signal hota hai.
                      • Jab %K line %D line ko upar se neeche cross karta hai, to yeh ek bearish signal hota hai.
                    • Divergence:
                      • Agar price aur KDJ indicator mein divergence hoti hai, to ye potential trend reversal ko indicate kar sakti hai.

                    KDJ indicator ko samajhne aur istemal karne ke liye, traders ko market context aur doosre technical indicators ka bhi istemal karna zaroori hai.
                    Last edited by ; 22-12-2023, 06:08 AM.
                    • <a href="https://www.instaforex.org/ru/?x=ruforum">InstaForex</a>
                    • #11 Collapse

                      -:Forex me KDJ Indicator K Basic Components:-

                      KDJ Indicator Forex market mein use hone wala ek technical indicator hai, jo market trends ko analyze karne aur trading signals generate karne ke liye istemal hota hai. KDJ Indicator ka naam Stochastic Oscillator ka ek variation hai, aur iska basic concept market momentum ko measure karne par adharit hai.


                      -:Forex me KDJ Indicator K Basic Components Ki Wazahat:-

                      KDJ Indicator ke basic components niche diye gaye hain:
                      1. %K Line (Fast Stochastic):

                        %K line, market ke current closing price ke basis par calculate hoti hai. Is line ko "fast stochastic" bhi kehte hain. %K line market ki volatility ko represent karta hai. Formula ye hota hai:

                        %=Current Closing Price - Lowest Low in ’n’ PeriodsHighest High in ’n’ Periods - Lowest Low in ’n’ Periods×100%K=Highest High in ’n’ Periods - Lowest Low in ’n’ PeriodsCurrent Closing Price - Lowest Low in ’n’ Periods​×100

                        Yaha, 'n' periods wo time frame hota hai jisme aap KDJ indicator ko apply kar rahe hain.
                      2. %D Line (Slow Stochastic):

                        %D line, %K line ki smoothing ke liye hoti hai aur isko "slow stochastic" bhi kehte hain. %D line ko calculate karne ke liye aksar 3-period simple moving average (SMA) ka istemal hota hai. Formula ye hota hai:

                        %=3-Period SMA of %%D=3-Period SMA of %K
                      3. %J Line (Signal Line):

                        %J line ko bhi "signal line" kehte hain, aur ye %K line aur %D line ke combination se calculate hoti hai. %J line ko calculate karne ke liye aksar ye formula istemal hota hai:

                        %=3×%−2×%%J=3×%K−2×%D
                      KDJ Indicator ka use primarily overbought (jyada khareeda gaya) ya oversold (jyada becha gaya) market conditions ko identify karne aur trend reversals ko anticipate karne ke liye hota hai. Is indicator ke signals ke interpretation mein traders ka apna approach hota hai, lekin generally, %K line %D line ko upar se cross karte waqt buy signal aur niche se cross karte waqt sell signal consider kiya jata hai.

                      Yeh important hai ki aap kisi bhi indicator ka use karte waqt uske saath doosre technical analysis tools aur risk management strategies ko bhi consider karein.
                      Last edited by ; 10-01-2024, 11:47 AM.

                      اب آن لائن

                      Working...
                      X