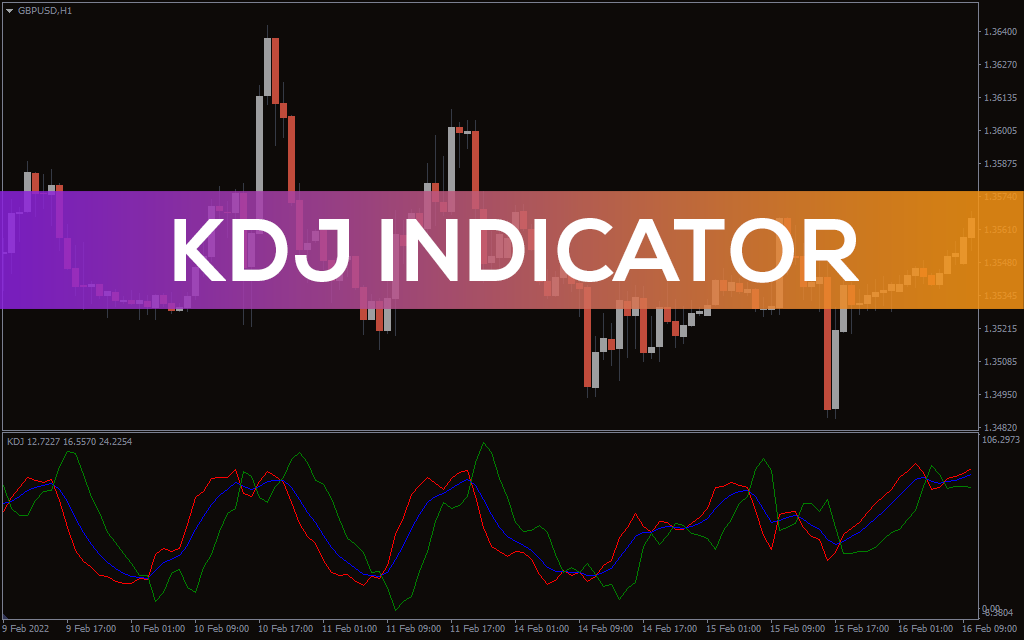
KDJ Indicator ke Basic Components:Tawajju aur Tafseelat:
KDJ Indicator, Stochastic Oscillator ki ek modification hai, jo price momentum aur trend ko evaluate karne ke liye istemal hoti hai. Iska basic structure Stochastic Oscillator ke hi jaisa hota hai lekin isme kuch changes hote hain.
Iska naam "KDJ" hai jahan K 'fast' line ko represent karta hai, D 'slow' line ko aur J ko 'random' line ko. Yeh indicator price ki volatility aur trend ke sath sath overbought aur oversold conditions ko bhi measure karta hai.
Iske components hain:
KDJ Indicator traders ko overbought ya oversold market conditions ko detect karne mein madad karta hai. Overbought condition mein, jab K line D line ko upar se cross karta hai, yeh ek selling signal ho sakta hai. Aur oversold condition mein, jab K line neeche se D line ko cross karta hai, yeh ek buying signal ho sakta hai.
Is indicator ko samajhne ke liye, traders ko price movements aur iske saath KDJ lines ke movements par nazar rakhni hoti hai taki trend ke changes ko samajh sake aur trading decisions le sake.
https://www.google.com/imgres?imgurl...oQMygDegQIARBU
KDJ Indicator, Stochastic Oscillator ki ek modification hai, jo price momentum aur trend ko evaluate karne ke liye istemal hoti hai. Iska basic structure Stochastic Oscillator ke hi jaisa hota hai lekin isme kuch changes hote hain.
Iska naam "KDJ" hai jahan K 'fast' line ko represent karta hai, D 'slow' line ko aur J ko 'random' line ko. Yeh indicator price ki volatility aur trend ke sath sath overbought aur oversold conditions ko bhi measure karta hai.
Iske components hain:
- K Line (Fast Line): Yeh Stochastic Oscillator ke fast line ke tarah hoti hai jo current price ko previous price range ke sath compare karta hai. Yeh jaldi change hoti hai, isliye 'fast' line kehte hain.
- D Line (Slow Line): Yeh 'slow' line hoti hai jo K line ko smooth karti hai aur ek moving average ka role ada karti hai. Isme previous k periods ke K line ka simple moving average hota hai.
- J Line (Random Line): Yeh K line aur D line ke difference ka measure karta hai aur volatility ko represent karta hai. Isme kuch variations hote hain lekin zyadatar traders isko ignore karte hain aur sirf K aur D lines par focus karte hain.
KDJ Indicator traders ko overbought ya oversold market conditions ko detect karne mein madad karta hai. Overbought condition mein, jab K line D line ko upar se cross karta hai, yeh ek selling signal ho sakta hai. Aur oversold condition mein, jab K line neeche se D line ko cross karta hai, yeh ek buying signal ho sakta hai.
Is indicator ko samajhne ke liye, traders ko price movements aur iske saath KDJ lines ke movements par nazar rakhni hoti hai taki trend ke changes ko samajh sake aur trading decisions le sake.
https://www.google.com/imgres?imgurl...oQMygDegQIARBU


تبصرہ
Расширенный режим Обычный режим