Tweezer Bottom Pattern :

No announcement yet.
`
X
  • وقت
  • دکھائیں
Clear All
new posts
  • #1 Collapse

    Tweezer Bottom Pattern :
    Formation and Definition of Tweezer bottom pattern :


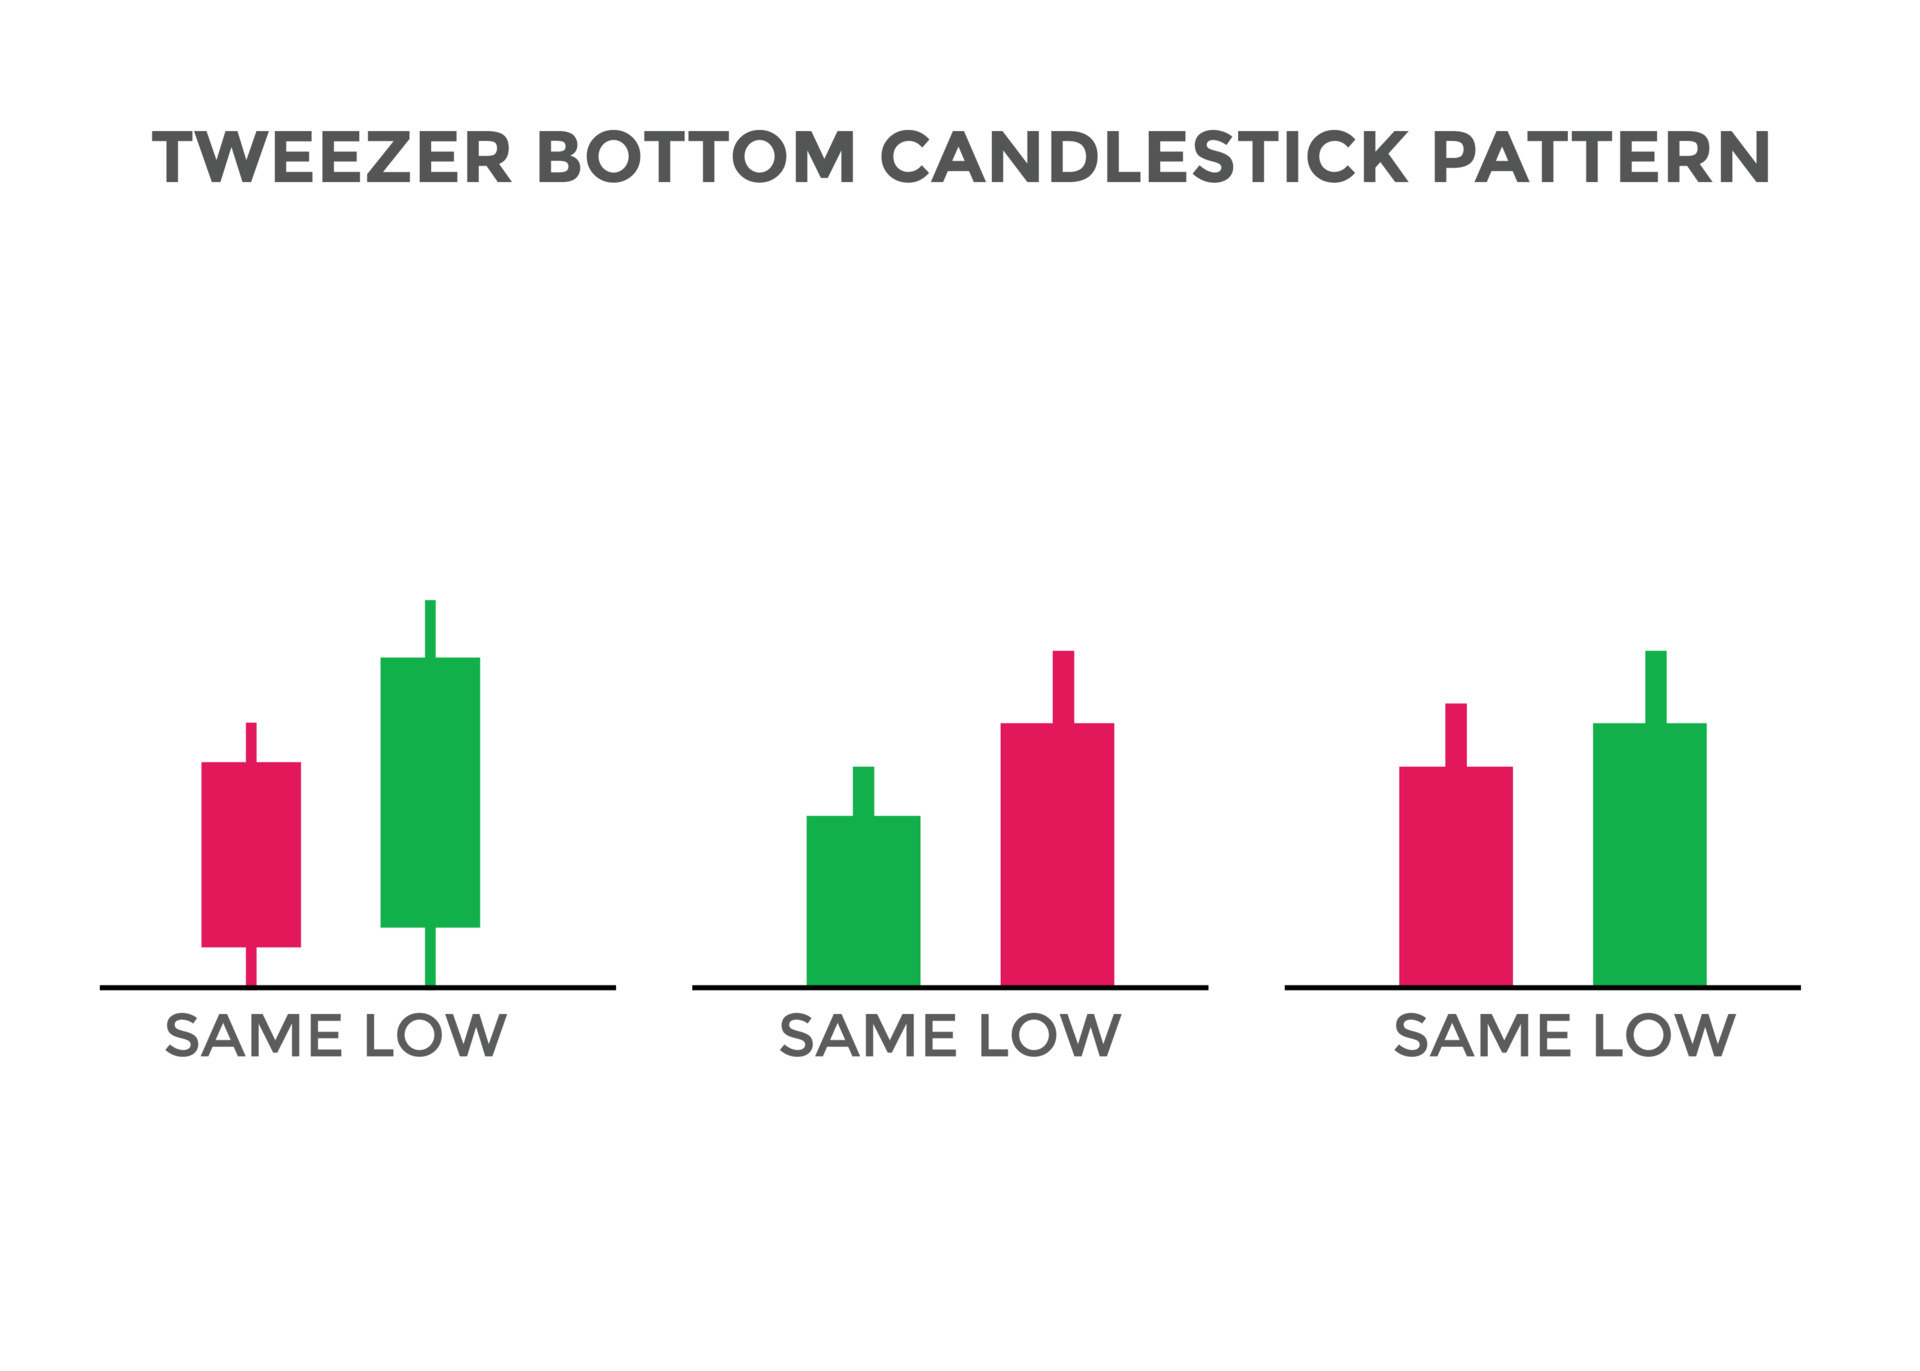
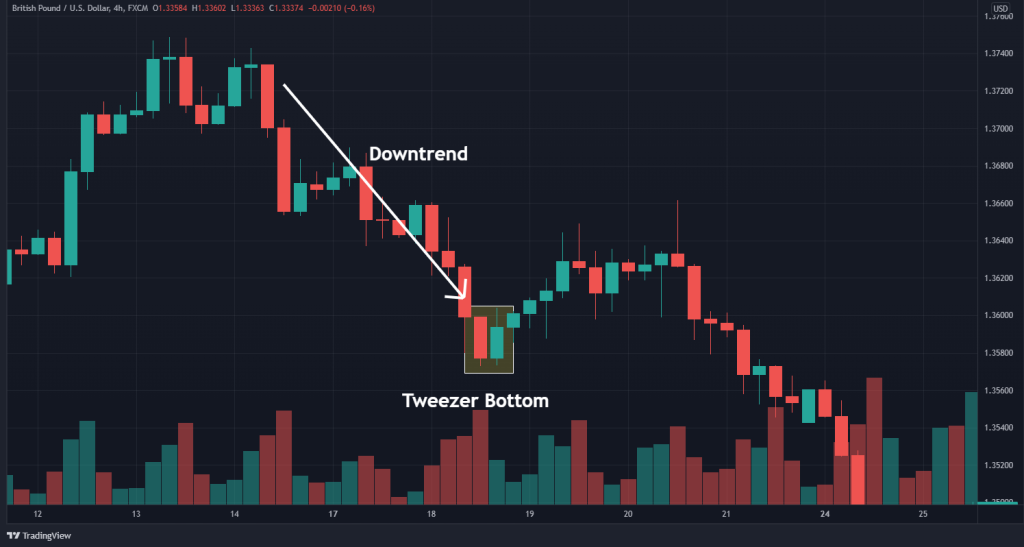
    Tweezer bottom pattern ek candlestick pattern hai jo ek downtrend ke ant mein hota hai aur bazaar ke ehsasat mein mukhtalif mawqe par mohabbat ke inteqal ka ishara deta hai. Is pattern ka jama hona do mared candlesticks se hota hai, jahan pehla candlestick ek bearish candlestick hota hai jo ek naya kam par hota hai aur doosra candlestick ek bullish candlestick hota hai jo pehle candlestick ke barabar kam par hota hai. Is tashkeel ka banawat tweezers ki shakl mein hota hai, is liye isay "tweezer bottom" kehte hain. Is pattern ka matlab hai ke bikro ko apni bikri dabane ki koshish tamam kar chuke hain aur khareedne wale control hasil kar rahe hain.
    ​​​​​​
    Confirmation and Entry Signals in tweezer bottom pattern :


    Tweezer bottom pattern ki tasdeeq ke liye, traders aksar mazeed signs ki talaash karte hain. Aik aam tasdeeq ka sign ziada volume wala bar ya eenhi tweezer bottom ke baad ek bullish candlestick pattern hota hai. Is se yeh samajhaya jata hai ke kharidari mein izafa hua hai aur mogheeb reversal ko mazeed support milraha hai. Traders bullish candlestick ke band hone par ya phir kisi bhi point par jahan par qeemat ka reverse honay ka ishara ho, long position le sakte hain.


    Price Targets and Stop Losses in tweezer bottom pattern :


    Tweezer bottom pattern ki trading karte waqt, risk ka control karne ke liye qeemat ke saaf hadaf aur stop-loss levels ka khayal rakhna ahem hai. Traders apna pahla profit hadaf moojoda swing high ya kisi ahem sarhad level par set kar sakte hain. Woh Fibonacci retracement levels ka bhi istemal karke qeemat ke hadaf tay kar sakte hain. Stop-loss, waise hi, tweezer bottom pattern ki kam se kam qeemat tak ya phir kisi moojoda swing low tak rakh sakte hain takay nuqsaan ka imkaan kam ho.


    Trading Strategy for tweezer bottom pattern :


    Tweezer bottom pattern ka aik maamooli trading strategy ye hai ke tasdeeq ke signs ka intezar karen aur tight stop loss ke sath long position le len. Traders tweezer bottom pattern ko mazeed imkaan ke liye dusre technical indicators ya chart patterns ke saath combine bhi kar sakte hain. For example, woh oscillators par bullish divergence ya hammer ya bullish engulfing pattern jaise bullish reversal patterns ko bhi dekh sakte hain.


    Importance of Risk Management:


    Jaise kisi bhi trading strategy mein, jab tweezer bottom pattern ko trade karte hain toh sahe risk management ka istemal karna bohat zaroori hai. Is mein sahi position size tay karna, stop-loss orders ka istemal karna aur leverage management karna shamil hai. Traders ko bazaar ke halaat aur mogheeb risks se bhi waqif hona chahiye jo pattern ko naqis kar sakte hain. Taaqatwar risk management techniques ka istemal karke, traders nuqsaan ka imkaan kam kar sakte hain aur apne overal trading results ko behtar bana sakte hain.
  • <a href="https://www.instaforex.org/ru/?x=ruforum">InstaForex</a>
  • #2 Collapse

    Tweezer Bottom pattern ek technical analysis ka zaria hai jo forex trading mein istemal hota hai taake currency pair ki keemat mein mukhtalif palat (reversals) ko pehchaan sakein. Ye ek chart pattern hai jo candlesticks ki silsile ke roop mein dikhta hai, jinke bottoms ek horizontal support level banate hain. Is pattern ko Tweezer Bottom is liye kaha jata hai kyunki ye lagta hai jaise koi ne keemat ko chart ki neeche se tweeze pull kiya ho. Tweezer Bottom pattern Tweezer study ke naam par hai, jo John Ehlers ne tayar kiya tha. Tweezer study ek technical indicator hai jo keemat ke levels ko pehchanna ka maqsad rakhta hai jo ke mukhtalif martaba azmaaye gaye hain, jo ke mazboot support ya resistance levels ko darust kartay hain. Tweezer Bottom pattern Tweezer study se nikalne wale patterns mein se aik sab se aam istemal hone wale patterns mein se aik hai.


    The Tweezer Study and Its Significance

    Tweezer Bottom pattern kam az kam do candlesticks se milta hai jo ke ek hee keemat par bottoms rakhte hain. Ye candlesticks kisi bhi rang ke ho sakti hain, lekin inke wicks (shadows) candlestick ke jism se ooper aur neeche tak phailte hain. Ye wicks ishara karte hain ke is level par keemat ko mukhtalif martaba azmaaya gaya hai aur khareednay walay ne keemat ko dobara buland karnay ke liye kadam uthaya hai. In bottoms se banaye gaye horizontal support level ki pehchan karna Tweezer Bottom pattern ko pehchannay mein khasiyat rakhta hai. Ye level aik esa area hai jahan khareednay walay tayyar hain keemat ko buland karnay ke liye kadam uthanay ke liye. Jitni zyada bar is level ko azmaaya jata hai, utni mazbooti se support hoti hai, aur jis se keemat palat kar buland hoti hai.

    Application of Tweezer Bottom in Trending Markets

    Tweezer Bottom pattern ko trending aur non-trending dono markets mein istemal kiya ja sakta hai. Trending markets mein, ye ek mojooda trend mein palat (reversal) ke potential ko pehchannay ke liye istemal kiya ja sakta hai. Misal ke taur par, agar kisi currency pair ki keemat kuch dinon se kam ho rahi hai, aur phir do ya is se zyada candlesticks ne ek khaas keemat par bottoms banaye hain, to ye ishara ho sakta hai ke trend palatne wala hai. Non-trending markets mein, jahan keematien side mein ya range mein hain, Tweezer Bottom pattern ko khareednay ke potential mouqay ki pehchan mein istemal kiya ja sakta hai. Jab keematien side mein hain, to ye mushkil ho sakta hai ke aglay kis rukh mein jayengi. Lekin agar do ya is se zyada candlesticks ne ek khaas keemat par bottoms banaye hain, to ye ishara ho sakta hai ke khareednay walay keemat ko dobara buland karnay ke liye kadam utha rahe hain.


    Tweezer Bottom pattern ko forex trading mein istemal karte waqt, kuch steps ko follow kerna hota hai:
    • Identify a strong horizontal support level: Kam az kam do candlesticks dhoondain jinke bottoms ek hee keemat par hon. Jitni zyada bar ye level azmaaya gaya ho, utni mazbooti se support banaygi.
    • Confirm buying pressure: Aise candlesticks dhoondain jo is level par lambay neechay ke shadows (wick) ke saath hain, jo ishara karte hain ke is level par khareednay walay ne keemat ko buland karnay ke liye kadam uthaya hai.
    • Wait for confirmation: Tweezer Bottom pattern par trade karnay se pehle, tasdeeq karen ke keemat sach mein palat rahi hai ya nahi. Ye hosakta hai ke bullish candle is horizontal support level ke ooper ban rahi ho ya phir kisi qareebi resistance level ko paar kar rahi ho.
    • Set stop-loss and profit targets: Tweezer Bottom pattern par trade mein dakhil hone ke baad, apne risk management strategy ke mutabiq stop-loss aur profit targets tay karen. Hamesha yaad rakhen ke apne nuksan ko had mein rakhne aur apne capital ko bachane ke liye stop-loss orders istemal karen.
    • Monitor your trade: Apne trade ko barqarar rehnay dekhen aur market ki hawalat ke mutabiq apne stop-loss aur profit targets ko zarurat ke mutabiq tabdeel karen. Tayyar rahein ke agar keemat aapke khilaf chali jati hai ya phir aapka profit target hasil hojata hai to trade se bahir nikalne ke liye.
    Believe in yourself and your abilities. When you fight for your dreams, you can achieve anything.
    • #3 Collapse

      Tweezer bottom pattern :


      Click image for larger version

Name:	tvz.gif
Views:	51
Size:	17.6 کلوبائٹ
ID:	12787776


      Tweezer Bottom Pattern, technical analysis mein ek reversal pattern hai jo candlestick charts par dikhai deta hai. Yeh pattern downtrend ke baad trend reversal ko suggest karta hai aur traders ko potential buying opportunities ke liye alert karta hai. Tweezer Bottom Pattern do candlesticks se banta hai, jisme pehla candlestick ek downtrend ko indicate karta hai aur doosra candlestick neeche ki taraf ek reversal signal provide karta hai.

      Tweezer Bottom Pattern Ka Formation:
      1. Pehla Candlestick (Downtrend): Tweezer Bottom Pattern ka formation pehle ek downtrend ke dauran hota hai. Is phase mein, market mein selling pressure hoti hai aur price downtrend mein move karta hai. Pehla candlestick bearish hota hai.
      2. Doosra Candlestick (Reversal Signal): Doosre candlestick ka size pehle ke candlestick ke approximately equal hota hai, lekin yeh bullish candle hota hai. Iska matlab hai ki sellers initially control mein the, lekin phir buyers ne control le liya hai, aur price neeche ki taraf jaane ki jagah reversal ke liye ready hai.

      Tweezer Bottom Pattern Ka Trading Strategy:
      1. Confirmation with Volume: Tweezer Bottom Pattern ko confirm karne ke liye, traders ko volume ke sath dekhna chahiye. Agar doosre candlestick ke sath volume bhi badh raha hai, toh yeh indication hai ki reversal strong ho sakta hai.
      2. Entry Point and Stop-Loss:
        • Long position enter karne ka time hota hai jab tweezer bottom pattern form ho raha hota hai.
        • Stop-loss order set karna important hai taki aap apne losses control mein rakh saken.
      3. Take-Profit Levels:
        • Traders ko take-profit levels set karna chahiye, jo ki technical analysis, support/resistance levels, ya doosre relevant indicators par based ho sakte hain. Yeh levels help karte hain ki traders apne profits secure kar sakein.
      4. Divergence Check:
        • Tweezer Bottom Pattern ke trade se pehle, traders ko momentum indicators jaise ki RSI (Relative Strength Index) ka bhi check karna chahiye. Agar price aur indicator mein positive divergence hai, toh yeh reversal signal ko aur bhi strong bana sakta hai.
      5. Market Context:
        • Tweezer Bottom Pattern ke signals ko samajhne ke liye overall market context ko bhi consider karna important hai. Agar kisi khaas event ya news ke wajah se downtrend tha, toh yeh pattern us event ke baad hone wale market sentiment change ko bhi reflect kar sakta hai.

      Tweezer Bottom Pattern ek powerful reversal indicator ho sakta hai, lekin market mein risk hamesha hota hai. Har ek trading decision ko dhyan se lena chahiye aur risk management ko priority dena chahiye.
      • #4 Collapse

        Tweezer bottom pattern :


        Click image for larger version

Name:	tbvz.png
Views:	63
Size:	29.8 کلوبائٹ
ID:	12787827


        Tweezer Bottom Pattern ek technical analysis pattern hai jo khaas tor par candlestick charts mein paya jata hai. Ye pattern market mein hone wale trend ka reversal signal deta hai, jisse market ke bearish trend se bullish trend mein badalne ki sambhavna hoti hai. Yahan par Tweezer Bottom Pattern ke hawale se tafseelat di ja rahi hain:

        Tweezer Bottom Pattern tab banta hai jab market mein ek downtrend chal raha hota hai aur is pattern mein do candlesticks shamil hote hain.

        Pehla Candlestick: Pehla candlestick bearish hota hai, jo ke market mein sellers ki control ko darust karta hai. Ye indicate karta hai ke existing downtrend jari hai aur sellers market par apna control jari rakh rahe hain.

        Dusra Candlestick: Dusra candlestick bullish hota hai, jise green ya white color se darust kiya jata hai. Is candlestick ka feature hota hai ke iski low value pehle wale bearish candlestick ki low value ke barabar hoti hai ya phir iske bohot qareeb hoti hai. Is wajah se yeh pattern "tweezer" ke naam se mashhoor hai, kyun ke candlesticks ki wicks ek doosre ke sath match karte hain, jaise tweezer ki tangain.

        Tweezer Bottom Pattern ka matlub hai ke market mein selling pressure ke baad buying interest aane laga hai. Yeh ek potential trend reversal ko darust karta hai aur traders ko ye signal deta hai ke ab market mein bullish movement ka start ho sakta hai. Lekin hamesha yaad rakha jaye ke kisi bhi technical indicator ya pattern ki tarah, Tweezer Bottom bhi 100% confirm nahi hota. Traders ko dusre technical analysis tools aur market ke overall context ko bhi madde nazar rakhna chahiye jab is pattern ko interpret karte hain.

        In conclusion, Tweezer Bottom Pattern ek powerful reversal indicator ho sakta hai agar ise sahi tarah se samjha jaye aur dusre factors ke saath combine kiya jaye. Isse traders ko market ke potential changes ka pata chalta hai, lekin hamesha risk management ko madde nazar rakhte hue iska istemal karna chahiye.
        • #5 Collapse

          Tweezer bottom pattern
          Click image for larger version

Name:	download (45).png
Views:	56
Size:	5.5 کلوبائٹ
ID:	12787842


          "Tweezer Bottom Pattern" ek technical analysis chart pattern hai jo market charts par dikhai deta hai aur reversal signals provide karta hai. Yeh pattern downtrend ke baad market mein possible trend reversal ko indicate karta hai. Chaliye is pattern ko detail mein samajhte hain:

          Tweezer Bottom Pattern Ki Khasoosiyat:
          1. Two Candlesticks Hote Hain:
            • Tweezer Bottom Pattern mein do candlesticks hote hain - pehla candlestick bearish hota hai aur dusra candlestick bullish hota hai. Dono candlesticks ka close price aapas mein kareeb hota hai.
          2. Downtrend Ke Baad Aata Hai:
            • Tweezer Bottom pattern typically downtrend ke baad develop hota hai. Is pattern ko dekhte huye traders ko lagta hai ke selling pressure kamzor ho rahi hai aur buyers market mein control le rahe hain.
          3. Equal Lows:
            • Dono candlesticks ke low prices lagbhag barabar hote hain, jo downtrend ke indication ke roop mein hai.
          4. Volume Ka Dhyan Rakhein:
            • Tweezer Bottom pattern ke formation ke samay volume ka bhi analysis kiya jata hai. Agar tweezer bottom ke formation ke sath high volume dikhe, toh yeh indicate karta hai ke reversal strong ho sakta hai.

          Tweezer Bottom Pattern Identifying Steps:
          1. Downtrend Ko Identify Karein:
            • Pehle toh dekhein ke market mein existing downtrend hai ya nahi.
          2. Equal Lows Ko Check Karein:
            • Tweezer bottom pattern ke liye do candlesticks ki low prices ko check karein. Dono ke lows lagbhag same hone chahiye.
          3. Volume Ka Analysis Karein:
            • Pattern ke formation ke samay volume ko bhi analyze karein. High volume ke sath pattern hone par reversal ki strength badh sakti hai.

          Tweezer Bottom Pattern Trading Strategy:
          1. Entry Point Set Karein:
            • Jab aap tweezer bottom pattern ko identify karte hain aur doosre confirmatory signals ke saath milta hai, tab entry point set karein.
          2. Stop-Loss Aur Target Levels Set Karein:
            • Trading ke dauran stop-loss aur target levels set karein takay aap apne trades ko control mein rakh sakein.
          3. Confirmatory Indicators Ka Istemal Karein:
            • Tweezer bottom pattern ko confirm karne ke liye doosre technical indicators ya price action signals ka bhi istemal karein.

          Hamesha yaad rakhein ke market dynamics hamesha change hote hain, isliye ek single pattern par pura bharosa na karein. Multiple indicators aur thorough analysis ka istemal prudent trading ke liye important hai.
          • #6 Collapse

            Tweezer Bottom Pattern :

            Tweezer Bottom pattern ek bullish reversal candlestick pattern hai. Ismein do consecutive candles hote hain jinmein lower shadows same level pe form hote hain. Pehli candle bearish hoti hai aur dusri candle bullish hoti hai. Ye pattern indicate karta hai ki downtrend ke baad market mein bullish momentum aa sakta hai. Confirmation ke liye, dusre din ki price action ko observe karna zaruri hai. Trading decisions lene se pehle apne financial goals aur risk tolerance ko samjhein.

            Click image for larger version

Name:	1701836974892.jpg
Views:	41
Size:	72.1 کلوبائٹ
ID:	12787858

            Trade with Tweezer Bottom Pattern :

            Tweezer Bottom pattern ke sath trade karne ke liye, aap ye steps follow kar sakte hain:
            1. Identify the pattern:

            Pehle toh aapko Tweezer Bottom pattern ko identify karna hoga. Iske liye aapko do consecutive candles with same level ke lower shadows dekhne honge.

            2. Wait for confirmation:

            Pattern ko confirm karne ke liye, aapko dusre din ki price action ka wait karna hoga. Agar price dusre din bhi upar ja rahi hai, toh ye pattern aur bhi powerful ho jata hai.

            3. Entry point:

            Jab aapko pattern ka confirmation mil jaye, tab aap entry point decide kar sakte hain. Aap entry point ke liye pehli bullish candle ke high level ko consider kar sakte hain.

            4. Stop loss:

            Stop loss zaroor set karein, taki aap apne risk ko manage kar sakein. Aap stop loss ko pattern ke low level ke neeche set kar sakte hain.

            5. Target:

            Aap apne target level ko decide kar sakte hain, jismein aapko profit book karna hai. Aap previous swing high level ya technical indicators ka use kar sakte hain.

            6. Risk management:

            Hamesha apne risk ko manage karein aur apne trade size ko apne risk tolerance ke hisab se adjust karein.

            Yeh steps aapko Tweezer Bottom pattern ke sath trade karne mein madad karenge. Lekin hamesha yaad rakhein ki trading mein risk involved hota hai, isliye apne trades ko carefully plan karein aur apne financial goals ko samjhein.

            Characteristics of Tweezer Bottom Pattern :

            Tweezer Bottom pattern ke kuch key characteristics hain:

            1. Reversal pattern:

            Tweezer Bottom pattern ek bullish reversal pattern hai, jiske baad market direction change ho sakta hai.

            2. Consecutive candles:

            Is pattern mein, do consecutive candles hote hain. Pehli candle bearish hoti hai, jabki dusri candle bullish hoti hai.

            3. Same level ke lower shadows:

            ​​​​​Dono candles ke lower shadows same level pe form hote hain. Ye indicate karta hai ki selling pressure kam ho rahi hai aur buying pressure badh rahi hai.

            4. Downtrend ke baad:

            Tweezer Bottom pattern generally downtrend ke baad form hota hai. Iska matlab hai ki jab market down ho raha hota hai aur fir se reversal hone ki possibility hai.

            5. Confirmation:

            Is pattern ko confirm karne ke liye, aapko dusre din ki price action ka wait karna hota hai. Agar price dusre din bhi upar ja rahi hai, toh ye pattern aur bhi reliable ho jata hai.
            Last edited by ; 06-12-2023, 09:30 AM.
            • #7 Collapse


              Significance Of Candlesticks In Trading Chart.

              Candle Patterns currency pairs and commodities donu ki price trading chart mein market price ki development ko track kerna k liye use honay wala most significant specialized pattern h. forex trading mien mostly traders kisi bhi currency pair ya item ko purchase ya sell kernay k liye candle designs per depend krtay hn.

              Tweezer Bottom Pattern,s Detail.

              Tweezer Bottom Candlestick Pattern (ONE) bullish pattern inversion candle pattern hai jo currency aur commodities k chart me long negative pattern k base pe creat hota h. es pattern me two candle same open and close hoti hn, candles k es pattern ko Tweezer Bottom Candlestick Pattern kehtay hn.ab hm es pattern ki mazeed detail and pics dekhty hn.

              Distinguishing proof Of Tweezer Bottom Pattern.

              tweezer bottom candle pattern (TWO) candles pe depended bullish candle pattern hai jo support level per creat hota h.es pattern ki first candle one long genuine body ki negative Murobuzu candle show hoti ha.pattern me second candle bhi same loong genuine body ki bullish Murobuzu candle creat hoti aur first candle k close level k equivalent open hoti h..

              Trading Plan For Tweezer Bottom Pattern.

              trading chart pe price jb over and over dismissal face krti hain to ye position backing and opposition level creat ho jata h. Tweezers bottom pattern me bhi candles same base point ko twofold time contact karti hain jis reason se solid help level bn jata hai. tweezer bottom pattern pe trading krny se pehle design ka long time acclaims mn hona necessary hai sometimes ye brief periods of time pe ye confirm nai hota. aur pattern affirmation bullish candle ki genuine body me creat hona chaheye. pattern k confirmation k leye markers ko use kerna chahye .

              Stop Loss.

              effective trading k leye stop loss ko tweezer bottom pattern ki lower side pe two candles k support level k nichy set karen.aur agr stop loss hit ho bhi jaye to ziada loss na ho.
              • #8 Collapse

                Tweezer Bottom Pattern
                Click image for larger version

Name:	Tweezer-Patterns-pic-1.jpg
Views:	57
Size:	50.3 کلوبائٹ
ID:	12787857


                Tweezer Bottom pattern ek candlestick pattern hai jo market analysis mein istemal hota hai, aur ye ek bullish reversal signal provide karta hai. Ye pattern generally downtrend ke baad dekha jata hai aur indicate karta hai ki market mein bearish momentum kam ho raha hai aur buyers apne positions ko strengthen kar rahe hain.

                Tweezer Bottom pattern ka structure do consecutive candles par mabni hota hai:
                1. First Candle (Bearish):
                  • Pehli candle ek downtrend ke dauran dikhai deti hai aur bearish hoti hai, matlab ki iska closing price neeche ki taraf jaane wale hain.
                2. Second Candle (Bullish):
                  • Dusri candle bhi bearish candle ke baad aati hai, lekin iska opening price pehli candle ke closing price ke kareeb hota hai ya usi ke barabar hota hai. Iske baad, ye candle bullish move karta hai aur iska closing price pehli candle ki opening price ke kareeb hota hai ya usi ke barabar hota hai.

                Ye pattern is liye "tweezer" kaha jata hai kyunki dono candles ki low prices ek dusre ke bohot qareeb hoti hain, jaise ke tweezer ki tangon ki shape hoti hai.

                Tweezer Bottom pattern ka interpretation yeh hai ki jab market mein selling pressure kam hoti hai aur ek downtrend ke baad ye pattern banata hai, toh ye indicate karta hai ki bears apne control mein kamzor mehsoos kar rahe hain aur buyers ko control milne wala hai. Traders ise bullish reversal ka ek early indication samajh kar, apne trading decisions ko shape karte hain.

                Hamesha yaad rahe ke koi bhi pattern ya indicator puri tarah se fail-safe nahi hota aur market conditions ke mutabiq badal sakta hai. Isliye, trading decisions lene se pehle market context aur doosre technical indicators ka bhi dhyan rakhein.
                • #9 Collapse


                  Introduce and Formation of Tweezer Bottom Candles:


                  Aoa Ummid karta hon Ap Sab khariat Say hon gy AJ Tweezer backside pattern ek candlestick pattern hai jo ek downtrend ke ant mein hota hai aur bazaar ke ehsasat mein mukhtalif mawqe par mohabbat ke inteqal ka ishara deta hai. Is pattern ka jama hona do mared candlesticks se hota hai, jahan pehla candlestick ek bearish candlestick hota hai jo ek naya kam par hota hai aur doosra candlestick ek bullish candlestick hota hai jo pehle candlestick ke barabar kam par hota hai. Is tashkeel ka banawat tweezers ki shakl mein hota hai, is liye isay "tweezer bottom" kehte hain. Is sample ka matlab hai ke bikro ko apni bikri dabane ki koshish tamam kar chuke hain aur khareedne wale manage hasil karein gy
                  ​​​​​​

                  Tweezers bottom Pattern and Confirmation and Entry Point Signals:


                  Dear Jab Tweezer bottom sample ki tasdeeq ke liye, buyers aksar mazeed signs ki talaash karte hain. Aik aam tasdeeq ka signal ziada quantity wala bar ya eenhi tweezer bottom ke baad ek bullish candlestick sample hota hai. Is se yeh samajhaya jata hai ke kharidari mein izafa hua hai aur mogheeb reversal ko mazeed support milraha hai. Traders bullish candlestick ke band hone par ya phir kisi bhi point par jahan par qeemat ka opposite honay ka ishara ho, lengthy role asaani Say


                  Price Targets and Stop Loss with Tweezers bottoms:


                  Dear Tweezer backside sample ki buying and selling karte waqt, chance ka manage karne ke liye qeemat ke saaf hadaf aur forestall-loss ranges ka khayal rakhna ahem hai. Traders apna pahla income hadaf moojoda swing high ya kisi ahem sarhad stage par set kar sakte hain. Woh Fibonacci retracement stages ka bhi istemal karke qeemat ke hadaf tay kar sakte hain. Stop-loss, waise hi, tweezer bottom sample ki kam se kam qeemat tak ya phir kisi moojoda swing low tak rakh sakte hain takay nuqsaan ka imkaan kam Karna Zroori:


                  Trading Strategies and Tweezers Bottom pattern :


                  Dear Jab bh Tweezer backside sample ka aik maamooli trading approach ye hai ke tasdeeq ke symptoms ka intezar karen aur tight forestall loss ke sath lengthy role le len. Traders tweezer bottom sample ko mazeed imkaan ke liye dusre technical signs ya chart patterns ke saath combine bhi kar sakte hain. For instance, woh oscillators par bullish divergence ya hammer ya bullish engulfing sample jaise bullish reversal styles ko bhi dekh sakte hain.


                  Risk Management ka Used:


                  Dear Jaise kisi bhi trading strategy mein, jab tweezer bottom sample ko trade karte hain toh sahe danger control ka istemal karna bohat zaroori hai. Is mein sahi role length tay karna, forestall-loss orders ka istemal karna aur leverage control karna shamil hai. Traders ko bazaar ke halaat aur mogheeb risks se bhi waqif hona chahiye jo sample ko naqis kar sakte hain. Taaqatwar chance management strategies ka istemal karke, investors nuqsaan ka imkaan kam Karen gy aor Benefits Used Karen gy
                  • #10 Collapse

                    Tweezer bottom pattern :


                    Click image for larger version

Name:	hbjn.jpg
Views:	45
Size:	50.3 کلوبائٹ
ID:	12788204


                    Tweezer Bottom Pattern ek technical analysis ka tajaweezati pattern hai jo ke financial markets mein istemal hota hai. Yeh pattern chart analysis mein istemal hota hai taki traders aur investors ko market ke mizaj ka andaza lagaya ja sake, khaas kar ke jab ek downtrend ke baad reversal hone ki ummeed ho.


                    Tweezer Bottom Pattern do mukhtalif candlesticks se banta hai, jo ke aam taur par ek bearish (down) trend ke ant mein paaya jaata hai. Pehla candlestick ek bearish candle hoti hai jo ke selling pressure ko darust karti hai. Iske baad, ek bullish (up) candle aata hai jiska opening price pehle candle ke closing price ke barabar hoti hai ya phir us ke qareeb hoti hai. Is tarah ke do candlesticks ka milna julna ek tweezers ki tarah dikhta hai, is liye ise "Tweezer Bottom" kehte hain.


                    Is pattern ka matlab hai ke market mein selling pressure kamzor ho rahi hai aur buyers control mein aarahe hain. Jab yeh pattern ban jata hai, toh yeh indicate karta hai ke downtrend ki intensity kam ho sakti hai aur uptrend ki shuruwat hone ke chances hain. Traders is signal ko dekhar apne trading strategies ko adjust kar sakte hain.


                    Halaanki, har pattern ki tarah, Tweezer Bottom Pattern ka bhi 100% confirmation nahi hota. Iske saath saath, market mein aur factors jaise ke trading volume, trend strength, aur overall market conditions ko bhi madde nazar rakha jana chahiye. Technical analysis ke mazbooti se istemal ke liye, traders ko chart patterns ke alawa bhi doosre indicators aur tools ka istemal karne ki salahiyat honi chahiye.


                    In conclusion, Tweezer Bottom Pattern ek useful tool hai jo market ke potential reversal ko point out karne mein madadgar ho sakta hai. Lekin, isay sahi tarah se samajhne aur istemal karne ke liye, traders ko market ke mizaj aur doosre factors ka bhi tajziya karna hoga.
                    • <a href="https://www.instaforex.org/ru/?x=ruforum">InstaForex</a>
                    • #11 Collapse

                      Tweezer Bottom Pattern :

                      Click image for larger version

Name:	download (49).png
Views:	51
Size:	5.5 کلوبائٹ
ID:	12788223


                      Tweezer Bottom Pattern (Tweezer Bottom Pattern):

                      1. Ta'aruf (Introduction):
                      • Tweezer Bottom Pattern ek bullish reversal candlestick pattern hai jo market mein downtrend ke baad aata hai. Is pattern mein do consecutive candles hote hain jinmein se pehli candle bearish hoti hai aur doosri candle bullish hoti hai. Dono candles ki low prices barabar ya bohot qareeb hoti hain.

                      2. Kaise Hota Hai (Formation):
                      • Tweezer Bottom Pattern tab banta hai jab do consecutive candles hote hain. Pehli candle ek downtrend ke doran aati hai aur bearish hoti hai. Doosri candle uski low price ke bohot qareeb open hoti hai, lekin fir se bullish ho jati hai aur uski closing pehli candle ke low price ke bohot qareeb hoti hai.

                      3. Matlab (Meaning):
                      • Tweezer Bottom Pattern ka appearance indicate karta hai ke market mein bearish trend ke baad buying interest aane laga hai aur bullish reversal hone ke chances hote hain.

                      4. Trading Strategy (Trading Strategy):
                      • Tweezer Bottom Pattern ko dekhte hue, traders ko long position lena ka soch sakte hain, ya phir existing short positions ko close kar sakte hain.

                      5. Savdhanaiyan (Cautions):
                      • Tweezer Bottom Pattern ke signals ko hamesha confirmatory factors ke saath dekhein. False signals ka bhi khadsha hota hai, isliye dhyan rakhna important hai.
                      • Market conditions ko bhi madde nazar rakhein. Tweezer Bottom Pattern ke formation ke baad, market ke doosre factors ko bhi monitor karein.

                      6. Trading Mein Istemal (Application in Trading):
                      • Tweezer Bottom Pattern ko individual trading decision lene ke liye istemal kiya ja sakta hai, ya phir ise doosre technical indicators ke saath mila kar ek comprehensive strategy ka hissa banaya ja sakta hai.

                      Tweezer Bottom Candlestick Pattern, jab sahi taur par samjha jata hai aur doosre indicators ke saath mila kar dekha jata hai, toh ye traders ko potential trend reversal ko identify karne mein madad karta hai.

                      اب آن لائن

                      Working...
                      X