Rail Candlestick Pattern
No announcement yet.
X
  • وقت
  • دکھائیں
Clear All
new posts
  • #16 Collapse

    Rail Candlestick Pattern In Forex


    Click image for larger version

Name:	download - 2024-03-13T050958.671.png
Views:	39
Size:	7.8 کلوبائٹ
ID:	12862282


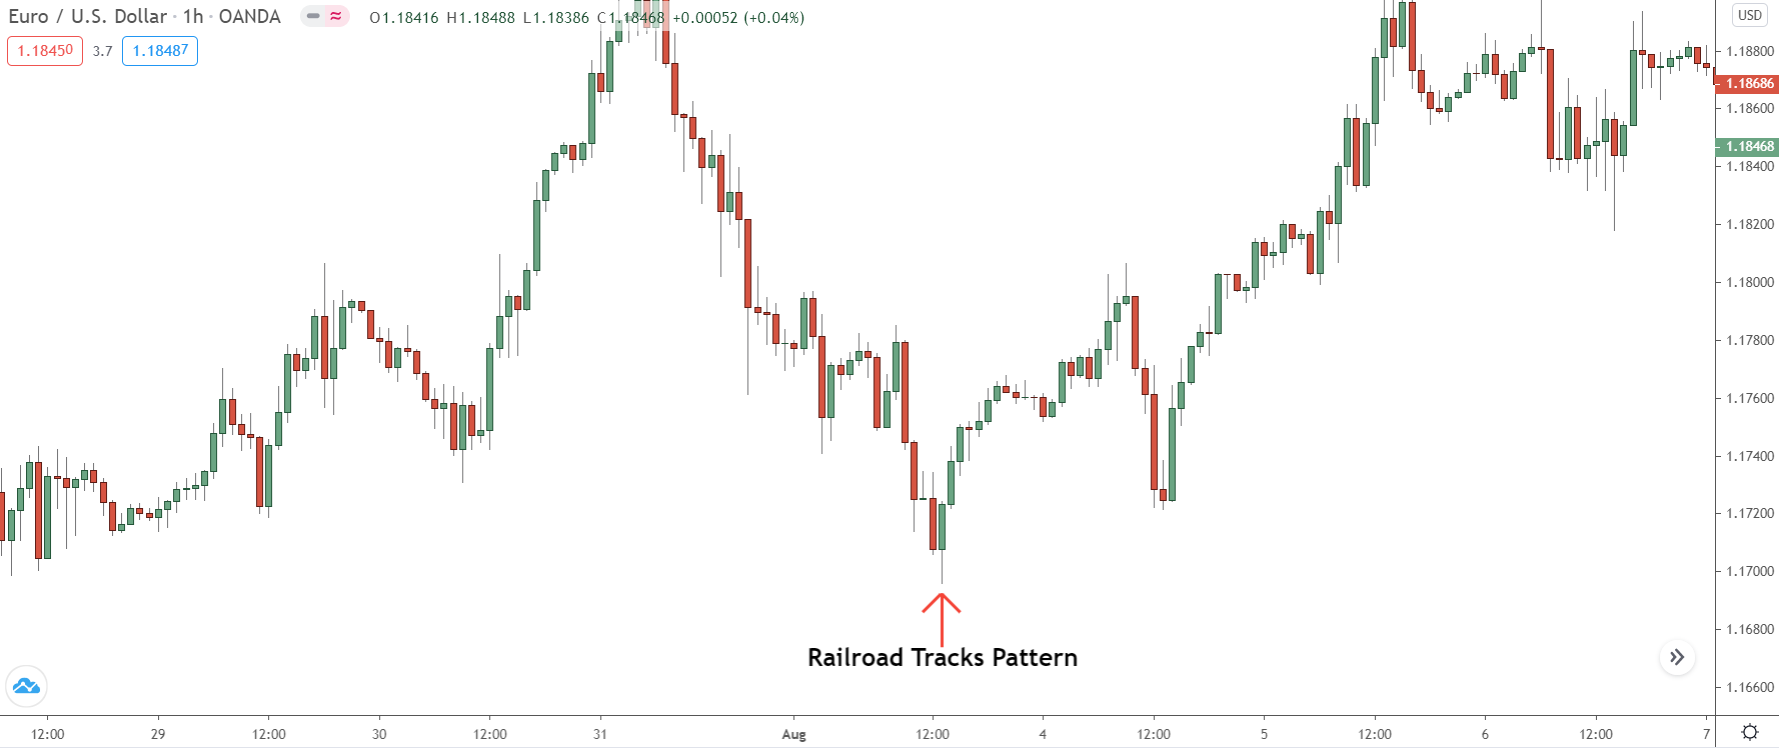
    Rail candlestick pattern, forex trading mein ek important technical analysis tool hai jo traders ke liye trend reversal ke signals provide karta hai. Is pattern ko samajhne ke liye, pehle candlestick kaafi bullish ya bearish hota hai aur doosra candlestick iske range mein hota hai, lekin iska direction opposite hota hai.

    Yeh pattern kuchh situations mein kaafi reliable hota hai, lekin hamesha ek confirmatory indicator ke saath istemal kiya jana chahiye. Aam taur par, traders doosre technical indicators jaise ki moving averages, RSI (Relative Strength Index), ya MACD (Moving Average Convergence Divergence) ka istemal karte hain, taake confirm karein ke trend reversal ka koi aur signal nahi hai.

    Ek bullish rail pattern ko samajhne ke liye, pehla candlestick ki closing price open price se zyada hoti hai aur doosra candlestick iske range mein hota hai, lekin iska direction down ki taraf hota hai. Iska matlab hai ke pehla candlestick ke baad market mein buying pressure zyada hai, lekin doosre candlestick mein selling pressure aa gaya hai aur market mein bearish sentiment aane wali hai. Is situation mein traders ko long positions ko close karke ya short positions ko open karke profit kama sakte hain.

    Ek bearish rail pattern ko samajhne ke liye, pehla candlestick ki closing price open price se kam hoti hai aur doosra candlestick iske range mein hota hai, lekin iska direction up ki taraf hota hai. Iska matlab hai ke pehla candlestick ke baad market mein selling pressure zyada hai, lekin doosre candlestick mein buying pressure aa gaya hai aur market mein bullish sentiment aane wali hai. Is situation mein traders ko short positions ko close karke ya long positions ko open karke profit kama sakte hain.

    Rail pattern ka istemal karne se pehle, traders ko market conditions ko bhi consider karna zaroori hai, jaise ki trend direction, market volatility, aur news events. Iske alawa, stop loss aur take profit levels ka bhi tay karna important hai taake risk management maintain kiya ja sake. Overall, rail candlestick pattern ek powerful tool hai jo traders ko market trends ka pata lagane mein madad karta hai, lekin iska istemal karte waqt caution aur diligence ki zaroorat hoti hai.


    • <a href="https://www.instaforex.org/ru/?x=ruforum">InstaForex</a>
    • #17 Collapse


      rail candlestick pattern

      Click image for larger version

Name:	download - 2024-03-13T052418.233.png
Views:	36
Size:	3.7 کلوبائٹ
ID:	12862302


      Railway Track Candlestick Pattern, Japanese candlestick chart analysis ka ek important reversal pattern hai jo traders ke liye market direction ko anticipate karne mein madad karta hai. Is pattern ka naam uske formation ke similarity se milta hai, jismein do consecutive candlesticks ek saath opposite directions mein move karte hain aur unka body size aur range similar hota hai.

      Is pattern ka formation ek bullish ya bearish trend ke doran hota hai. Agar bullish trend mein hai, toh pehla candlestick up move ka hota hai aur doosra candlestick down move ka hota hai. Jabki agar bearish trend mein hai, toh pehla candlestick down move ka hota hai aur doosra candlestick up move ka hota hai.

      Railway Track Pattern ka main significance ye hai ki jab do consecutive candlesticks ek jaisi range aur size ke saath opposite directions mein form hote hain, toh ye indicate karta hai ki market sentiment mein ek potential change hone ki sambhavna hai. Is pattern ko dekh kar traders trend reversal ko anticipate kar sakte hain aur apne trading strategies ko uske hisaab se adjust kar sakte hain.

      Is pattern ko identify karne ke liye, traders ko candlestick chart par dhyan dena hota hai aur do consecutive candlesticks ki characteristics ko observe karna hota hai. Agar dono candlesticks ke bodies aur wicks ka size similar hai aur ek candlestick ka close dusre candlestick ke open ke paas hota hai, toh ye Railway Track Pattern ko darust karta hai.

      Railway Track Pattern ka istemal karke traders apne trading decisions ko validate kar sakte hain. Lekin, is pattern ke istemal mein ek precautionary approach honi chahiye, aur confirmatory signals aur dusre technical indicators ka bhi istemal kiya jana chahiye trading decisions ko support karne ke liye.


      • #18 Collapse

        Rail Candlestick Pattern In Forex


        "Rail Candlestick Pattern" ek technical analysis pattern hai jo forex market mein istemal hota hai. Ye pattern typically trend reversal ko darust karta hai, jabki iska interpretation aur istemal traders ke trading decisions ko improve karne mein madad karta hai.
        1. Rail Candlestick Pattern ka Formation: Rail candlestick pattern ka formation do consecutive candlesticks se hota hai. Agar bullish rail pattern hai, toh pehla candlestick bearish hota hai aur doosra candlestick usse follow karta hai, jo pehle candlestick ki body ke andar aur niche close hota hai. Agar bearish rail pattern hai, toh pehla candlestick bullish hota hai aur doosra candlestick usse follow karta hai, jo pehle candlestick ki body ke andar aur upar close hota hai.
        2. Bullish Rail Pattern: Bullish rail pattern formation mein pehla candlestick downtrend mein hota hai aur doosra candlestick usse follow karta hai, jo pehle candlestick ki body ke andar aur niche close hota hai. Yeh pattern downtrend ki weakness ko darust karta hai aur potential trend reversal ko indicate karta hai. Agar ye pattern support level ya trend line ke near form hota hai, toh iski significance aur zyada hoti hai.
        3. Bearish Rail Pattern: Bearish rail pattern formation mein pehla candlestick uptrend mein hota hai aur doosra candlestick usse follow karta hai, jo pehle candlestick ki body ke andar aur upar close hota hai. Yeh pattern uptrend ki weakness ko darust karta hai aur potential trend reversal ko indicate karta hai. Agar ye pattern resistance level ya trend line ke near form hota hai, toh iski significance aur zyada hoti hai.
        4. Confirmation: Rail candlestick pattern ko confirm karne ke liye, traders doosri technical indicators aur patterns ka istemal karte hain jaise ke support aur resistance levels, trend lines, aur oscillators jaise RSI, MACD, ya Stochastic. Agar doosri indicators bhi bullish ya bearish signal dete hain, toh rail candlestick pattern ka significance aur zyada hota hai.

        Overall, rail candlestick pattern ka istemal traders ke liye ek useful tool hai trend reversals ko identify karne mein. Lekin, jaise har technical analysis tool ka hota hai, is pattern ka bhi istemal prudent risk management ke saath karna important hai, aur is pattern ko confirm karne ke liye doosri technical analysis tools ka bhi istemal karna zaroori hai
        • #19 Collapse

          Rail candlestick pattern

          Click image for larger version

Name:	gggg.png
Views:	34
Size:	30.6 کلوبائٹ
ID:	12862334


          Rail Candlestick Pattern ek technical analysis tool hai jo traders ko market ke price action aur trend ke bare mein information deta hai. Ye ek candlestick pattern hai jo trading charts par dikhai deta hai aur traders ko potential trend reversals ya continuations ke baray mein signal deta hai.

          Rail Candlestick Pattern Kya Hai?

          Rail Candlestick Pattern mein, do consecutive candlesticks ko observe kiya jata hai jo ek dusre ke opposite directions mein hote hain. Pehla candlestick ek lamba body ke saath hota hai, jo bullish ya bearish ho sakta hai. Doosra candlestick usse opposite direction mein hota hai aur typically chhota body aur lambi shadows ya wicks ke saath hota hai.

          Rail Candlestick Pattern Ki Tafsilaat

          Rail Candlestick Pattern ko samajhne ke liye, traders ko doosre candlestick ke high aur low ko pehle candlestick ke high aur low ke saath compare karna hota hai. Agar doosra candlestick pehle candlestick ke high aur low ke beech mein hota hai, toh ye ek rail candlestick pattern banata hai. Agar doosra candlestick pehle candlestick ke close ke above close karta hai, toh ye bullish rail pattern hai, jab ke agar below close karta hai, toh ye bearish rail pattern hai.

          Rail Candlestick Pattern Ka Istemal

          Rail Candlestick Pattern ka istemal kar ke traders market ke movements ko predict karte hain. Agar bullish rail pattern form hota hai, toh ye indicate karta hai ke uptrend ke continuation ka potential hai. Jab ke agar bearish rail pattern form hota hai, toh ye indicate karta hai ke downtrend ke continuation ka potential hai. Traders is pattern ko istemal kar ke trading decisions banate hain, jaise ke positions enter ya exit karna.

          Conclusion

          Rail Candlestick Pattern ek important tool hai jo traders ko market ke trends aur potential reversals ke bare mein information deta hai. Iska istemal kar ke traders apni trading strategies ko improve kar sakte hain aur market mein successful trading kar sakte hain. Lekin, jaise har technical analysis tool, isko istemal karne se pehle thorough research aur practice ki zaroorat hoti hai taake wo iska sahi tareeqe se istemal kar sakein.
          • #20 Collapse

            Rail candlestick pattern

            Click image for larger version

Name:	9.png
Views:	33
Size:	68.8 کلوبائٹ
ID:	12862344


            Rail candlestick pattern ek mukhtasar aur aham technical analysis tool hai jo stock market aur trading mein istemal hota hai. Ye pattern candlestick charts par nazar aata hai aur traders ko potential price movements ke baray mein maloomat faraham karta hai. Is pattern ki samajh traders ke liye zaroori hai taake wo sahi waqt par trading decisions le sakein. Chaliye, hum Rail candlestick pattern ke mutaliq mazeed tafseelat par gaur karte hain.

            Rail Candlestick Pattern: Tareef aur Tareekh

            Rail candlestick pattern ek bearish reversal pattern hai jo downtrend ke darmiyan ya us ke akhir mein nazar aata hai. Is pattern ko doosre candlestick patterns ke saath mila kar tajziya kiya jata hai taake sahi trade kiya ja sake.

            Is pattern ki tareekh jaaiz price action analysis mein waziha hoti hai. Iski shakal ko dekh kar, traders ko maloom hota hai ke market mein sellers control mein hain aur ab prices mein mazeed girawat mutawaqqa hai.

            Rail Candlestick Pattern: Tafseelat

            Rail candlestick pattern do mukhtalif candlesticks se banta hai jo ek downtrend ke dauraan nazar aate hain. Pehla candlestick ek choti si uppar ki taraf show hoti hai, jise hum upper shadow kehte hain, aur doosra candlestick pehle ke upar overlap hota hai. Iska matlab hai ke doosri candlestick ka open aur close pehli candlestick ke open aur close ke darmiyan hota hai. Yeh overlap ka area 'rail' kehlaya jata hai.

            Rail candlestick pattern ke honay par, traders ko yaqeeni hota hai ke sellers market mein control rakhte hain aur ab prices mein mazeed girawat ki umeed hai.

            Rail Candlestick Pattern: Istemal aur Fawaid

            Rail candlestick pattern ko trading decisions ke liye istemal kiya jata hai, khaaskar jab market mein downtrend ho aur traders ko sell ki taraf interest ho. Is pattern ko samajh kar, traders sahi waqt par apne positions ko sell kar sakte hain ya phir short positions le sakte hain.

            Is pattern ka istemal kar ke, traders ko market sentiment aur price action ke baray mein ahmiyatnapak maloomat milti hai. Iske ilawa, is pattern ke istemal se traders apni trading strategies ko mazbooti se sahi kar sakte hain.

            Nateeja

            Rail candlestick pattern ek ahem tool hai jo traders ko market analysis mein madad faraham karta hai. Is pattern ki samajh traders ke liye zaroori hai taake wo sahi trading decisions le sakein. Magar, yaad rahe ke har technical analysis tool ki tarah, is pattern ko bhi doosri confirmatory signals ke saath mila kar istemal karna zaroori hai taake sahi trade kiya ja sake.
            • #21 Collapse

              Rail candlestick pattern

              Click image for larger version

Name:	ab.png
Views:	32
Size:	16.6 کلوبائٹ
ID:	12862370


              Rail candlestick pattern ek technical analysis concept hai jo ki stock market aur financial markets mein istemal hota hai. Ye pattern ek specific candlestick formation ko describe karta hai jo traders aur investors ko market ke future movements ke baare mein hint deta hai.

              Rail Candlestick Pattern ki Tareef

              Rail candlestick pattern ek reversal pattern hai jo typically downtrend ke baad market mein dekha jata hai. Is pattern mein do consecutive candlesticks hote hain jinmein pehla candlestick lamba aur red hota hai, aur doosra candlestick chota hota hai jo green hota hai. Dono candlesticks ke bodies overlap karte hain, jisse ek rail jaisi shape banti hai.

              Rail Candlestick Pattern ka Tajarba

              Rail candlestick pattern market mein often dekha jaata hai jab ek strong downtrend ke baad price mein kuch stability aati hai aur doosri candlestick mein buying pressure dikhayi deti hai. Is pattern ka interpretation hota hai ke selling pressure kam ho rahi hai aur market mein possible trend reversal hone ka chance hai.

              Rail Candlestick Pattern ka Istemal

              Rail candlestick pattern ko traders aur investors market ke trends aur reversals ko identify karne ke liye istemal karte hain. Jab ye pattern confirm hota hai, traders long positions enter karte hain ya short positions ko cover karte hain, expecting ke market upar jaayega.

              Rail Candlestick Pattern ka Dafa Karne ki Tadabeer

              Rail candlestick pattern ko dafah karne ke liye, traders ko cautious rehna chahiye aur confirmation ke liye aur technical indicators ka istemal karna chahiye. Volume analysis, price action, aur dusre technical indicators ka istemal karke traders ye verify kar sakte hain ke pattern sahi hai ya nahi.

              Rail Candlestick Pattern ke Challenges

              Rail candlestick pattern bhi, jaise ki har pattern, 100% accurate nahi hota. False signals ho sakte hain aur traders ko loss ho sakta hai agar wo sirf is pattern par rely karte hain. Isliye, proper risk management aur aur technical analysis ke sath sath trading kiya jana chahiye.

              Conclusion

              Rail candlestick pattern ek important technical analysis tool hai jo traders ko market trends aur reversals ke bare mein signal deta hai. Is pattern ko samajhna aur sahi tareeke se istemal karna traders ke liye zaroori hai market movements ko predict karne ke liye. Magar, traders ko hamesha proper risk management aur aur dusre technical indicators ka bhi istemal karna chahiye pattern ke sahi hone ka confirmation ke liye.
              • #22 Collapse

                Rail candlestick pattern


                Rail candlestick pattern ek mukhtalif aur ahem technical signal hai jo stock market aur trading mein istemal hota hai. Ye pattern candlestick charts par dekha jata hai aur traders ke liye ek mukhtasar lekin eham information faraham karta hai. Is article mein hum rail candlestick pattern ke baray mein tafseel se guftagu karenge.

                Rail Candlestick Pattern Kya Hai?

                Rail candlestick pattern ek trend reversal pattern hai jo market mein bearish ya bullish trend ke badalne ki nishandahi karta hai. Is pattern mein do candlesticks ko milakar dekha jata hai jo trend ki mukhtalif stages ko darust karte hain. Ek bearish trend ke doran, rail candlestick pattern bull trend ki tarah dikhta hai aur ek bullish trend ke doran bear trend ko nishandahi karta hai.

                Rail Candlestick Pattern Ki Pehchan

                Rail candlestick pattern ki pehchan karne ke liye, traders ko do alag alag candlesticks ko dekhna hota hai. Pehla candlestick bullish trend ke doran ban sakta hai aur doosra candlestick is trend ke ulte hone ki nishandahi karta hai.

                Rail Candlestick Pattern Ka Istemal

                Rail candlestick pattern ka istemal karne ke liye, traders ko is pattern ko samajhna aur pehchanna zaroori hai. Is pattern ki madad se traders market ke mukhtalif phases ko samajh sakte hain aur apne trading strategies ko accordingly adjust kar sakte hain.

                Rail Candlestick Pattern Ka Tareeqa-e-Amal

                Rail candlestick pattern ka tareeqa-e-amal samajhne ke liye, traders ko is pattern ki pehli aur doosri candlesticks ki shape, size, aur location ko dhyan se dekhna hota hai. Pehli candlestick bullish trend ki taraf ishara karti hai jabke doosri candlestick bearish trend ki taraf ishara karti hai.

                Rail Candlestick Pattern Ke Faidey

                Rail candlestick pattern ke kuch faidey hain jo traders ke liye ahem hotay hain:
                1. Trend Reversal Ki Nishandahi: Rail candlestick pattern bearish ya bullish trend ke reversal ko nishandah karta hai, jo traders ko market ke badalte mizaj ko samajhne mein madad karta hai.
                2. Entry Aur Exit Points Ka Pata: Is pattern ki madad se traders entry aur exit points ka pata laga sakte hain, jisse unki trading performance behtar ho.
                3. Risk Management: Rail candlestick pattern ke istemal se traders apni positions ko manage kar sakte hain aur risk ko kam karne mein madad hasil kar sakte hain.

                Nateeja

                Rail candlestick pattern ek ahem technical tool hai jo traders ko market trends ko samajhne mein madad karta hai. Is pattern ka istemal karke traders apne trading strategies ko behtar bana sakte hain aur market mein kamiyabi hasil kar sakte hain. Magar, jaise har technical tool ki tarah, rail candlestick pattern ka istemal bhi sahi samajh aur tajurba ki zaroorat hai. Traders ko is pattern ko samajhne ke liye practice aur tajurba hasil karna chahiye taake woh iska behtareen istemal kar sakein.
                • #23 Collapse


                  RAIL CANDLESTICK PATTERN DEFINITION

                  bitcoin ka using karte hue koi bhi Bank Jaise intermediary ki need ke without directly purchase sell and exchange kar sakta hai Bitcoin first and more widely recognized crypto currency jisse two hundred nine main launched Kiya gaya tha agar koi investor crypto currency ki trade karna chahta hai technical analysis se familiarity important hai Chahe vah actively cryptocurrency ki trade karne ka plan rakhte ho ya long term ke liye unmen invest karna chahte hon crypto industry mein recent boom ke sath bahut se log crypto currencies se earn Ke way exploring kar rahe hain technical analysis ko properly understanding and learning essential hai


                  MOVING AVERAGE CONVERGENCE DIVERGENCE

                  Jab moving Average convergence divergence line up turns Hai To yah Bullish hain and Jab moving average convergence divergence down turns hota hai and signal line ko cross Karta Hai To yah Bearish Ka prone Hota Hai moving average convergence divergence ka sabse Aam use signal line cross over ke liye hai signal line moving average convergence divergence line ke peeche trails hai moving average convergence divergence indicator ko Gerald Appel ne developed kiya tha is indicator ko 2 lines ke sath plotted Kiya gaya hai moving average convergence divergence most popular and well known indicators mein se ek hai moving average convergence divergence line Jo ke twelve day exponential moving average ke between difference hai jo twenty six day ke exponential moving average Se Subtracted hai signal line Jo moving average convergence divergence ka nine day EMA hai 2 lines Ek center line ke around fluctuate karti hai Jo 0 per hoti hai indicator ki koi upper and lower limit Nahin Hai


                  UNDERSTANDING TECHNICAL INDICATOR

                  aisy indicator bhi hai jo volume ka use karte hain Jaise on balance volume indicator all indicator, isase Koi matter Nahin Hota Hai ke vah Kaise plotted kiye gaye hain price and/ya volume se derived gaye hain lihaza Woh sirf price ke sath conjunction hokar used Kiya Jana chahie confirmation Hamesha price se come ho
                  • #24 Collapse

                    Rail Candlestick Pattern
                    Click image for larger version

Name:	Railroad-Tracks-Forex-Trading-Strategy1.png
Views:	33
Size:	16.6 کلوبائٹ
ID:	12862516


                    Rail Candlestick Pattern ek continuation pattern hai jo market mein dekha jata hai jab trend mein temporary pause hota hai aur phir se continuation hota hai. Ye pattern do candles se banta hai aur typically uptrend ya downtrend ke beech mein dekha jata hai. Rail Candlestick Pattern ko samajhne ke liye, yeh kuch key points hain :
                    Pehla Candle: Pehla candle ek long body wala hota hai jo trend ke sath move karta hai, yaani ke uptrend mein green aur downtrend mein red hota hai.
                    Doosra Candle: Doosra candle ek small body wala hota hai jo pehle candle ke upper ya lower range mein form hota hai. Is candle ka range pehle candle ke range se kam hota hai.
                    Trend Direction: Rail Candlestick Pattern ke formation ke baad, trend direction ke liye doosri confirmation ki zaroorat hoti hai. Agar pehla candle uptrend mein tha aur doosra candle neeche form hua, toh ye bearish confirmation ke taur par interpret kiya jata hai. Agar pehla candle downtrend mein tha aur doosra candle upar form hua, toh ye bullish confirmation ke taur par interpret kiya jata hai. Volume ka Consideration: Is pattern ke formation ke saath-saath, traders ko volume ka bhi consideration karna chahiye. Agar is pattern ke sath high volume hai, toh ye uske reliability ko increase karta hai.
                    Rail Candlestick Pattern dekh kar traders ko temporary trend reversal ya consolidation ka signal milta hai, lekin is pattern ko confirm karne ke liye doosre technical indicators ka bhi istemal kiya jata hai. Is pattern ko sahi tareeke se samajh kar, traders apne trading decisions ko improve kar sakte hain aur market movements ko sahi tareeke se analyze kar sakte hain.
                    • #25 Collapse


                      Rail Candlestick Pattern In Forex

                      Forex trading mein safar tay karna, aksar market ke mukhtalif phases ko samajhne aur unke andar chhupi hui possibilities ko pehchanne par mabni hota hai. Is maqsad ke liye, traders aur investors tafseeli tehqiqat aur technical analysis ke tareeqay ka istemal karte hain. Candlestick patterns un tareeqon mein se aham hai jo market ki mukhtalif stages ko samajhne mein madadgar sabit ho sakte hain. Aik aham aur common candlestick pattern jo forex trading mein istemal hota hai, woh hai Rail Candlestick Pattern.


                      Click image for larger version

Name:	S87.png
Views:	30
Size:	7.8 کلوبائٹ
ID:	12862537

                      Pehchaan:

                      Rail Candlestick Pattern, forex trading mein aik aham tareeqa hai jo market trends aur reversals ko pehchanne mein madadgar hota hai. Ye pattern aksar do candlesticks se bana hota hai aur typically market ke uptrend ya downtrend ke doran dikhai deta hai.

                      Formation:

                      Rail Candlestick Pattern ki formation do candlesticks ke milne se hoti hai. Pehli candlestick, uptrend ya downtrend ko represent karti hai aur dusri candlestick, pehli candlestick ki opposite direction mein hoti hai. Yani agar pehli candlestick bullish hai to dusri bearish hogi aur agar pehli bearish hai to dusri bullish hogi.

                      Interpretation:

                      Rail Candlestick Pattern ka interpretation market trend ka reversal ya continuation indicate karta hai. Agar Rail Candlestick Pattern uptrend ke doran dikhai deta hai to ye bearish reversal signal ho sakta hai aur agar downtrend ke doran dikhai deta hai to ye bullish reversal signal ho sakta hai. Is pattern ka interpretation karte waqt, traders ko doosri technical indicators aur market conditions ka bhi dhyan dena zaroori hai.

                      Trading Strategy:

                      Rail Candlestick Pattern ko samajhne ke baad, traders iska istemal kar ke apni trading strategies develop karte hain. Agar pattern bullish trend ke doran dikhai deta hai to traders ko long positions lena ho sakta hai yaani ke asset ya currency ko kharidna hota hai ummeed hai ke price barhega. Aur agar pattern downtrend ke doran dikhai deta hai to traders ko short positions lena ho sakta hai yaani ke asset ya currency ko bechna hota hai ummeed hai ke price girega.

                      Conclusion:

                      Rail Candlestick Pattern, forex trading mein aik ahem tool hai jo traders aur investors ko market trends aur reversals ke baray mein agah karta hai. Lekin, iska istemal karne se pehle traders ko is pattern ko samajhna zaroori hai aur doosri technical indicators ke saath mila kar istemal karna chahiye. Is tarah se, traders apni trading decisions ko better taur par samajh sakte hain aur behtar results hasil kar sakte hain.


                      • #26 Collapse

                        **Rail Candlestick Pattern**
                        Rail candlestick pattern trading mein aik important technical analysis tool hai jo market ki potential reversal points aur trend changes ko identify karne mein madad karta hai. Yeh pattern do candlesticks se mil kar banta hai aur iska structure price action ke analysis mein kaafi useful hota hai. Is post mein hum rail candlestick pattern ke concept, identification, aur trading strategies ko detail mein samjhenge.

                        ### Rail Candlestick Pattern Ka Concept

                        Rail candlestick pattern do sequential candlesticks se mil kar banta hai jo ek particular price action ko reflect karte hain. Is pattern ke do main types hain: **Bullish Rail** aur **Bearish Rail**. Yeh pattern market ke reversal points ko indicate karta hai aur traders ko future price movements ka andaza lagane mein help karta hai.

                        ### Identification of Rail Candlestick Pattern

                        1. **Bullish Rail:**
                        - **Structure:** Bullish rail pattern tab banta hai jab pehli candlestick bearish hoti hai aur dusri candlestick iske saath milti hai jo bullish hoti hai. Dusri candlestick ka open aur close price pehli candlestick ke close price ke upar hona chahiye. Pehli candlestick typically long red (bearish) hoti hai aur dusri candlestick green (bullish) hoti hai.
                        - **Implication:** Yeh pattern market ke bottom par develop hota hai aur bullish reversal signal deta hai. Is pattern ka appearance market mein buying pressure ke badhne aur selling pressure ke kam hone ka indication hota hai.

                        2. **Bearish Rail:**
                        - **Structure:** Bearish rail pattern tab banta hai jab pehli candlestick bullish hoti hai aur dusri candlestick iske saath milti hai jo bearish hoti hai. Dusri candlestick ka open aur close price pehli candlestick ke close price ke neeche hona chahiye. Pehli candlestick typically long green (bullish) hoti hai aur dusri candlestick red (bearish) hoti hai.
                        - **Implication:** Yeh pattern market ke top par develop hota hai aur bearish reversal signal deta hai. Is pattern ka appearance market mein selling pressure ke badhne aur buying pressure ke kam hone ka indication hota hai.

                        ### Trading Strategy Using Rail Candlestick Pattern

                        1. **Entry Point:**
                        - **Bullish Rail:** Agar aap bullish rail pattern identify karte hain, toh entry point dusri candlestick ke closing ke baad consider kiya jata hai. Yeh indicate karta hai ke market reversal ke baad bullish trend shuru ho sakta hai.
                        - **Bearish Rail:** Agar aap bearish rail pattern identify karte hain, toh entry point dusri candlestick ke closing ke baad consider kiya jata hai. Yeh indicate karta hai ke market reversal ke baad bearish trend shuru ho sakta hai.

                        2. **Stop Loss aur Target:**
                        - **Bullish Rail:** Stop loss ko pehli candlestick ke low ke thoda neeche set kiya jata hai. Target price ko previous resistance level ya expected bullish move ke hisaab se set kiya jata hai.
                        - **Bearish Rail:** Stop loss ko pehli candlestick ke high ke thoda upar set kiya jata hai. Target price ko previous support level ya expected bearish move ke hisaab se set kiya jata hai.

                        ### Example

                        Agar aapko ek bearish rail pattern milta hai jahan pehli candlestick green (bullish) aur dusri candlestick red (bearish) hai, toh yeh indicate karta hai ke market top par hai aur bearish reversal hone ke chances hain. Aap entry point ko dusri candlestick ke close ke baad consider kar sakte hain aur stop loss ko pehli candlestick ke high ke thoda upar set kar sakte hain.

                        ### Conclusion

                        Rail candlestick pattern trading mein ek useful tool hai jo market ke reversal points aur trend changes ko identify karne mein madad karta hai. Bullish aur bearish rail patterns ko samajh kar, traders market ke entry aur exit points ko effectively identify kar sakte hain. Accurate identification aur proper trading strategies ke sath, rail candlestick pattern se profitable trades execute kiye ja sakte hain.
                        • #27 Collapse

                          Stock trading aur financial markets main technical analysis ek bohat hi zaroori part hai, aur iske through traders aur investors apni strategies banate hain. Technical analysis kay under, bohat se tools aur patterns hain jo market ki movement ko predict karne main madad dete hain. Inhi tools main se aik tool candlestick patterns hain. Candlestick patterns aik tarah ka visual representation hota hai price movement ka jo kisi bhi trading session ka high, low, open aur close price dikhata hai. Rail Candlestick Pattern ko samajhna bohat zaroori hai, kyun ke ye price reversal ka aik strong signal hota hai jo traders ko market trend ko pehlay se predict karne main madad deta hai.

                          Candlestick patterns bohat puranay hain aur inka asal Japan se shuru hota hai, jahaan yeh Munehisa Homma ne 18th century main use karne shuru kiye the. Aik candlestick ka basic structure do main parts se mil kar banta hai:
                          1. Body: Jo open aur close price ko represent karta hai.
                          2. Wicks (Ya Shadows): Jo high aur low prices ko dikhate hain.
                          Candlesticks ka aik cluster ya sequence patterns banata hai jo market main trend reversal ya continuation ka signal hota hai. In patterns ko samajhna bohot zaroori hai, kyu ke in se market main entry aur exit points identify kiye jaa sakte hain.


                          Rail Candlestick Pattern
                          Rail Candlestick Pattern aik do-candle pattern hai jo generally market reversal ka signal hota hai. Ye pattern market trend ki weakness aur uske ulatne ka ishara deta hai. Is pattern ko Railroad Tracks pattern bhi kaha jata hai kyun ke iski shakal bilkul do rail tracks jaisi hoti hai, jo parallel hoti hain aur ek dosray ke opposite trend ko indicate karti hain.

                          Rail Candlestick Pattern Ka Structure
                          Rail Candlestick Pattern ko samajhne ke liye, pehle iska structure dekhna zaroori hai:
                          1. Pehli Candle: Pehli candle bullish ya bearish ho sakti hai, lekin iska color aur structure opposite hota hai doosri candle se. Yani agar pehli candle bullish (green) hai, to doosri bearish (red) hogi aur vice versa.
                          2. Doosri Candle: Doosri candle pehli candle ke opposite trend ko indicate karti hai. Agar pehli candle bullish hai, to doosri candle bearish hogi. Doosri candle ke size aur body kaafi similar hoti hai pehli candle ke size aur body se.
                          3. Wicks: Dono candles ke wicks ya to choti hoti hain ya bilkul nahi hoti. Iska matlab hai ke price main significant movement open aur close ke darmiyan hoti hai aur market participants ne kafi aggressive trading ki hoti hai.
                          Is pattern ka basic interpretation ye hota hai ke market main pehle ek strong trend chal raha hota hai, lekin doosri candle us trend ko invalidate karti hai aur market ulatna shuru hoti hai.

                          Rail Candlestick Pattern Ka Matlab
                          Is pattern ka ek basic meaning hota hai market trend ka reversal. Agar ek bullish rail candlestick pattern banta hai, to iska matlab hai ke market jo pehle bearish thi, ab bullish hone wali hai. Similarly, agar ek bearish rail candlestick pattern banta hai, to iska matlab hai ke market ab bearish hone wali hai.

                          Ye pattern dikhata hai ke market main momentum aik side se dusri side shift ho raha hai. Iss se hume signal milta hai ke ab humara pehla trend khatam ho raha hai aur ek naya trend start hone wala hai. Ye pattern short-term traders ke liye bohat beneficial hota hai kyun ke yeh unko price reversal ka timely signal deta hai.

                          Rail Candlestick Pattern Ki Identification
                          Is pattern ki identification karte waqt kuch important cheezon ko dhyan main rakhna hota hai:
                          1. Trend Ka Pata Lagana: Rail Candlestick Pattern tabhi valid hota hai jab yeh kisi significant trend ke baad appear hota hai. Aik bullish pattern tab samjha jata hai jab market pehle bearish ho, aur bearish pattern tab jab market pehle bullish ho.
                          2. Candles Ka Size: Dono candles ka size kariban ek jaisa hota hai. Agar candles ka size bohot different ho, to pattern ki reliability kam ho jati hai.
                          3. Shadows (Ya Wicks): Wicks ya shadows choti honi chahiye. Agar candles ke wicks bohot lambay hon to iska matlab hai ke market main price fluctuations zyada hain aur pattern weak hai.
                          4. Confirmation: Pattern ko dekhte hi trade nahi karni chahiye, balkay ek confirmation ka intezar karna chahiye. Confirmation ka matlab hai ke agle session main price us trend ke direction main move kare jo pattern indicate kar raha hai. Agar pattern ke baad market ussi direction main jata hai jo pattern ne indicate kiya tha, to iska matlab hai ke pattern reliable hai.
                          Bullish Rail Candlestick Pattern
                          Bullish Rail Candlestick Pattern tab banta hai jab market pehle downward trend main hoti hai aur uske baad do candles opposite directions main banti hain. Iska matlab ye hota hai ke pehli candle bearish thi, lekin doosri candle bullish ban gayi, jo ke market ke reversal ka ishara hai.

                          Conditions for a Bullish Rail Candlestick Pattern
                          1. Downtrend: Pehle downward trend ho raha hota hai.
                          2. Pehli Candle: Pehli candle bearish (red) hoti hai jo downtrend ko confirm karti hai.
                          3. Doosri Candle: Doosri candle bullish (green) hoti hai, jo pehli candle ke close price ke kareeb se start hoti hai aur pehli candle se zyada upar close hoti hai.
                          4. Confirmation: Agla session bullish direction main move karta hai.
                          Ye pattern dikhata hai ke market bearish se bullish ho raha hai aur ab upward trend start ho sakta hai.

                          Bearish Rail Candlestick Pattern
                          Bearish Rail Candlestick Pattern tab banta hai jab market pehle upward trend main hoti hai aur uske baad ek reversal ka signal milta hai. Iska matlab hai ke market bullish se bearish hone wali hai.

                          Conditions for a Bearish Rail Candlestick Pattern
                          1. Uptrend: Pehle upward trend ho raha hota hai.
                          2. Pehli Candle: Pehli candle bullish (green) hoti hai jo uptrend ko confirm karti hai.
                          3. Doosri Candle: Doosri candle bearish (red) hoti hai, jo pehli candle ke close price ke kareeb se start hoti hai aur pehli candle se neeche close hoti hai.
                          4. Confirmation: Agla session bearish direction main move karta hai.
                          Ye pattern dikhata hai ke market bullish se bearish ho raha hai aur ab downward trend start ho sakta hai.

                          Rail Candlestick Pattern Ki Trading Strategy
                          Rail Candlestick Pattern ko apni trading strategy main use karte waqt kuch specific points ka dhyan rakhna zaroori hai:
                          1. Risk Management: Jab bhi koi trade lein, apna stop-loss zaroor set karein. Is pattern ke under stop-loss ko pehli candle ke high ya low point par set karna chahiye, taake agar market us direction main wapas chali jaye, to aapko zyada nuksaan na ho.
                          2. Volume: Volume ko dekhna bohot zaroori hai. Jab bhi ye pattern banta hai, to volume zyada hona chahiye, jo ke market participants ke interest ko dikhata hai. Agar pattern banta hai lekin volume kam hai, to iska matlab hai ke pattern weak hai aur ye false signal bhi ho sakta hai.
                          3. Time Frame: Is pattern ko generally short-term time frames par dekhna zyada useful hota hai. Lekin, agar aap long-term trader hain to aapko weekly ya daily charts dekhne chahiye taake larger trend ko samajh sakein.
                          4. Confirmation Candle: Jab rail candlestick pattern banta hai, uske baad ek confirmation candle ka intezar karna zaroori hota hai. Confirmation candle us direction main move karti hai jo pattern ne signal kiya hota hai.
                          5. Entry Point: Entry point generally doosri candle ke close hone ke baad hoti hai, lekin confirmation ka intezar karna zyada safe hota hai.
                          6. Exit Strategy: Jab market apni trend direction main move karna shuru karti hai, to apne profits ko secure karna bhi bohot zaroori hai. Iske liye aap trailing stop-loss use kar sakte hain ya phir predefined profit targets set kar sakte hain.


                          Advantages Aur Disadvantages

                          Advantages
                          1. Reversal Signal: Rail Candlestick Pattern ek clear signal deta hai market reversal ka, jo short-term traders ke liye bohat beneficial hota hai.
                          2. Simplicity: Is pattern ko identify karna aur samajhna relatively easy hai. Agar aap basic candlestick patterns ko samajhte hain, to aapko ye pattern bhi aasani se samajh aa jaye ga.
                          3. Works Across Markets: Ye pattern sirf stock market main nahi, balkay forex, commodities, aur cryptocurrencies jese markets main bhi kaam karta hai.
                          Disadvantages
                          1. False Signals: Har candlestick pattern ke tarah, Rail Candlestick Pattern bhi false signals de sakta hai, khas tor par jab volume ya confirmation candle na ho.
                          2. Market Conditions: Ye pattern trending markets main zyada effective hota hai. Agar market sideways ya range-bound ho, to is pattern ki reliability kam ho jati hai.
                          3. Short-Term Nature: Is pattern ko short-term trading ke liye zyada use kiya jata hai, to long-term investors ke liye iska faida thoda limited ho sakta hai.
                          Rail Candlestick Pattern aik powerful reversal pattern hai jo traders ko market ke turning points identify karne main madad deta hai. Is pattern ko sahi tarah se samajh kar, risk management aur confirmation candle ka intezar karke aap apne trading decisions ko zyada effective bana sakte hain.
                          Believe in yourself and your abilities. When you fight for your dreams, you can achieve anything.
                          • #28 Collapse

                            **Rail Candlestick Pattern in Forex Trading**
                            Rail Candlestick Pattern ek unique aur powerful pattern hai jo traders ko market ke trend reversal ka signal deta hai. Ye pattern do baron par mushtamil hota hai jo ek doosray ke opposite direction mein hote hain. Is pattern ka asar zyadah tab hota hai jab ye market ke extreme points, jese ke support ya resistance levels par banta hai.

                            Rail Candlestick Pattern ko samajhne ke liye, pehle hum in baron ki structure par nazar dalte hain. Pehla bar hota hai ek strong trend ka indication, jo ya to bullish (upar ki taraf) ya bearish (neeche ki taraf) ho sakta hai. Doosra bar uske bilkul opposite direction mein banta hai, aur ye bar previous trend ke against closing hota hai. Ye indicate karta hai ke market mein ab reversal yaani ulat honay ke chances barh rahe hain.

                            Is pattern ki khas baat ye hai ke ye zyada tar major trend reversal ke waqt banta hai. Agar market pehle se uptrend mein ho aur Rail Candlestick Pattern banta hai, to ye indicate karta hai ke ab downtrend shuru ho sakta hai. Isi tarah, agar market pehle se downtrend mein ho aur ye pattern banta hai, to ye signify karta hai ke market upar ki taraf ja sakta hai.

                            Traders is pattern ko dekh kar apne trades ke decisions le sakte hain. Agar kisi ne market mein buy position open ki hui ho aur Rail Candlestick Pattern upar se neeche ki taraf banta hai, to ye exit ka signal ho sakta hai. Isi tarah, agar kisi ne sell position rakhi ho aur ye pattern neeche se upar ki taraf banta hai, to unhe apne position ko close kar dena chahiye ya buy ka sochna chahiye.

                            Ek aur important baat ye hai ke Rail Candlestick Pattern ko hamesha baqi technical indicators ke sath combine karke dekhna chahiye. Ye pattern kabhi kabhi false signal bhi de sakta hai, is liye RSI, Moving Averages, ya Fibonacci levels ka istamal karke is pattern ki confirmation lena zaroori hai.

                            Akhir mein, Rail Candlestick Pattern ek strong tool hai lekin sirf isi par depend karke trading nahi karni chahiye. Is pattern ko samajhna aur use karna trader ki skill aur experience ka part hai, jo waqt ke sath improve hoti hai. Forex trading mein hamesha disciplined approach aur proper risk management zaroori hota hai.
                            • <a href="https://www.instaforex.org/ru/?x=ruforum">InstaForex</a>
                            • #29 Collapse

                              Rail Candlestick Pattern


                              Rail candlestick pattern ek technical analysis ka tool hai jo price movements ko analyze karne mein madad karta hai. Yeh pattern market ki mood aur future price direction ko samajhne ke liye use hota hai. Iska naam “rail” is liye pada kyunki yeh pattern do long candlesticks ko resemble karta hai jo ek dusre ke parallel lagte hain, jaise ek rail track.
                              Pattern ki Shakal


                              Rail pattern do candlesticks se milkar banta hai. Pehla candlestick ka body chhoti hoti hai aur dusra candlestick ka body zyada lamba hota hai. Dono candlesticks ke beech gap hota hai jo ke unhe ek doosre se alag karta hai. Pehle candlestick ka color usually bearish hota hai, jab ke doosra candlestick bullish hota hai. Yeh pattern is baat ka indicator hota hai ke market trend reverse ho sakta hai.
                              Pattern ka Analysis


                              Agar aap rail candlestick pattern dekhein aur yeh pattern apne aap ko confirm kar raha hai, toh yeh market me trend reversal ki nishani ho sakta hai. Jab pehla candlestick bearish hota hai aur doosra candlestick bullish hota hai, tab yeh pattern ek uptrend ka signal de sakta hai. Iska matlab yeh hota hai ke sellers ka control kam hota ja raha hai aur buyers ka control barh raha hai.
                              Trading Strategy


                              Agar aap rail candlestick pattern ka use trading decisions ke liye karna chahte hain, toh pehle aapko yeh ensure karna hoga ke pattern market ke trend ke sath match kar raha hai. Pattern ko trade karte waqt aapko stop-loss aur target levels ko bhi define karna chahiye. Yeh ensure karna zaroori hai ke aapke stop-loss levels aapke risk tolerance ke sath match karte hain.
                              Practical Examples


                              Agar ek market bearish trend me hai aur aap ek rail candlestick pattern dekhte hain jahan pehla candlestick bearish hai aur doosra bullish hai, toh yeh ek potential buying opportunity ho sakti hai. Lekin, is pattern ke confirmation ke liye aapko volume aur other technical indicators ka bhi analysis karna chahiye.
                              Conclusion


                              Rail candlestick pattern ek ahem tool hai jo aapko market trends aur reversals ko samajhne mein madad kar sakta hai. Is pattern ko sahi tareeqe se use karna aur other technical indicators ke sath combine karna aapki trading strategy ko enhance kar sakta hai. Yeh pattern sirf ek component hai, isliye trading decisions lene se pehle comprehensive analysis zaroori hai.

                              اب آن لائن

                              Working...
                              X