Rising Wedge Chart Pattern
No announcement yet.
X
  • وقت
  • دکھائیں
Clear All
new posts
  • #16 Collapse

    Rising Wedge Chart Pattern kai hy

    Click image for larger version

Name:	download (4).png
Views:	46
Size:	9.9 کلوبائٹ
ID:	12864975


    Rising Wedge Chart Pattern

    Urooj Wala Wedge Chart Pattern ek bearish reversal pattern hai jo uptrend ke dauran dikhai deta hai. Ye pattern typically ek consolidation phase ke baad form hota hai aur downward price movement ko indicate karta hai. Is article mein hum Rising Wedge Chart Pattern ke roman Urdu mein tafseel se baat karenge.

    Rising Wedge Chart Pattern Kya Hai?

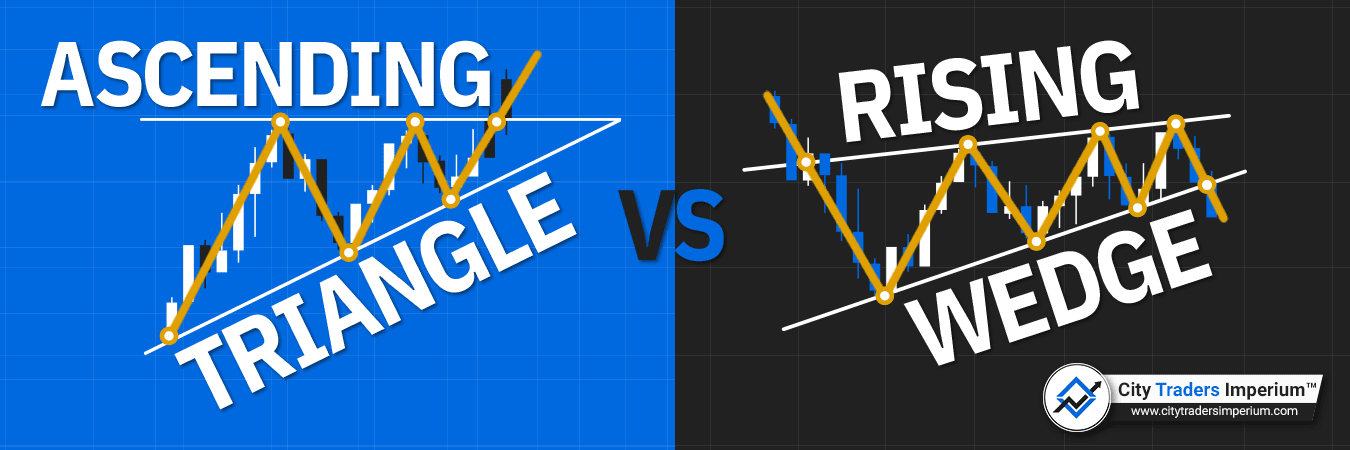
    Rising Wedge Chart Pattern ek technical analysis tool hai jo traders ko potential trend reversals aur price movements ko anticipate karne mein madad karta hai. Is pattern mein price ek wedge ya triangle ke andar consolidate hoti hai, jahan price ke highs aur lows dono ek upward slope ke saath move karte hain.

    Rising Wedge Chart Pattern Ke Khasiyat:
    1. Consolidation Phase: Rising Wedge pattern typically ek consolidation phase ke baad form hota hai, jab price ek range mein trade karta hai.
    2. Upward Sloping Trendlines: Pattern mein ek upper trendline aur lower trendline hote hain jo dono upward slope karte hain.
    3. Decreasing Volume: Rising Wedge pattern ke formation ke saath volume usually decrease hota hai, indicating ke market mein interest kamzor ho raha hai.

    Rising Wedge Chart Pattern Ka Tafsili Jaiza:
    1. Market Context: Rising Wedge pattern ka tafsili jaiza karte waqt market context ko samajhna zaroori hai. Agar ye pattern uptrend ke dauran dikhai deta hai, to ye bearish reversal signal ke taur par samjha jata hai.
    2. Trendlines: Upper aur lower trendlines ko draw karke pattern ko confirm karna zaroori hai. Breakout ke baad, trendlines ko validate karna bhi zaroori hai.
    3. Volume: Rising Wedge pattern ke formation ke saath volume ka bhi analysis karna zaroori hai. Decreasing volume pattern ke validity ko aur zyada darust karta hai.

    Rising Wedge Chart Pattern Ka Istemal:
    1. Entry Point: Agar Rising Wedge pattern break hota hai neeche ki taraf, traders short positions enter kar sakte hain.
    2. Stop Loss: Stop loss ko set karte waqt, traders upper trendline ke paar set kar sakte hain ya breakout ke neeche set kar sakte hain.
    3. Target Price: Target price ko set karte waqt, traders lower trendline ya support level ke qareeb set kar sakte hain.

    Nateeja:

    Rising Wedge Chart Pattern ek important bearish reversal pattern hai jo traders ko potential downward price movement ke baare mein suchit karta hai. Lekin, har ek trading decision ko carefully analyze karna zaroori hai aur risk management ko hamesha priority dena chahiye. Rising Wedge pattern ko confirm karne ke liye doosre technical tools ka istemal kiya jana chahiye aur trading strategy ko sahi tarah se implement kiya jana chahiye.


    • <a href="https://www.instaforex.org/ru/?x=ruforum">InstaForex</a>
    • #17 Collapse

      Rising Wedge Chart Pattern kai hy

      Click image for larger version

Name:	download (6).png
Views:	43
Size:	5.8 کلوبائٹ
ID:	12864993

      Rising Wedge Chart Pattern ek technical analysis pattern hai jo forex trading mein istemal hota hai. Ye pattern typically uptrend ke doran develop hota hai aur price movement ko depict karta hai. Rising wedge ek reversal pattern bhi ho sakta hai, ya phir trend continuation pattern bhi, iske upar market conditions par depend karta hai.

      Yeh pattern ek wedge shape mein hota hai, jahan par price ek rising trend ke doran high highs aur high lows banata hai, lekin ye highs aur lows ek converging trend line ke darmiyan hoti hain. Neeche di gayi hai Rising Wedge Chart Pattern ke mukhtalif characteristics:
      1. Converging Trend Lines:
        • Rising wedge pattern mein ek upper trend line aur ek lower trend line hote hain jo slowly converge hoti hain.
        • Upper trend line ko peaks ya highs connect karte hain jo higher highs banate hain.
        • Lower trend line ko lows connect karte hain jo higher lows banate hain.
      2. Price Contraction:
        • Rising wedge pattern mein price contraction hota hai jahan par highs aur lows converge karte hain.
        • Price range narrow hota hai jaise ke wedge ka shape hota hai.
      3. Bearish Reversal Potential:
        • Agar rising wedge pattern ek uptrend ke doran develop hota hai, toh ye ek bearish reversal signal bhi ho sakta hai.
        • Jab price wedge ke neeche break kar leta hai, toh ye bearish trend ka signal ho sakta hai.
      4. Volume Analysis:
        • Rising wedge pattern ko confirm karne ke liye volume analysis ki zarurat hoti hai.
        • Agar price wedge ke neeche break karta hai aur volume bhi increase hota hai, toh ye bearish breakout ko confirm karta hai.
      5. Target Price:
        • Rising wedge pattern ke breakout ke baad target price ko calculate kiya ja sakta hai.
        • Target price ko typically wedge ke starting point se neeche ki taraf project kiya jata hai.

      Rising wedge pattern ko identify karne ke liye traders ko price charts ko carefully analyze karna hota hai. Is pattern ki pehchan aur samajh ke liye traders ko technical analysis ke concepts aur price action ko acche se samajhna zaroori hai.


      • #18 Collapse

        Rising Wedge Chart Pattern kai hy


        Click image for larger version

Name:	download (8).png
Views:	47
Size:	5.9 کلوبائٹ
ID:	12864999

        Rising Wedge Chart Pattern ek bearish reversal pattern hai jo market mein dekha jata hai jab price ek uptrend ke doran slow down karta hai aur ek potential reversal ki indication deta hai. Yeh pattern ek wedge shape mein hota hai jahan price ko ek rising trendline aur ek flat (horizontal) trendline ke darmiyan draw kiya jata hai. Chaliye is pattern ko detail mein samajhte hain:

        Rising Wedge Chart Pattern:
        • Rising Wedge pattern ek bearish reversal pattern hai jo generally uptrend ke doran dekha jata hai. Is pattern mein price ek rising trendline aur ek flat (horizontal) trendline ke darmiyan converge hota hai.
        • Rising Wedge pattern mein price ke higher highs aur higher lows form hote hain, lekin trendlines ke darmiyan ke gap continuously narrow hota hai.
        • Rising Wedge pattern ko identify karne ke liye, traders ko price ke higher highs aur higher lows ko connect karke ek rising trendline aur ek flat trendline draw karna hota hai. Price in dono trendlines ke darmiyan move karta hai.
        • Is pattern ko confirm karne ke liye, traders ko wait karna hota hai jab price rising trendline ko break karta hai aur neeche girne lagta hai. Yeh bearish breakout ka indication hota hai aur bearish reversal ki shuruat ho sakti hai.

        Rising Wedge Pattern Key Points (Mukhya Baatein):
        1. Rising Wedge pattern ek bearish reversal pattern hai jo uptrend ke doran dekha jata hai.
        2. Is pattern mein price ek rising trendline aur ek flat trendline ke darmiyan converge karta hai.
        3. Price ke higher highs aur higher lows ke saath trendlines ke darmiyan ka gap continuously narrow hota hai.
        4. Bearish reversal ka indication tab hota hai jab price rising trendline ko break karta hai aur neeche girne lagta hai.

        Rising Wedge pattern ek bearish reversal signal hai jo traders ko market mein price direction ke potential changes ki indication deta hai. Lekin, jaise har technical analysis tool ke saath hota hai, is pattern ko confirm karne ke liye dusri technical indicators ka bhi istemal kiya jana chahiye.
        • #19 Collapse

          Rising Wedge Chart Pattern

          Click image for larger version

Name:	Rising-Wedge-Chart-Pattern-1024x576.jpg
Views:	43
Size:	113.3 کلوبائٹ
ID:	12865019

          Rising Wedge Chart Pattern, ya sarhad ko ooper uthane wala chart pattern, ek bearish reversal pattern hai jo price chart par dekhne mein ek triangle shape mein hota hai. Ye typically uptrend ke dauraan dekha jata hai aur bearish reversal ki indication deta hai. Is pattern mein neeche di gayi details hoti hai:
          1. Formation: Rising Wedge pattern ek bearish reversal pattern hota hai jo typically uptrend ke dauraan form hota hai. Is pattern mein price chart par ek wedge shape banta hai, jismein price ke highs aur lows ek saath increase karte hain, lekin highs aur lows ke beech ki distance narrow hoti hai.
          2. Appearance: Rising Wedge pattern ka appearance is tarah hota hai:
            • Highs aur lows ke beech ki trend lines converge (aapas mein nazdeek aati hai).
            • Highs ki trend line ko resistance line ya upper trend line kehte hain, aur lows ki trend line ko support line ya lower trend line kehte hain.
            • Price chart par ye pattern wedge shape mein hota hai, jismein highs aur lows ki trend lines converge hoti hain.
          3. Interpretation: Rising Wedge pattern bearish reversal ke liye ek indication deta hai. Ye uptrend ke dauraan form hota hai aur typically bearish breakout ke baad dekha jata hai. Is pattern mein price ki highs aur lows ke beech ki narrowing range bearish sentiment ko darust karta hai.
          4. Key Characteristics:
            • Wedge shape: Rising Wedge pattern ek wedge shape mein hota hai, jismein price ki highs aur lows ki trend lines converge hoti hain.
            • Bearish breakout: Is pattern ke baad, jab price lower trend line ko break karta hai, tab bearish reversal ki confirmation hoti hai.
            • Volume: Volume ki decreasing trend dekhne se pehle breakout ki possibility hoti hai.
          5. Trading Strategy:
            • Entry point: Agar aap Rising Wedge pattern ko dekhte hain, to aapko bearish breakout ka wait karna chahiye. Jab price lower trend line ko break karta hai, tab aap short positions consider kar sakte hain.
            • Stop-loss order: Aap apne short positions ke liye stop-loss order upper trend line ke just above set kar sakte hain.
            • Profit target: Aap profit target ko previous swing low levels ya technical analysis ke aur support levels ke near rakh sakte hain.

          Rising Wedge Chart Pattern ek powerful bearish reversal signal hai, lekin traders ko always confirmatory signals aur risk management ke saath is pattern ko trade karna chahiye.
          • #20 Collapse

            Forex Trading Mein Urooj Pazeer Wedge Chart Pattern

            Forex trading mein chart patterns ka istemal aik aham hissa hai jo traders ko market trends aur price movements ko samajhne mein madad deta hai. Ek aham chart pattern jo traders ke liye khasa ahem hai, wo hai "Rising Wedge". Ye pattern market mein uptrend ya bullish trend ke doran dekha jata hai aur traders ke liye potential trading opportunities pesh karta hai. Is article mein, hum "Rising Wedge" chart pattern ke baray mein mazeed tafseelat bayan karenge.

            1. Wedge Chart Patterns:

            Chart patterns forex trading mein technical analysis ka ek bada hissa hain. In patterns ki madad se traders market trends ko identify karte hain aur future price movements ka andaza lagate hain. Wedge chart patterns do qisam ke hote hain: Rising Wedge aur Falling Wedge. Rising Wedge ek bearish reversal pattern hai jo uptrend ke doran dekha jata hai.

            2. Rising Wedge Ka Tareef:

            Rising Wedge ek chart pattern hai jo price mein aik triangle formation banata hai jahan market higher highs aur higher lows banata hai. Ye pattern typically uptrend ke doran dekha jata hai aur ye ek bearish reversal pattern hai. Is pattern mein price apni peak tak barhti hai lekin uski growth ki speed slow hoti hai aur phir gradual downward movement shuru hoti hai.

            3. Rising Wedge Ki Shartein:

            Rising Wedge ko samajhne ke liye kuch shartein hain jo traders ko dhyan mein rakhni chahiye:
            • Price mein higher highs aur higher lows hona chahiye.
            • Price ki upward movement ki speed slow honi chahiye.
            • Upper trend line aur lower trend line ko connect karke ek wedge shape form honi chahiye.
            • Volume mein kamzori dekhi jati hai jab price wedge ke andar hoti hai.
            • Breakout ke baad price mein downward movement dekha jata hai.

            4. Trading Strategies for Rising Wedge:

            Rising Wedge pattern ki samajh se traders ko trading strategies develop karne mein madad milti hai. Kuch strategies jo Rising Wedge pattern ke istemal karti hain, wo ye hain:
            • Short Entry: Agar price Rising Wedge ke neeche breakout karta hai, to traders short positions le sakte hain.
            • Stop Loss Placement: Stop loss ko upper trend line ke thora ooper rakha jata hai takay false breakout se bacha ja sake.
            • Profit Target: Profit target ko lower trend line ya phir previous support level par rakha jata hai.

            5. Conclusion:

            Forex trading mein chart patterns ki samajh aur unke istemal se traders ko market mein behtar trading opportunities milte hain. Rising Wedge ek aham bearish reversal pattern hai jo uptrend ke doran dekha jata hai. Is pattern ko samajh kar, traders apni trading strategies ko improve kar sakte hain aur market ke movements ko behtar tareeqay se predict kar sakte hain.

            Final Words:

            Rising Wedge chart pattern forex trading mein traders ke liye ek aham tool hai jo unhe market trends aur price movements ko samajhne mein madad deta hai. Is pattern ko samajh kar, traders apni trading decisions ko improve kar sakte hain aur market ke fluctuations ko samajh sakte hain. Lekin, har trading decision lene se pehle thorough analysis aur risk management ka istemal zaroori hai.
             
            • #21 Collapse


              RISING WEDGE CHART PATTERN DEFINITION

              Best time frame ka depend asset ki traded us Ke volatility investment ki strategy ya trader and risk tolerances per bhi ho sakta hai wedge Jaise technical pattern ki long-run usefulness par debate remains hai analysis ke liye use kiye jaane wale time frame ke lihaz se rising wedge pattern ki effectiveness mukhtlif ho sakti hai SUGGEST Yeh research Karti Hai Ke picture ke pattern consistent indicator reveal Karte Hain halanke entry ya exit Ke Liye Koi single guaranteed Nahin Hai while rising wedge pattern trader and investors ke between apni predictive power ke liye ek recognized tool hai but ise diversified trading ya investment ki strategy ke part ke Taur per use Kiya Jana chahie rising wedge ko generally Bearish Ka pattern considered jata hai Kyunki yah signal Deta Hai Ke buying ki momentum slowing down ho rahi hai


              WHAT DOES A RISING WEDGE PATTERN SIGNAL

              Rising wedge pattern ki characterized converging trend line Se Hoti Hai Jahan support and resistance level donon upward sloping Hote Hain but support Line ki slope resistance line se More steeper hoti hai rising wedge pattern generally up Trend ke bad occur Hota Hai and security ki price mein potential reversal ka signal deta hai yah ek bearish chart ki formation hai Jise generally trade and investment Ke context main technical analysis Mein observed Kiya jata hai


              TRADING THE RISING WEDGE PATTERN

              Rising wedge pattern ki trading main strategic step ka ek series involve hai Jiska aimed iske bearish reversal signal se capitalizing hai Kuchh general approach yah hain confirmation: wedge ki formation ke dauran volume Mein declining additional confirmation ke Taur per Serve kar sakti hai trading main entering hone se pahle trader ya investor confirmation ka wait Karega yah typically lower trend line ke below price ke break out ki form Mein Aata Hai entry point: lower trend line ke below break out point entry point ke Tor per serves karta hai pattern ki confirmation hone ke bad trader often short position Mein enter Hote Hain identified: first step chart per rising wedge pattern ki identify karna hai Ek trader ya investor higher high ya lower low ke sath converging Hote hue Upar ki taraf Slope trend ki look Karega
              • #22 Collapse


                Wedge Chart Pattern: Fawaid Aur Nuksanat

                Tasreeh:

                Forex trading mein chart patterns ka istemal ahem hota hai kyunki ye traders ko market ke trends ko samajhne aur trading ke faislay lene mein madad karta hai. Wedge chart pattern bhi in patterns mein se aik hai jo market ke trend ki direction ko darust karta hai. Is article mein, hum wedge chart pattern ke fawaid aur nuksanat ke bare mein tafseel se baat karenge, jisse traders ko is pattern ko samajhne aur istemal karne mein madad mile.

                Wedge Chart Pattern:

                Wedge chart pattern aik continuation pattern hai jo market ke trend ke direction ko indicate karta hai. Ye pattern do tarah ka hota hai: ascending wedge aur descending wedge.
                1. Ascending Wedge:

                  Ascending wedge pattern bullish trend ke doran banta hai aur ye market mein price consolidation ke doran hota hai. Is pattern mein ek trend line upward slope par hoti hai jo market ke highs ko connect karti hai aur doosri trend line horizontal hoti hai jo market ke lows ko connect karti hai. Dono lines ke darmiyan price range hoti hai jo dheere dheere choti hoti hai. Ye pattern generally market mein bearish reversal ko indicate karta hai.

                  Fawaid:
                  • Ascending wedge pattern ko pehchanna asan hota hai aur iska istemal trading strategies mein kiya ja sakta hai.
                  • Is pattern se traders ko market ke bearish reversal ke baare mein pehle indications milte hain, jo unhe trading opportunities faraham karta hai.

                  Nuksanat:
                  • False breakouts ki possibility hoti hai, jo traders ko galat trading decisions lena pad sakta hai.
                  • Is pattern ke confirmation ke liye additional technical analysis ki zaroorat hoti hai, jaise ke volume analysis ya price action analysis.
                2. Descending Wedge:

                  Descending wedge pattern bearish trend ke doran banta hai aur ye market mein price consolidation ke doran hota hai. Is pattern mein ek trend line downward slope par hoti hai jo market ke lows ko connect karti hai aur doosri trend line horizontal hoti hai jo market ke highs ko connect karti hai. Dono lines ke darmiyan price range hoti hai jo dheere dheere choti hoti hai. Ye pattern generally market mein bullish reversal ko indicate karta hai.

                  Fawaid:
                  • Descending wedge pattern ko pehchanna asan hota hai aur iska istemal trading strategies mein kiya ja sakta hai.
                  • Is pattern se traders ko market ke bullish reversal ke baare mein pehle indications milte hain, jo unhe trading opportunities faraham karta hai.

                  Nuksanat:
                  • False breakouts ki possibility hoti hai, jo traders ko galat trading decisions lena pad sakta hai.
                  • Is pattern ke confirmation ke liye additional technical analysis ki zaroorat hoti hai, jaise ke volume analysis ya price action analysis.

                Fawaid Aur Nuksanat:

                Fawaid:
                1. Pehchane Jane Ki Asani:

                  Wedge chart pattern ko pehchanna asan hota hai aur iska istemal traders ke liye aik faida hota hai. Traders ko market mein price action ko samajhne aur trend ke direction ko identify karne mein madad milti hai.
                2. Early Reversal Indication:

                  Wedge chart pattern early reversal indications faraham karta hai. Agar ek ascending wedge pattern dekha jaye to ye bearish reversal ke baare mein pehle indications deta hai, jabke ek descending wedge pattern bullish reversal ke baare mein pehle indications deta hai.
                3. Trading Opportunities:

                  Is pattern se traders ko trading opportunities milte hain. Jab ye pattern sahi taur par pehchana jata hai aur confirmation ke saath trade kiya jata hai, to ye traders ko profitable trades faraham karta hai.

                Nuksanat:
                1. False Breakouts:

                  Ek common problem wedge chart pattern ke sath false breakouts ki possibility hai. Kabhi-kabhi market price lines ko break karta hai lekin phir se wapas aata hai, jo traders ko confuse kar sakta hai aur galat trading decisions par le jata hai.
                2. Confirmation Ki Zaroorat:

                  Wedge chart pattern ke confirmation ke liye additional technical analysis ki zaroorat hoti hai. Sirf pattern ko dekh kar trading decision lena risky ho sakta hai, isliye volume analysis, price action analysis, aur doosri technical indicators ka istemal kiya jana chahiye.

                Conclusion:

                Wedge chart pattern forex trading mein ahem role ada karta hai aur traders ko market ke trends ko samajhne aur trading ke faislay lene mein madad karta hai. Is pattern ko sahi taur par samajhne aur istemal karne se traders ko early reversal indications milte hain aur unhe trading opportunities faraham hoti hain. Halanki, is pattern ke saath false breakouts ki possibility hoti hai aur iske confirmation ke liye additional technical analysis ki zaroorat hoti hai. Isliye traders ko wedge chart pattern ko samajhne ke liye mehnat aur practice ki zaroorat hai taake wo isse faida utha sakein aur apni trading performance ko behtar banayein.


                • #23 Collapse

                  Rising Wedge Chart Pattern

                  Rising wedge chart pattern ek bearish chart pattern hai jo ek uptrend ke dauran banta hai. Yah pattern do converging trendlines se banta hai, jahan support line resistance line se zyada tej dhalan wali hoti hai. Iska matlab hai ki uptrend ke dauran, high aur low donon badhate hain, lekin high zyada tej rate se badhate hain. Yah pattern ek wedge ki tarah dikhta hai, jiska upar ka hissa chauda aur niche ka hissa patla hota hai.
                  Click image for larger version

Name:	IMG_0942.png
Views:	33
Size:	12.7 کلوبائٹ
ID:	12865705

                  Rising Wedge Chart Pattern Ki Visheshtaen:
                  • Do converging trendlines: Rising wedge pattern ki sabse mahatvpurn visheshta do converging trendlines hain. Support line aamtaur per resistance line se zyada tej dhalan wali hoti hai.
                  • Uptrend: Yah pattern ek uptrend ke dauran banta hai.
                  • Kam hota volume: Jaise-jaise pattern banta hai, volume kam hota jata hai. Yah is baat ka sanket hai ki kharidaron aur bikvalon ke bich sangharsh badh raha hai.

                  Rising Wedge Chart Pattern Ka Matlab Kya Hai?

                  Rising wedge chart pattern ek bearish signal hai. Yah is baat ka sanket deta hai ki uptrend khatm hone wala hai aur ek downtrend shuru hone wala hai. Pattern ka breakout, jab price support line se niche todta hai, to downtrend ki shuruaat ka sanket deta hai.


                  Rising Wedge Chart Pattern Ka Istemal Kaise Karen?

                  Rising wedge chart pattern ka istemal bearish trade setup ki pahchan karne ke liye kiya ja sakta hai. Niche kuchh tips di gai hain:
                  • Trendlines ki pahchan karen: Sabse pahle, pattern ki do trendlines ki pahchan karen. Support line aamtaur per resistance line se zyada tej dhalan wali hoti hai.
                  • Volume ki nigrani karen: Jaise-jaise pattern banta hai, volume kam hota jata hai. Yah is baat ka sanket hai ki kharidaron aur bikvalon ke bich sangharsh badh raha hai.
                  • Breakout ka intezar karen: Trade karne se pahle, pattern ke breakout ka intezar karen. Breakout, jab price support line se niche todta hai, to downtrend ki shuruaat ka sanket deta hai.
                  • Stop-loss order ka istemal karen: Apne trade ko protect karne ke liye stop-loss order ka istemal karen. Stop-loss order ko support line se thoda upar rakhna chahie.

                  Rising Wedge Chart Pattern Ki Seemaen:

                  Rising wedge chart pattern ek perfect nahin hai. Kuchh seemaen is prakar hain:
                  • Galat signal: Yah pattern kabhi-kabhi galat signal de sakta hai. Isliye, dusre technical indicators ke sath is pattern ka istemal karna mahatvpurn hai.
                  • Subjective: Trendlines ki pahchan subjective ho sakti hai. Isliye, dusre traders se dusri rai lena mahatvpurn hai.

                  Rising Wedge Chart Pattern Ke Kuchh Uddaharan:

                  Niche kuchh rising wedge chart pattern ke uddaharan diye gaye hain:
                  Rising Wedge Chart Pattern Ke Bare Mein Adhik Jaanane Ke Liye Sansadhan:
                  Rising Wedge Chart Pattern Ke Bare Mein Aapke Kya Vichar Hain?

                  Agar aapke pass rising wedge chart pattern ke bare mein koi sawal ya vichar hai,
                  • #24 Collapse

                    Rising Wedge Chart Pattern KAI HY


                    Rising Wedge Chart Pattern Kya Hai?

                    Rising wedge chart pattern ek technical analysis concept hai jo traders aur investors ko market trends aur price movements ke regarding information provide karta hai. Ye pattern typically price consolidation periods mein dekha jata hai aur bullish trends ke reversal indicators mein se ek hai.

                    Rising Wedge Pattern Ki Tashkeel:

                    Rising wedge pattern ek bearish reversal pattern hai jo typically uptrend ke doran develop hota hai. Ye pattern do trend lines ke darmiyan hota hai jo price ke higher highs aur higher lows ko connect karte hain. Upper trend line ko resistance line aur lower trend line ko support line kaha jata hai. Ye dono lines usually upar ki taraf slope karti hain.

                    Rising Wedge Pattern Ka Matlab:
                    1. Price Consolidation: Rising wedge pattern price consolidation ya range-bound movement ko indicate karta hai, jahan price ek narrow range mein move karta hai.
                    2. Bullish Trend Reversal: Ye pattern usually bullish trend ke reversal ko suggest karta hai. Jab ye pattern develop hota hai, ye indicate karta hai ke buyers ki strength kamzor hoti ja rahi hai aur sellers ki dominance barh rahi hai.
                    3. Bearish Signal: Rising wedge pattern bearish signal provide karta hai, matlab ke traders ko ye samajhne mein madad karta hai ke market ka trend badalne wala hai aur downward movement ki possibility hai.

                    Rising Wedge Pattern Aur Trading Strategies:
                    1. Short Positions: Jab rising wedge pattern confirm hota hai, traders short positions le sakte hain, ya existing long positions ko close kar sakte hain.
                    2. Stop Loss Aur Take Profit Levels: Traders ko stop loss aur take profit levels set karna chahiye apne trades ke liye taake risk ko manage kar sakein aur profit maximize kar sakein.
                    3. Volume Analysis: Rising wedge pattern ke sath trading karte waqt volume analysis bhi important hota hai. Agar volume decreasing hai jab ye pattern develop ho raha hai, to ye bearish signal ko confirm karta hai.

                    Nirnay:

                    Rising wedge pattern ek important technical analysis tool hai jo traders ko market trends aur price movements ke regarding valuable insights provide karta hai. Iska istemal karke traders apne trading strategies ko refine kar sakte hain aur better trading decisions le sakte hain. Lekin, hamesha zaroori hai ke doosre technical indicators aur market context ko bhi consider kiya jaye trading ke nirnay lene se pehle.


                    • #25 Collapse

                      Rising Wedge Chart Pattern


                      Click image for larger version

Name:	grade7-rising-wedge-continuation-after.png
Views:	28
Size:	15.2 کلوبائٹ
ID:	12865730


                      "Rising Wedge Chart Pattern" ek bearish reversal pattern hai jo candlestick charts par dikhai deta hai. Is pattern ka formation typically uptrend ke baad hota hai aur bearish reversal ka signal deta hai.
                      Pattern ka formation wedge ya triangle shape mein hota hai, jisse iska naam "Rising Wedge" hai. Is pattern mein price mein higher highs aur higher lows ki formation hoti hai jo wedge ke andar fit hoti hai.

                      Rising Wedge Chart Pattern ko identify karne ke liye traders ko kuch important components par dhyan dena hota hai:

                      Trend: Pattern ke formation se pehle ek clear uptrend hota hai.

                      Wedge Shape: Pattern ka shape wedge ya triangle ke tarah hota hai, jismein price gradually higher highs aur higher lows banata hai. Upper trend line ko resistance line kehte hain aur lower trend line ko support line.

                      Volume: Volume ka bhi dhyan diya jata hai is pattern ke formation ke doran. Typically, volume wedge ke doran decrease hota hai, indicating decreasing momentum.

                      Rising Wedge Chart Pattern bearish reversal ko indicate karta hai aur iska istemal karke traders potential downtrend ko anticipate kar sakte hain. Jab price wedge ke support line ko break karta hai aur downside move karta hai, toh yeh pattern ka confirmation hota hai.

                      Lekin, jaise har trading pattern ki tarah, false signals bhi ho sakte hain, isliye thorough analysis aur confirmatory signals ka wait karna important hai. Traders ko bhi risk management ka dhyan rakhna chahiye jab Rising Wedge Chart Pattern ka istemal karte hain.
                      • #26 Collapse

                        Rising Wedge Chart Pattern


                        Click image for larger version

Name:	rising-wedge-chart-pattern.jpg
Views:	28
Size:	52.8 کلوبائٹ
ID:	12865749


                        Rising Wedge Chart Pattern, ya "Bharta Huwa Wedge Chart Pattern", ek bearish reversal pattern hai jo candlestick charts par dikhai deta hai. Yeh pattern typically uptrend ke baad dikhta hai aur bearish reversal ka signal deta hai.
                        Is pattern ka formation wedge ya triangle shape mein hota hai, jisse iska naam "Rising Wedge" hai. Is pattern mein price mein higher highs aur higher lows ki formation hoti hai jo wedge ke andar fit hoti hai.

                        Rising Wedge Chart Pattern ko identify karne ke liye traders ko kuch important components par dhyan dena hota hai:

                        Trend (Trend): Pattern ke formation se pehle ek clear uptrend hota hai.

                        Wedge Shape (Wedge Ka Shape): Pattern ka shape wedge ya triangle ke tarah hota hai, jismein price gradually higher highs aur higher lows banata hai. Upper trend line ko resistance line kehte hain aur lower trend line ko support line.

                        Volume (Volume): Volume ka bhi dhyan diya jata hai is pattern ke formation ke doran. Typically, volume wedge ke doran decrease hota hai, indicating decreasing momentum.

                        Rising Wedge Chart Pattern bearish reversal ko indicate karta hai aur iska istemal karke traders potential downtrend ko anticipate kar sakte hain. Jab price wedge ke support line ko break karta hai aur downside move karta hai, toh yeh pattern ka confirmation hota hai.

                        Lekin, jaise har trading pattern ki tarah, false signals bhi ho sakte hain, isliye thorough analysis aur confirmatory signals ka wait karna important hai. Traders ko bhi risk management ka dhyan rakhna chahiye jab Rising Wedge Chart Pattern ka istemal karte hain.
                        • #27 Collapse

                          **Rising Wedge Chart Pattern: Ek Tashreeh**
                          Forex aur stock trading mein chart patterns ka bahut bada role hota hai, aur in patterns mein se ek "Rising Wedge" hai. Rising Wedge pattern market ke price movements ka ek specific type hai jo trend reversal ka signal de sakta hai. Is pattern ko samajhna aur identify karna traders ke liye important hai, kyun ke yeh market ki future direction ko predict karne mein madadgar ho sakta hai.

                          Rising Wedge pattern tab banta hai jab price steadily badhti hai, lekin uske saath saath high aur low points gradually ek narrow range mein compress hote hain. Iska matlab hai ke price higher highs aur higher lows bana rahi hoti hai, lekin yeh upward movement dheere dheere ek tighter range mein limited hoti hai. Is pattern ko "wedge" isliye kaha jata hai kyunki price ka chart ek wedge shape bana leta hai jo niche se upar ki taraf narrow hota hai.

                          Rising Wedge pattern ka characteristic feature yeh hai ke yeh generally ek bullish trend ke baad banta hai, lekin iska matlab yeh nahi ke market hamesha upar jaayegi. Asal mein, yeh pattern ek potential bearish reversal ka signal hota hai. Jab price is pattern ke upper trendline ko break karti hai, to yeh indicate karta hai ke uptrend ka momentum kam ho raha hai aur market downtrend mein ja sakti hai.

                          Rising Wedge pattern ko accurately identify karne ke liye, traders ko do cheezen dekhni chahiye: pattern ka formation aur volume. Jab price rising wedge formation complete kar leti hai aur trendline break hoti hai, to volume bhi typically increase hota hai. Volume ka badhna is baat ki confirmation hoti hai ke price movement strong hai aur trend reversal ka chance hai.

                          Is pattern ko trading strategy mein include karne ke liye, traders ko wait karna chahiye jab price wedge ke upper trendline ko break kare. Iske baad, traders short positions le sakte hain ya stop-loss orders set kar sakte hain. Proper risk management aur technical analysis is process mein crucial hote hain.

                          In conclusion, Rising Wedge pattern ek powerful tool hai jo traders ko market ke potential reversals ke baare mein early signals provide kar sakta hai. Is pattern ko samajhna aur effectively use karna, trading decisions ko improve karne mein madadgar hota hai.
                          • <a href="https://www.instaforex.org/ru/?x=ruforum">InstaForex</a>
                          • #28 Collapse

                            Rising Wedge Chart Pattern

                            Rising Wedge chart pattern ek technical analysis tool hai jo ke stock aur Forex trading mein istemal hota hai. Yeh pattern tab banta hai jab price steadily increase karti hai, lekin is increase ke sath wedge ka shape develop hota hai. Yeh pattern traders ko market ke future direction ka andaza lagane mein madad deta hai.

                            Pattern Ka Structure

                            Rising Wedge pattern do trendlines par mabni hota hai: ek upper trendline aur ek lower trendline. Upper trendline price ke high points ko connect karti hai, jabke lower trendline price ke low points ko connect karti hai. Dono trendlines ek dusre ke kareeb hoti hain aur wedge ka shape create karti hain. Is pattern mein price gradually higher highs aur higher lows banati hai, lekin wedge ka shape ek narrowing range ko indicate karta hai.

                            Pattern Ki Pehchan

                            Rising Wedge pattern ko pehchan na thoda mushkil ho sakta hai, lekin kuch khas indicators hain jo isko identify karne mein madad karte hain. Pehli baat, yeh pattern tab banta hai jab price ke high points consistently higher hote hain aur low points bhi higher hote hain, lekin trendlines ek dusre ke kareeb hoti hain. Doosri baat, volume ke level is pattern ke doran kam hota hai, jo is baat ko confirm karta hai ke buying pressure gradually kam ho raha hai.

                            Trading Strategy

                            Rising Wedge pattern ko trade karne ke liye, traders aksar pattern ke break out ka intezar karte hain. Jab price wedge ki upper trendline ko break karti hai, to yeh ek bearish signal hota hai. Iska matlab hai ke price neeche ki taraf move kar sakti hai. Trading ke liye, traders pattern ke break out point se sell order place kar sakte hain. Stop-loss ko pattern ke upper trendline ke thoda upar rakha jata hai taake unexpected price movements se bacha ja sake.

                            Target Setting

                            Target setting bhi important hai jab aap Rising Wedge pattern ke sath trade karte hain. Traders pattern ke break out ke baad target price calculate karne ke liye pattern ki height ko measure karte hain aur is height ko break out point se subtract karte hain. Yeh target price aapko help karega decide karne mein ke aap apna profit kab book karein.

                            Conclusion

                            Rising Wedge pattern ek valuable tool hai jo traders ko market ke direction ke bare mein insights provide karta hai. Yeh pattern bullish trends ke dauran banta hai aur jab yeh pattern complete hota hai to bearish reversal ka signal hota hai. Trading ke liye, traders ko pattern ke break out ka intezar karna chahiye aur apne trades ko properly manage karna chahiye. Yeh zaroori hai ke traders market ke volume aur price movement ko closely monitor karein taake accurate trading decisions le sakein.

                            Is pattern ko samajh kar aur sahi trading strategies use karke, traders market ke changes ko effectively capitalize kar sakte hain. Rising Wedge pattern ek valuable addition hai kisi bhi trader ke toolkit mein, lekin isse trade karne se pehle thorough analysis aur proper risk management zaroori hai.

                            اب آن لائن

                            Working...
                            X