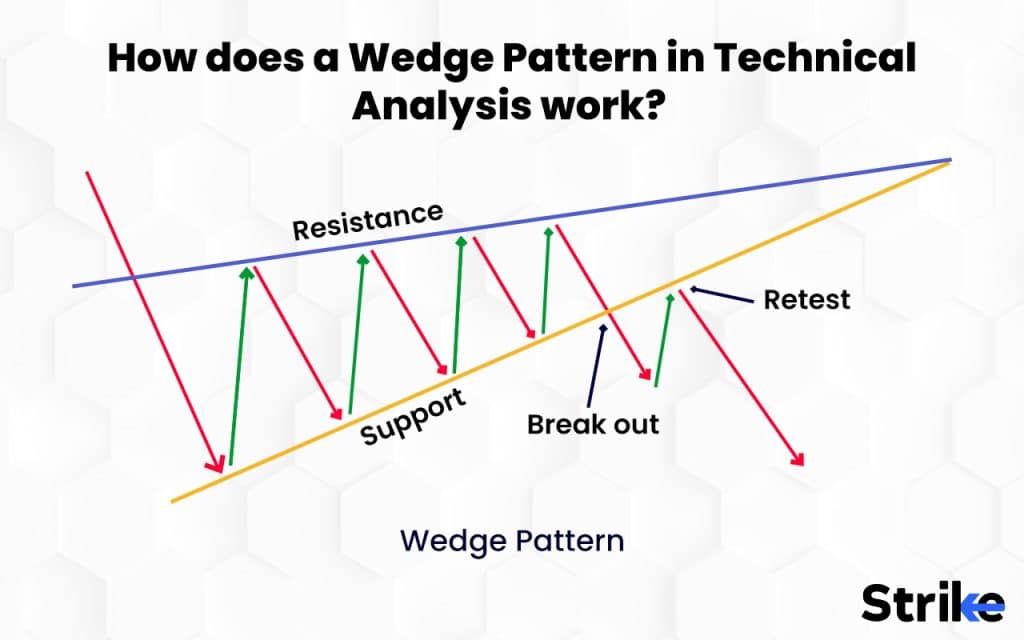
Rising Wedge ek chart pattern hai jo market analysis mein use hota hai. Is pattern mein price ek upward slope ki trend line ke andar converge hoti hai. Yeh kuch aur key points hain:
- Development: Rising Wedge formation mein price higher highs aur higher lows banata hai, lekin iske bawajood overall range narrow hoti jaati hai. Yeh indicate karta hai ki uptrend ki strength kam ho rahi hai.
- Volume: Typically, jab price wedge ke andar move karta hai, volume kam hone ki tendency hoti hai. Ye bhi indication hai ki market ke participants ka interest decrease ho raha hai.
- Breakout: Wedge ke breakout ke baad, price usually neeche ki taraf move karti hai. Ye breakout downside (downward breakout) ho sakta hai, jo ki trend reversal ya fir downward movement ki shuruat ho sakta hai.
- Trading Strategy: Traders Rising Wedge ke breakout ko observe karte hain. Agar downside breakout hota hai, toh woh selling positions le sakte hain ya existing long positions ko close kar sakte hain.
Is pattern ko analyze karte waqt, confirmations ke liye aur technical indicators ka use hota hai. Yeh important hai ki patterns ko samajhne ke liye ek comprehensive approach rakha jaaye aur decision lene se pehle thorough analysis kiya jaaye.
x market mein point or trend kay lahaz say jare pattern samjha ja sakta hey es bat say katay nazar jahan par rising wedge chart pattern banta hey foreRising wedge chart pattern aik kesam ka pattern hota hey jo keh forex market mei consolidation ka price pattern hota hey jes mein forex market mein price barhte hove trend lines kay darmean mein jore hove hote hey esay aik kesam ka bearish chart formation samjha jata hey jo keh forex trader ko esay hamaisha kay ley rehnoma asol ko kaim rakhna chihay keh yeh pattern natural tor par bearish ka chart patt


تبصرہ
Расширенный режим Обычный режим